San Michele al Tagliamento, Veneto Airbnb Market Data 2026: STR Report & Statistics
How much can you earn on Airbnb in San Michele al Tagliamento, Veneto? Based on AirROI's 2026 dataset (July 2025 – June 2026), the short answer is $7,884 per year — at a $386 nightly rate, 31.8% occupancy, and a $69 RevPAR that reflects a wider gap between nightly rates and realized revenue that rewards occupancy-focused strategies.
San Michele al Tagliamento's 470 active listings and selective demand that rewards strong listing quality and pricing strategy position it as a midsize vacation rental market. The market trimmed 7.3% of its supply while nightly rates moved higher — fewer listings competing for the same travelers, and those travelers are paying more. Hosts who can unlock occupancy through standout listings, flexible policies, and targeted marketing have clear revenue upside.
Regulation is high and 99% of listings show active registration — compliance is the cost of entry. For data-driven hosts, the opportunity lies in reading these signals and positioning accordingly.

Table of Contents [hide] [show]
What Are the Key Airbnb Metrics in San Michele al Tagliamento?
In San Michele al Tagliamento, the headline Airbnb metrics are $7,884 in average annual revenue,31.8% occupancy, $386 ADR, and $69 in RevPAR, and guests book about 79 days in advance.
How Much Do Airbnb Hosts Earn Monthly in San Michele al Tagliamento?
Understanding the monthly revenue variations for Airbnb listings in San Michele al Tagliamento is key to maximizing your short term rental income potential. Seasonality significantly impacts earnings. Our analysis, based on data from the past 12 months, shows that the peak revenue month for STRs in San Michele al Tagliamento is typically July, while February often presents the lowest earnings, highlighting opportunities for strategic pricing adjustments during shoulder and low seasons. Explore the typical Airbnb income in San Michele al Tagliamento across different performance tiers:
- Best-in-class properties (Top 10%) achieve $2,996+ monthly, often utilizing dynamic pricing and superior guest experiences.
- Strong performing properties (Top 25%) earn $1,853 or more, indicating effective management and desirable locations/amenities.
- Typical properties (Median) generate around $1,058 per month, representing the average market performance.
- Entry-level properties (Bottom 25%) see earnings around $578, often with potential for optimization.
Average Monthly Airbnb Earnings Trend in San Michele al Tagliamento
What Is the Monthly Airbnb Occupancy Rate in San Michele al Tagliamento?
Maximize your bookings by understanding the San Michele al Tagliamento STR occupancy trends. Seasonal demand shifts significantly influence how often properties are booked. Typically, Julysees the highest demand (peak season occupancy), while January experiences the lowest (low season). Effective strategies, like adjusting minimum stays or offering promotions, can boost occupancy during slower periods. Here's how different property tiers perform in San Michele al Tagliamento:
- Best-in-class properties (Top 10%) achieve 52%+ occupancy, indicating high desirability and potentially optimized availability.
- Strong performing properties (Top 25%) maintain 36% or higher occupancy, suggesting good market fit and guest satisfaction.
- Typical properties (Median) have an occupancy rate around 21%.
- Entry-level properties (Bottom 25%) average 10% occupancy, potentially facing higher vacancy.
Average Monthly Occupancy Rate Trend in San Michele al Tagliamento
What Is the Average Airbnb Nightly Rate in San Michele al Tagliamento?
Effective short term rental pricing strategy in San Michele al Tagliamento involves understanding monthly ADR fluctuations. The Average Daily Rate (ADR) for Airbnb in San Michele al Tagliamento typically peaks in February and dips lowest during September. Leveraging Airbnb dynamic pricing tools or strategies based on this seasonality can significantly boost revenue. Here's a look at the typical nightly rates achieved:
- Best-in-class properties (Top 10%) command rates of $929+ per night, often due to premium features or locations.
- Strong performing properties (Top 25%) achieve nightly rates of $767 or more.
- Typical properties (Median) charge around $171 per night.
- Entry-level properties (Bottom 25%) earn around $116 per night.
Average Daily Rate (ADR) Trend by Month in San Michele al Tagliamento
What Is the RevPAR for Airbnb in San Michele al Tagliamento?
RevPAR in San Michele al Tagliamento is currently $69. Because RevPAR combines nightly rates with realized occupancy, it is one of the cleanest ways to compare how efficiently listings turn demand into revenue across the market.
- Entry-level properties (Bottom 25%) see $32 RevPAR.
- Typical properties (Median) generate $53 RevPAR.
- Strong performers (Top 25%) earn $85 RevPAR.
- Best-in-class (Top 10%) achieve $124 RevPAR.
Average Monthly RevPAR Trend in San Michele al Tagliamento
RevPAR Insights for San Michele al Tagliamento
- The average RevPAR in San Michele al Tagliamento is $69. This metric combines nightly rates with realized occupancy, making it one of the best single-number indicators of market efficiency.
- The gap between the top 10% ($124) and bottom 25% ($32) is $92, suggesting a relatively compressed market where operational differences yield moderate returns.
- RevPAR peaks in Jul and bottoms out in Feb, mirroring the broader seasonal demand pattern and suggesting opportunities for dynamic pricing.
Recommendations for Hosts
- Track your own RevPAR monthly against these San Michele al Tagliamento benchmarks. If your RevPAR falls below the median of $53, examine whether low occupancy or low ADR is the primary drag.
- Top-quartile listings achieve $85+ RevPAR through a combination of competitive pricing, strong reviews, and strategic amenities. Target this tier through incremental improvements.
- Use RevPAR rather than revenue alone when comparing properties of different sizes — it normalizes for available nights and gives a more accurate picture of performance.
Get Live San Michele al Tagliamento Market Intelligence 👇
Explore Real-time Analytics
When Is the Peak Season for Airbnb in San Michele al Tagliamento?
San Michele al Tagliamento's peak Airbnb season falls in July, August, June, while the softest stretch is January, February, March. Overall, the market shows highly seasonal trends requiring careful strategy, which should guide pricing, minimum stays, and cash-flow planning.
Peak Season (July, August, June)
- Revenue averages $3,112 per month
- Occupancy rates average 45.0%
- Daily rates average $315
Shoulder Season
- Revenue averages $1,177 per month
- Occupancy maintains around 21.6%
- Daily rates hold near $393
Low Season (January, February, March)
- Revenue drops to average $636 per month
- Occupancy decreases to average 13.3%
- Daily rates adjust to average $535
Seasonality Insights for San Michele al Tagliamento
- Airbnb seasonality in San Michele al Tagliamento is pronounced. Revenue swings sharply between peak and low months, which means pricing strategy, minimum-stay settings, and cash reserves all need to account for extended slower periods.
- During the high season, the absolute peak month showcases San Michele al Tagliamento's highest earning potential, with monthly revenues climbing to $3,516, occupancy reaching 53.2%, and ADRs peaking at $573.
- Conversely, the slowest single month marks the market's lowest point — revenue may dip to $495, occupancy could drop to 10.5%, and ADRs may adjust to $208.
- Lower occupancy paired with meaningful seasonality means hosts in San Michele al Tagliamento need to maximize every peak-season booking and seriously consider whether off-season pricing adjustments or minimum-stay changes can capture incremental revenue.
Seasonal Strategies for Maximizing Profit
- Peak Season: Maximize revenue through premium pricing. In a high-regulation market like San Michele al Tagliamento, ensure your permit covers the number of nights you plan to book — some jurisdictions cap annual rental days.
- Low Season: Offer competitive pricing, extended-stay discounts, and flexible cancellation policies. Target off-season travelers like remote workers, budget-conscious guests, and travelers with flexible schedules.
- Shoulder Seasons: Implement dynamic pricing that bridges peak and low rates. Target weekend travelers, local events, and business visitors. Slightly more flexible terms than peak season can help maintain occupancy without deep discounting.
- In a highly seasonal market like San Michele al Tagliamento, building a cash reserve during the top months is essential for covering fixed costs during the slow period. Automated pricing tools can help capture demand shifts in real time.
Do You Need a License for Airbnb in San Michele al Tagliamento?
Yes, San Michele al Tagliamento, Veneto, Italy enforces high STR regulations and 99% of active listings show registration evidence — indicating that enforcement is active and compliance is a prerequisite for operating legally. Hosts entering this market should budget for permit fees, inspections, and potential occupancy tax obligations as part of their startup costs. Always verify the latest short-term rental regulations and Airbnb license requirements directly with local government authorities for San Michele al Tagliamento to ensure full compliance before hosting.
(Source: AirROI data, 2026, based on 99% licensed listings)
What Are the Best Neighborhoods for Airbnb in San Michele al Tagliamento?
Location within San Michele al Tagliamento matters. Even in a midsize market, the difference between neighborhoods can mean a material gap in occupancy, nightly rate, and overall Airbnb revenue. Below are 8 areas where short-term rental activity and guest interest are concentrated — along with the reasons each neighborhood appeals to travelers.
| Neighborhood / Area | Why Host Here? (Target Guests & Appeal) | Key Attractions & Landmarks |
|---|---|---|
| Bibione | Bibione is a renowned beach resort known for its beautiful sandy shores and family-friendly atmosphere. It's a prime location for tourists looking for a relaxing beach vacation, attracting families and couples during the summer months. | Bibione Beach, Thermal Spa, Luna Park Adriatico, Val Grande Park, Bibione Lighthouse |
| Lignano Sabbiadoro | Lignano Sabbiadoro offers a vibrant atmosphere with a wide range of entertainment options, making it a popular destination for beachgoers. Its lively promenade and numerous restaurants cater to both families and young people. | Lignano Beach, Aquasplash Water Park, Parco Zoo Punta Verde, Lignano Sabbiadoro Port, Lignano Beach Promenade |
| Portogruaro | Portogruaro is a charming medieval town that attracts tourists interested in history and culture. Its picturesque architecture and serene ambiance make it ideal for those seeking a unique Italian experience. | Portogruaro's Historical Centre, The Church of Sant'Agnese, Palazzo comunale, Museo Nazionale Concordiese, Piazza della Repubblica |
| Caorle | Caorle is a picturesque coastal town with beautiful beaches and a rich history. It offers a mix of relaxation and cultural experiences, appealing to a diverse range of visitors. | Caorle Beach, The Historic Centre of Caorle, The Cathedral of Caorle, Duna Verde Beach, Casoni di Caorle |
| Venezia | Venice is a world-renowned city known for its canals, historic architecture, and art. It attracts millions of tourists each year, making it a prime location for Airbnb hosts looking for high demand. | St. Mark's Basilica, Rialto Bridge, Venice Canals, Doge's Palace, Murano Island |
| Trieste | Trieste is a port city with a rich cultural heritage and beautiful seaside views. It's less touristy than Venice, making it an appealing choice for those looking for a unique experience in Northern Italy. | Piazza Unità d'Italia, Castello di Miramare, Teatro Romano, Canal Grande, Cattedrale di San Giusto |
| Grado | Grado is known for its beautiful beaches and historical sites, attracting families and beach lovers. Its relaxing environment makes it ideal for vacation rentals. | Grado Beach, Basilica di Santa Eufemia, Isola di Barbana, Lagoon of Grado, Grado Historical Center |
| Santo Stefano di Cadore | This charming mountain village is perfect for those looking for a nature getaway, attracting outdoor enthusiasts year-round with its access to hiking trails and scenic landscapes. | Dolomiti di Sesto, Trekking in the Dolomites, Lake Santa Caterina, Museo della Grande Guerra, Ski Resorts of the Dolomites |
Because San Michele al Tagliamento has a high regulation profile, confirming that short-term rental permits are available in your target neighborhood is a critical first step before committing to a property purchase. Regulation can vary at the neighborhood or district level even within the same city.
What Types of Properties Are on Airbnb in San Michele al Tagliamento?
Room Type Distribution
Property Type Distribution
Market Composition Insights for San Michele al Tagliamento
- The San Michele al Tagliamento Airbnb market composition is heavily skewed towards Entire Home/Apt listings, which make up 99.4% of the 470 active rentals. This indicates strong guest preference for privacy and space.
- Looking at the property type distribution in San Michele al Tagliamento, Apartment/Condo properties are the most common (87.4%), reflecting the local real estate landscape.
- Smaller segments like hotel/boutique, outdoor/unique (combined 0.4%) offer potential for unique stay experiences.
San Michele al Tagliamento Airbnb Room Capacity Analysis (2026): Bedroom Distribution
Distribution of Listings by Number of Bedrooms
Room Capacity Insights for San Michele al Tagliamento
- The dominant room capacity in San Michele al Tagliamento is 2 bedrooms listings, making up 44.5% of the market. This suggests a strong demand for properties suitable for couples or solo travelers.
- Together, 2 bedrooms and 1 bedroom properties represent 79.2% of the active Airbnb listings in San Michele al Tagliamento, indicating a high concentration in these sizes.
San Michele al Tagliamento Vacation Rental Guest Capacity Trends (2026)
Distribution of Listings by Guest Capacity
Guest Capacity Insights for San Michele al Tagliamento
- The most common guest capacity trend in San Michele al Tagliamento vacation rentals is listings accommodating 6 guests (28.1%). This suggests the primary traveler segment is likely larger groups.
- Properties designed for 6 guests and 5 guests dominate the San Michele al Tagliamento STR market, accounting for 52.8% of listings.
- 47.2% of properties accommodate 6+ guests, serving the market segment for larger families or group travel in San Michele al Tagliamento.
- On average, properties in San Michele al Tagliamento are equipped to host 5.4 guests.
How Do Listings in San Michele al Tagliamento Compare on Quality?
Listing quality in San Michele al Tagliamento can be approximated through presentation depth, bedroom count, and how often hosts disclose exact locations. These signals show how professionally the local supply base is merchandised.
Listing Quality Insights for San Michele al Tagliamento
- At 22.5 photos per listing on average, San Michele al Tagliamento hosts invest well in visual presentation. Listings with 20+ photos consistently outperform in search ranking and conversion.
- 80.0% of listings show their exact location. High transparency here builds guest trust and reduces inquiry-to-booking friction.
Recommendations for Hosts
- Use these quality indicators as a self-audit checklist. Listings that exceed the San Michele al Tagliamento averages across all three metrics are better positioned for premium pricing.
What Amenities Do Airbnb Guests Expect in San Michele al Tagliamento?
Amenity Prevalence
Amenity Insights for San Michele al Tagliamento
- Essential amenities in San Michele al Tagliamento that guests expect include: TV, Refrigerator, Air conditioning. Lacking these (any) could significantly impact bookings.
- Popular amenities like Free parking on premises, Kitchen, Stove are common but not universal. Offering these can provide a competitive edge.
Recommendations for Hosts
- Ensure your listing includes all essential amenities for San Michele al Tagliamento: TV, Refrigerator, Air conditioning.
- Prioritize adding missing essentials: TV, Refrigerator, Air conditioning.
- Consider adding popular differentiators like Free parking on premises or Kitchen to increase appeal.
- Highlight unique or less common amenities you offer (e.g., hot tub, dedicated workspace, EV charger) in your listing description and photos.
- Regularly check competitor amenities in San Michele al Tagliamento to stay competitive.
Which Airbnb Amenities Boost Revenue in San Michele al Tagliamento?
Not every amenity matters equally. This table focuses on the amenities most associated with higher revenue in San Michele al Tagliamento, which makes it more useful for prioritizing upgrades than a simple popularity list alone.
| Amenity | Prevalence | Revenue With | Revenue Without | Revenue Uplift |
|---|---|---|---|---|
ConditionerHigh opportunity | 1.9% | $23,951 | $7,570 | 216.4% |
Paid parking off premisesHigh opportunity | 2.1% | $22,313 | $7,570 | 194.7% |
Baking sheetHigh opportunity | 3.6% | $20,074 | $7,427 | 170.3% |
Paid parking on premisesHigh opportunity | 2.6% | $19,382 | $7,583 | 155.6% |
Air conditioning | 95.1% | $8,114 | $3,420 | 137.2% |
Shower gelHigh opportunity | 4.5% | $16,541 | $7,479 | 121.2% |
Books and reading materialHigh opportunity | 4.9% | $16,428 | $7,444 | 120.7% |
Cleaning products | 10.4% | $15,396 | $7,010 | 119.6% |
ToasterHigh opportunity | 5.5% | $15,900 | $7,415 | 114.4% |
Room-darkening shadesHigh opportunity | 8.7% | $15,331 | $7,172 | 113.7% |
Revenue Impact Insights for San Michele al Tagliamento
- Conditioner tops the revenue impact list with a 216.4% uplift — listings with this amenity earn $23,951 vs. $7,570 without it.
- High-opportunity amenities — Conditioner, Paid parking off premises, Baking sheet — combine revenue uplift above 100% with prevalence under 10%, meaning most competitors haven't adopted them yet.
- Air conditioning — while widespread — still correlate with meaningful revenue gains, making it table stakes rather than true differentiators.
Recommendations for Hosts
- Prioritize adding Conditioner — it has the best combination of high revenue impact and low market saturation in San Michele al Tagliamento.
- Focus your upgrade budget on amenities in the top half of this table. Below-median amenities may improve guest experience but contribute less to revenue growth.
- Highlight revenue-impacting amenities prominently in your listing title, photos, and description — guests can't value what they don't notice.
Dive Deeper: Advanced San Michele al Tagliamento STR Market Data (2026)
Ready to unlock more insights? AirROI provides access to advanced metrics and comprehensive Airbnb data for San Michele al Tagliamento. Explore detailed analytics beyond this report to refine your investment strategy, optimize pricing, and maximize your vacation rental profits.
Explore Advanced MetricsSan Michele al Tagliamento Airbnb Guest Demographics & Profile Analysis (2026)
Guest Profile Summary for San Michele al Tagliamento
- The typical guest profile for Airbnb in San Michele al Tagliamento consists of predominantly international visitors (79%), with top international origins including Italy, typically belonging to the Post-2000s (Gen Z/Alpha) group (50%), primarily speaking English or German.
- Domestic travelers account for 21.4% of guests.
- Key international markets include Germany (33.8%) and Italy (21.4%).
- Top languages spoken are English (37.7%) followed by German (24%).
- A significant demographic segment is the Post-2000s (Gen Z/Alpha) group, representing 50% of guests.
Recommendations for Hosts
- Focus marketing internationally, particularly towards travelers from Italy.
- Tailor amenities and listing descriptions to appeal to the dominant Post-2000s (Gen Z/Alpha) demographic (e.g., highlight fast WiFi, smart home features, local guides).
- Highlight unique local experiences or amenities relevant to the primary guest profile.
- Consider seasonal promotions aligned with peak travel times for key origin markets.
What Are Airbnb Guest Ratings in San Michele al Tagliamento?
Listings in San Michele al Tagliamento average 4.46 out of 5 overall, with about 9.5 reviews per active listing and 5.1% of listings carrying the Guest Favorite badge.
Rating Breakdown by Category
Guest Rating Insights for San Michele al Tagliamento
- At 4.46, the average rating in San Michele al Tagliamento suggests meaningful room for improvement across the market.
- The strongest subcategory is Location (4.69), while Cleanliness (4.38) trails behind — a useful signal for hosts looking to prioritize upgrades.
- 5.1% of listings carry the Guest Favorite badge, a strong trust signal that can meaningfully lift click-through and booking rates.
Recommendations for Hosts
- Focus improvement efforts on Cleanliness — even small gains in the weakest subcategory can lift overall ratings and search ranking.
- Encourage guests to leave reviews after checkout. Listings with more reviews rank higher in search results and convert browsers into bookers more effectively.
- With only 5.1% of listings earning Guest Favorite status, hosts who consistently exceed expectations have a clear competitive advantage.
San Michele al Tagliamento Airbnb Booking Patterns (2026): Available vs. Booked Days
Available Days Distribution
Booked Days Distribution
Booking Pattern Insights for San Michele al Tagliamento
- The most common availability pattern in San Michele al Tagliamento falls within the 271-366 days range, representing 92.6% of listings. This suggests many properties have significant open periods on their calendars.
- Approximately 99.6% of listings show high availability (181+ days open annually), indicating potential for increased bookings or specific owner usage patterns.
- For booked days, the 1-30 days range is most frequent in San Michele al Tagliamento (52.3%), reflecting common guest stay durations or potential owner blocking patterns.
- A notable 0.6% of properties secure long booking periods (181+ days booked per year), highlighting successful long-term rental strategies or significant owner usage.
How Far in Advance Do Guests Book Airbnb in San Michele al Tagliamento?
Average Booking Lead Time by Month
Booking Lead Time Insights for San Michele al Tagliamento
- The overall average booking lead time for vacation rentals in San Michele al Tagliamento is 79 days.
- Guests book furthest in advance for stays during November (average 195 days), likely coinciding with peak travel demand or local events.
- The shortest booking windows occur for stays in February (average 28 days), indicating more last-minute travel plans during this time.
- Seasonally, Fall (116 days avg.) sees the longest lead times, while Spring (47 days avg.) has the shortest, reflecting typical travel planning cycles.
Recommendations for Hosts
- Use the overall average lead time (79 days) as a baseline for your pricing and availability strategy in San Michele al Tagliamento.
- For November stays, consider implementing length-of-stay discounts or slightly higher rates for bookings made less than 195 days out to capitalize on advance planning.
- Target marketing efforts for the Fall season well in advance (at least 116 days) to capture early planners.
- Monitor your own booking lead times against these San Michele al Tagliamento averages to identify opportunities for dynamic pricing adjustments.
What Is the Average Length of Stay for Airbnb in San Michele al Tagliamento?
Guests in San Michele al Tagliamento stay about 7.7 nights on average, generating roughly 2,954 reservations and 6.3 bookings per listing in the latest AirROI dataset. The most common check-in time is 4:00 PM and check-out is 9:00 AM.
Monthly Length of Stay in San Michele al Tagliamento
Check-in Time Distribution
Check-out Time Distribution
Stay Pattern Insights for San Michele al Tagliamento
- Longer stays mean fewer turnovers and lower cleaning costs per revenue dollar. This pattern also opens the door to monthly discount strategies that attract remote workers and extended-stay travelers.
- Stay lengths peak in Jun (11 nights) and shorten in Jan (2.2 nights). Adjust minimum-night requirements seasonally to match.
Recommendations for Hosts
- Leverage the longer-stay pattern by offering weekly discounts — even 5-10% off can convert browsing into bookings for guests considering an extended stay.
- Set your check-in time to match or beat the market standard of 4:00 PM. Offering early check-in flexibility can be a low-cost differentiator.
- Monitor length-of-stay seasonality to adjust minimum-night requirements — longer minimums during peak periods maximize revenue while shorter minimums fill gaps in shoulder seasons.
San Michele al Tagliamento Airbnb Minimum Stay Requirements Analysis
Distribution of Listings by Minimum Night Requirement
1 Night
23 listings
4.9% of total
2 Nights
12 listings
2.6% of total
3 Nights
11 listings
2.3% of total
4-6 Nights
98 listings
20.9% of total
7-29 Nights
199 listings
42.3% of total
30+ Nights
127 listings
27% of total
Key Insights
- The most prevalent minimum stay requirement in San Michele al Tagliamento is 7-29 Nights, adopted by 42.3% of listings. This highlights the market's preference for shorter, flexible bookings.
- Very short stays (1-2 nights) are less common (7.5%), suggesting hosts prefer slightly longer bookings to optimize turnover.
- A significant segment (27%) caters to monthly stays (30+ nights) in San Michele al Tagliamento, pointing to opportunities in the extended-stay market.
Recommendations
- Align with the market by considering a 7-29 Nights minimum stay, as 42.3% of San Michele al Tagliamento hosts use this setting.
- If feasible, allowing 1-night stays, especially midweek or during low season, could capture last-minute bookings, as only 4.9% currently do.
- Explore offering discounts for stays of 30+ nights to attract the 27% of the market seeking extended stays.
- Adjust minimum nights based on seasonality – potentially shorter during low season and longer during peak demand periods in San Michele al Tagliamento.
San Michele al Tagliamento Airbnb Cancellation Policy Trends Analysis (2026)
Super Strict 60 Days
5 listings
1.1% of total
Super Strict 30 Days
4 listings
0.9% of total
Limited
12 listings
2.6% of total
Flexible
12 listings
2.6% of total
Moderate
67 listings
14.3% of total
Firm
367 listings
78.3% of total
Strict
2 listings
0.4% of total
Cancellation Policy Insights for San Michele al Tagliamento
- The prevailing Airbnb cancellation policy trend in San Michele al Tagliamento is Firm, used by 78.3% of listings.
- A majority (78.7%) of hosts in San Michele al Tagliamento utilize Firm or Strict policies, indicating a market where hosts prioritize booking security.
- Strict cancellation policies are quite rare (0.4%), potentially making listings with this policy less competitive unless justified by high demand or property type.
Recommendations for Hosts
- Consider adopting a Firm policy to align with the 78.3% market standard in San Michele al Tagliamento.
- Using a Strict policy might deter some guests, as only 0.4% of listings use it. Evaluate if potential revenue protection outweighs possible lower booking rates.
- Regularly review your cancellation policy against competitors and market demand shifts in San Michele al Tagliamento.
How Much Are Airbnb Cleaning Fees in San Michele al Tagliamento?
Cleaning fees in San Michele al Tagliamento are meaningful operating levers, not just pass-through charges. What matters most is how often hosts charge them, how high they run relative to market norms, and how large a share of gross revenue they consume.
Cleaning Fee Insights for San Michele al Tagliamento
- About 60.6% of San Michele al Tagliamento listings charge a cleaning fee — a mixed market where some hosts absorb the cost into nightly rates while others break it out.
- The gap between the average ($194) and median ($76) cleaning fee indicates some high-end properties are pulling the average up considerably.
- Cleaning fees represent 5.6% of gross revenue on average — a modest component of the overall booking price.
Recommendations for Hosts
- Price your cleaning fee competitively against the San Michele al Tagliamento median of $76. Fees significantly above market norms can deter bookings, especially for shorter stays.
- Monitor competitor cleaning fees regularly. Airbnb's search algorithm factors in total price, so a well-calibrated cleaning fee can improve your listing's ranking.
What Do the Top Airbnb Listings in San Michele al Tagliamento Look Like?
Benchmark your potential! Explore examples of top-performing Airbnb properties in San Michele al Tagliamentobased on Trailing Twelve Month (TTM) revenue. Analyze their characteristics, revenue, occupancy rate, and ADR to understand what drives success in this market.
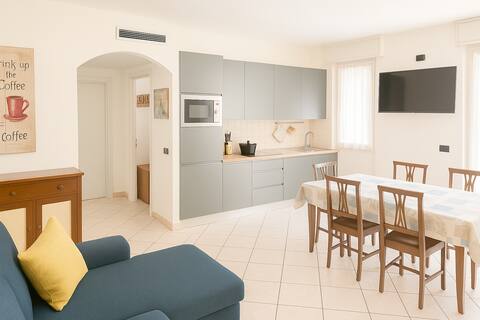
Large apartment in the heart of the center
Entire Place • 2 bedrooms
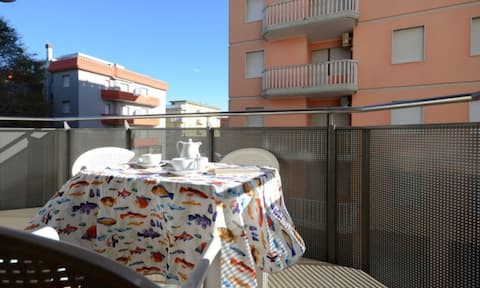
Coastal comfort - Beahost
Entire Place • 2 bedrooms
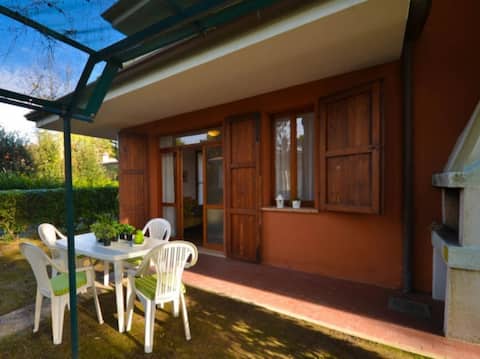
Gorgeous house with garden
Entire Place • 2 bedrooms
Casa Merano Residence & Restaurant Bibione Center
Entire Place • 1 bedroom

Single House with private Garten
Entire Place • 3 bedrooms
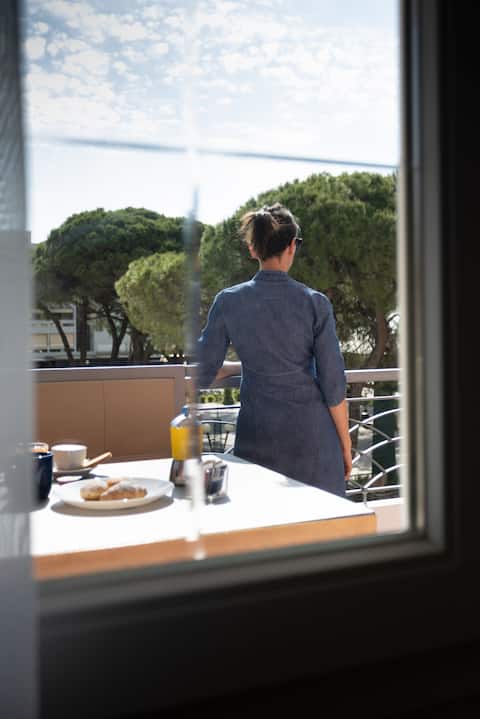
Cozy apartment with private garden near the beach
Entire Place • 1 bedroom
Note: Performance varies based on location, size, amenities, seasonality, and management quality. Data reflects the past 12 months.
Who Are the Top Airbnb Hosts in San Michele al Tagliamento?
Learn from the best! This table showcases top-performing Airbnb hosts in San Michele al Tagliamento based on the number of properties managed and estimated total revenue over the past year. Analyze their scale and performance metrics.
| Host Name | Properties | Grossing Revenue | Stay Reviews | Avg Rating |
|---|---|---|---|---|
| Beahost Rentals | 150 | $1,395,204 | 263 | 4.14/5.0 |
| Paola | 72 | $370,792 | 116 | 4.64/5.0 |
| Alessandra - Interhome | 44 | $221,839 | 233 | 3.92/5.0 |
| Marco | 1 | $100,212 | 13 | 4.85/5.0 |
| Enrico | 5 | $97,572 | 65 | 4.64/5.0 |
| Beahost Rentals | 23 | $89,533 | 58 | 4.05/5.0 |
| Aurora | 3 | $61,724 | 85 | 4.68/5.0 |
| Orsi | 3 | $59,987 | 12 | 4.75/5.0 |
| Giove Daiana | 7 | $56,136 | 108 | 4.57/5.0 |
| OASImare | 4 | $46,052 | 172 | 4.88/5.0 |
Analyzing the strategies of top hosts, such as their property selection, pricing, and guest communication, can offer valuable lessons for optimizing your own Airbnb operations in San Michele al Tagliamento.
Who Are the Airbnb Hosts in San Michele al Tagliamento?
San Michele al Tagliamento leans more toward professional operations than casual hosting, which usually raises the competitive bar for new entrants.
Host Profile Insights for San Michele al Tagliamento
- Only 13.6% of hosts hold Superhost status, suggesting a relatively young or casual market where quality improvements can pay outsized dividends.
- 48.7% of listings are professionally managed, indicating a mature, competitive market with institutional players.
- 37.9% of listings have Instant Book enabled. Lower Instant Book adoption means many guests must request approval, which can slow conversions.
- 77.7% of listings use Airbnb's simplified pricing (host-only fee), where the host pays the entire platform service fee and the guest sees one all-in price with no separate Airbnb service charge. High adoption signals a professional, PMS-connected host base — Airbnb mandates simplified pricing for software-connected listings.
Recommendations for Hosts
- Earning Superhost status can significantly improve search ranking and guest trust. Focus on maintaining high response rates, low cancellations, and strong reviews.
- Consider enabling Instant Book — it reduces booking friction and Airbnb's algorithm tends to favor Instant Book listings in search results.
- Benchmark your host metrics against these San Michele al Tagliamento averages regularly and adjust your hosting strategy based on what top performers do differently.
Top Professional Management Companies in San Michele al Tagliamento
These are the highest-grossing professional property management operations in San Michele al Tagliamento, ranked by total revenue across their portfolio. Their performance metrics offer a benchmark for what institutional-level hosting looks like in this market.
| Company | Listings | Revenue | ADR | Occ. | Rating |
|---|---|---|---|---|---|
| Beahost Rentals | 150 | $1,395,204 | $810 | 32.4% | 4.14/5 |
| Alessandra - Interhome | 44 | $221,839 | $98 | 28.2% | 3.92/5 |
| Beahost Rentals | 23 | $89,533 | $185 | 25.6% | 4.05/5 |
| Giove Daiana | 7 | $56,136 | $271 | 24.2% | 4.57/5 |
| Lena - Interhome | 16 | $43,163 | $112 | 25.1% | 4.25/5 |
| Holidu | 3 | $39,750 | $1,009 | 24.7% | N/A |
| Agustin - Interhome | 12 | $38,901 | $143 | 25.0% | 4.47/5 |
| Novasol | 1 | $12,742 | $140 | 23.4% | N/A |
| Novasol | 3 | $12,703 | $143 | 44.1% | 2.83/5 |
| Alessandra - Interhome | 2 | $6,147 | $75 | 18.9% | 3.84/5 |
Management Company Insights for San Michele al Tagliamento
- The leading management company, Beahost Rentals, operates 150 listings with $1,395,204 in gross revenue — a useful benchmark for what scale looks like in San Michele al Tagliamento.
- Top managers average 26 properties each, pointing to a market where portfolio scale is a meaningful competitive factor.
- Professionally managed listings in the top tier average 4.01/5 in guest ratings — suggesting room for quality improvement even among larger operators.
Recommendations
- Study how top management companies price, position, and maintain their portfolios — their ADR and occupancy rates reflect strategies refined across dozens of listings.
- If you're considering hiring a property manager, compare their portfolio performance against these benchmarks before committing.
How Does San Michele al Tagliamento's Airbnb Market Compare to Nearby Cities?
How does the San Michele al Tagliamento Airbnb market stack up against its neighbors? Compare key performance metrics like average monthly revenue, ADR, and occupancy rates in surrounding areas to understand the broader regional STR landscape.
Compared with Venice, San Michele al Tagliamento has 13 percentage points lower occupancy and about $135 higher ADR. That helps frame whether this market is winning more on demand, pricing, or both.
| Market | Active Properties | Monthly Revenue | Daily Rate | Avg. Occupancy |
|---|---|---|---|---|
| Cortina d'Ampezzo | 375 | $3,969 | $601.68 | 37% |
| Colle Santa Lucia | 20 | $3,055 | $291.60 | 43% |
| Venice | 7,405 | $2,842 | $250.18 | 45% |
| Großkirchheim | 12 | $2,827 | $287.58 | 39% |
| Selina | 16 | $2,752 | $376.74 | 42% |
| Olang - Valdaora | 58 | $2,724 | $575.37 | 29% |
| San Vito di Cadore | 110 | $2,629 | $394.58 | 38% |
| Bad Sankt Leonhard im Lavanttal | 38 | $2,570 | $327.20 | 33% |
| Bertinoro | 15 | $2,550 | $407.64 | 24% |
| Welsberg-Taisten - Monguelfo-Tesido | 27 | $2,538 | $319.88 | 43% |
Frequently Asked Questions About Airbnb in San Michele al Tagliamento
These quick answers summarize the most common investor and operator questions using AirROI's latest market data for San Michele al Tagliamento.
How much do Airbnb hosts make in San Michele al Tagliamento?
San Michele al Tagliamento hosts earn about $7,884 per year on average, with an average nightly rate of $386 and RevPAR of $69. Those figures describe the typical revenue environment for active listings in San Michele al Tagliamento, Veneto, not the ceiling for the best operators. Source: AirROI 2026 data, San Michele al Tagliamento market, July 2025 to June 2026.
What is the average Airbnb occupancy rate in San Michele al Tagliamento?
The average Airbnb occupancy rate in San Michele al Tagliamento is 31.8%. July is the strongest month and February is the softest, so hosts should expect demand to move meaningfully throughout the year rather than stay flat.
What is the average Airbnb daily rate in San Michele al Tagliamento?
Listings in San Michele al Tagliamento average $386 per night. The broader pricing spread also matters: lower-performing listings cluster closer to the lower quartiles, while premium homes can price materially above the city average when demand spikes or listing quality stands out.
How many Airbnb listings are active in San Michele al Tagliamento?
San Michele al Tagliamento currently has about 470 active Airbnb listings in AirROI's market dataset. That supply count helps explain how competitive the market is, how much depth there is for benchmarking, and whether the market behaves like a niche destination or a scaled urban market.
How strict are short-term rental regulations in San Michele al Tagliamento?
AirROI currently classifies the short-term rental regulation level in San Michele al Tagliamento as High. The dataset also shows about 98.7% of listings with registration evidence. That is a market signal, not legal advice, so hosts should still confirm current licensing and compliance rules locally before listing.
What is the RevPAR for Airbnb in San Michele al Tagliamento?
RevPAR in San Michele al Tagliamento is about $69. That metric combines pricing and occupancy into one efficiency number, so it is often a better quick benchmark than ADR alone when investors want to compare how well listings convert nightly rates into realized revenue.
Is Airbnb profitable in San Michele al Tagliamento?
Occupancy of 31.8% means San Michele al Tagliamento is a more selective market. Profitability is achievable but requires careful cost management, premium positioning, or targeting longer stays to reduce turnover. Average annual revenue is $7,884, but individual returns depend on property type, location within the city, and the host's operating efficiency.
How far in advance do guests book Airbnb in San Michele al Tagliamento?
The average booking lead time in San Michele al Tagliamento is about 79 days — a longer planning horizon typical of destination or vacation markets where travelers book well in advance. Hosts who understand their market's booking cadence can adjust minimum stays and pricing windows accordingly.
What are the best neighborhoods for Airbnb in San Michele al Tagliamento?
Based on AirROI's analysis, some of the top neighborhoods for short-term rentals in San Michele al Tagliamento include Bibione, Lignano Sabbiadoro, Portogruaro. Each area attracts different guest profiles — from business travelers to leisure visitors — so the best location depends on the property type and target audience a host is aiming for. See the full neighborhood breakdown above.
What type of property performs best on Airbnb in San Michele al Tagliamento?
entire_home listings make up 99.4% of the active supply in San Michele al Tagliamento. The most common configuration does not always mean the most profitable — operators who identify underserved property types or bedroom counts can sometimes outperform the market average by filling a gap in local supply.
How does San Michele al Tagliamento compare to nearby Airbnb markets?
Among neighboring markets, Cortina d'Ampezzo posts $47,625 in average annual revenue with 37.2% occupancy, compared to San Michele al Tagliamento's $7,884 and 31.8%. Comparing nearby markets helps investors understand whether a destination's performance reflects local demand or broader regional trends.
What is the average length of stay in San Michele al Tagliamento?
The average Airbnb stay length in San Michele al Tagliamento is about 7.7 nights. That matters for turnover, cleaning operations, and pricing strategy because shorter stays increase changeovers while longer stays can smooth occupancy and reduce operational friction.
What is the average Airbnb guest rating in San Michele al Tagliamento?
Airbnb listings in San Michele al Tagliamento average 4.46 out of 5 overall. About 5.1% of listings carry the guest favorite badge, which suggests a meaningful share of inventory is competing on review quality rather than price alone.
Which amenities boost Airbnb revenue in San Michele al Tagliamento?
Conditioner and Paid parking off premises are among the strongest revenue-linked amenities in San Michele al Tagliamento. In AirROI's latest dataset, listings with these amenities outperform those without on average revenue, which makes amenities analysis useful for prioritizing investment and listing upgrades.
Do Airbnb hosts charge cleaning fees in San Michele al Tagliamento?
Yes. About 60.6% of active Airbnb listings in San Michele al Tagliamento charge a cleaning fee, and the average fee is $194. The more important operating benchmark is how much of gross revenue that fee consumes, not just the absolute dollar amount.
What percentage of Airbnb hosts are Superhosts in San Michele al Tagliamento?
Only 13.6% of hosts hold Superhost status, suggesting the market has a large share of newer or less active operators — an opportunity for committed hosts to stand out.
About AirROI Market Data
AirROI tracks over 20 million properties across 190+ countries and maintains 15+ years of historical performance data, making it one of the deepest Airbnb and STR intelligence platforms available. The analytics pipeline aggregates listing-level data monthly — revenue, occupancy, nightly rates, RevPAR, guest demographics, booking patterns, and competitive supply — so investors and operators can benchmark any market against its own history and against neighboring destinations.
Real estate investors, property managers, financial institutions, hedge funds, tourism boards, hospitality consultants, tech platforms, and academic researchers rely on AirROI data to underwrite acquisitions, optimize pricing, model macro trends, and conduct peer-reviewed research. Data is available through in-depth market reports like this one and the Airbnb API with 22 endpoints and an Airbnb MCP Server for AI agents.
AirROI proprietary analytics as of 2026-06-30. Metrics reflect trailing twelve-month aggregates from active listings. Revenue figures are market averages, not projections. Neighborhood descriptions are AI-generated and reviewed for accuracy. For full methodology, see the data methodology page.