AirROI ranking · 20263 markets ranked
Best Places to Buy an Airbnb in Tolmin, Slovenia (2026)
Bovec is the best place to buy an Airbnb in Tolmin in 2026, according to AirROI's ranking of 3 markets. Its listings averaged €17,200 in revenue over the 12 months to October 2026 and were booked on 45% of nights. It also earns the most per listing of any ranked market. Tolmin and Kobarid come next.
- Markets tracked
- 3
- Active Airbnb listings
- 709
- Avg. revenue per listing
- €15,600
- Occupancy rate
- 45%
- Avg. nightly rate
- €150
- Avg. revenue, top 3 markets
- €15,100
The short answer
Tolmin Airbnb Market at a Glance
Across Tolmin, the 709 active Airbnb listings tracked by AirROI, a short-term-rental data firm, averaged €15,600 over the same period. They were booked on 45% of nights at about €150 a night; the ranking covers the 3 markets with at least 30 active listings.
The ranking weighs revenue per listing most, then occupancy and market size, then how evenly income spreads across the year and how it changed on the year. It reflects rental performance, not purchase prices or local short-term rental rules. How the ranking works.
Where the top 3 Airbnb markets in Tolmin are
Each dot is one of the 3 markets AirROI tracks in Tolmin, sized by active listings. Select a number to jump to its profile.
Money figures on this page are in euros, converted from US dollars at €0.86 per US$, the typical rate from November 2025 to October 2026.
Top 3
The Top 3 Airbnb Markets in Tolmin
Each profile draws on the market's full AirROI report: how it earns, when in the year, who books and what sells. Monthly figures are averages per listing active in that month, so twelve of them add up to more than the annual average, which also counts listings that operated for only part of the year.


1. Bovec
Known for: High earnings · Large market
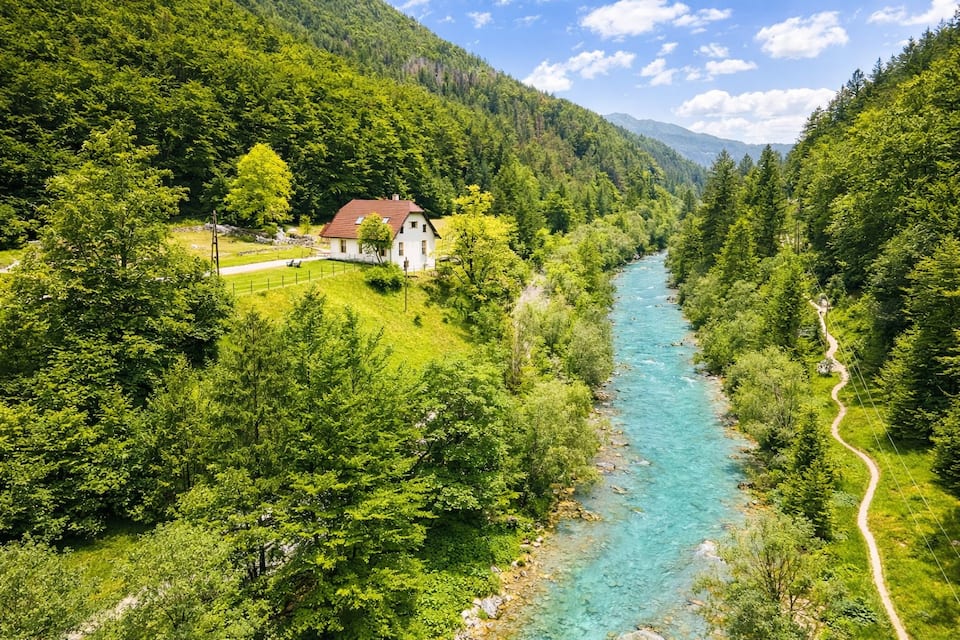


Top-earning Airbnb listings in Bovec - Avg. revenue
- €17,200 +19% vs. last year
- Occupancy
- 45%
- Nightly rate
- €160
- Active listings
- 324
Where it places among the 3 ranked markets in Tolmin
- Revenue 1st of 3
- Occupancy 1st of 3
- Market size 1st of 3
- Year-round 3rd of 3
- Growth 1st of 3
- How it earns
- Bovec is Tolmin's largest Airbnb market, with 324 active listings to price against. Listings averaged €17,200 in revenue over the year, the highest of the 3 ranked markets. A typical listing takes in about €1,700 a month; the top quarter clear €2,560 or more. Revenue per listing rose 19% over the year, the biggest gain in Tolmin, helped by nightly rates 7% higher.
- When it earns
- Bovec's season runs from June to September, peaking in August at about €4,340 per listing; January, the quietest month, brings in about €720.
- Who books
- Nearly all guests come from abroad, led by visitors from Germany, the United States and the United Kingdom.
- What sells
- The most common entire home has 1 bedroom (43% of entire homes), and apartments and condos make up 67% of supply.
- Who it suits
- It suits buyers who can carry costs through a quiet January.
Revenue per listing by month
€4,340 €720- Median listing
- €1,700/mo
- Top 25% of listings
- €2,560+/mo
- Booked ahead
- 78 days
- Average stay
- 4 nights
- Guests from abroad
- 99%
- Most common home size
- 1 bedroom
Areas in the full report: Soča Valley · Bovec Town Center · Krn Lake
Full Bovec Airbnb report2. Tolmin
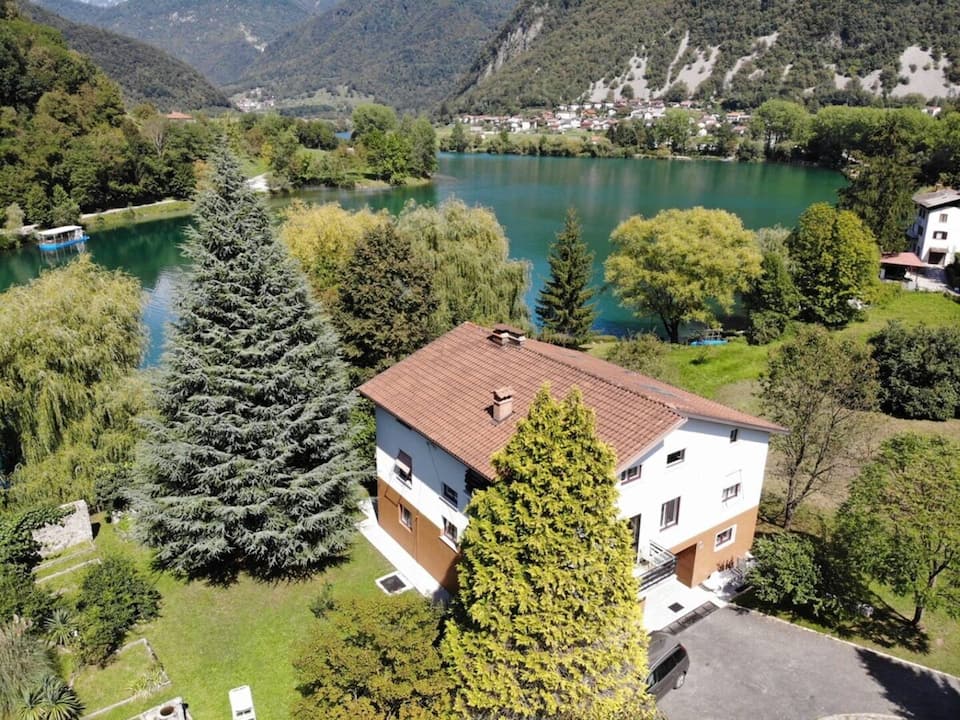


Top-earning Airbnb listings in Tolmin - Avg. revenue
- €15,300 +19% vs. last year
- Occupancy
- 45%
- Nightly rate
- €145
- Active listings
- 241
Where it places among the 3 ranked markets in Tolmin
- Revenue 2nd of 3
- Occupancy 2nd of 3
- Market size 2nd of 3
- Year-round 1st of 3
- Growth 2nd of 3
- How it earns
- Tolmin is Tolmin's second-largest Airbnb market, with 241 active listings to price against. Average revenue per listing came to €15,300, the second-highest of the 3 ranked markets. Its place at #2 rests on year-round demand (1st of 3) rather than on revenue per listing. In a typical month the median listing brings in about €1,390, and the best quarter clear €2,450. Revenue per listing rose 19% over the year, the second-biggest gain in Tolmin, helped by nightly rates 13% higher.
- When it earns
- Revenue in Tolmin concentrates from June to September: August earns about €3,670 per listing, about 4.3 times as much as January.
- Who books
- Nearly all guests come from abroad, led by visitors from Germany, France and the United Kingdom.
- What sells
- Two-bedroom homes lead the market (36% of entire homes), and apartments and condos make up 50% of supply.
- Who it suits
- Best for buyers who can ride out a slow January.
Revenue per listing by month
€3,670 €845- Median listing
- €1,390/mo
- Top 25% of listings
- €2,450+/mo
- Booked ahead
- 81 days
- Average stay
- 5 nights
- Guests from abroad
- 99%
- Most common home size
- 2 bedrooms
3. Kobarid
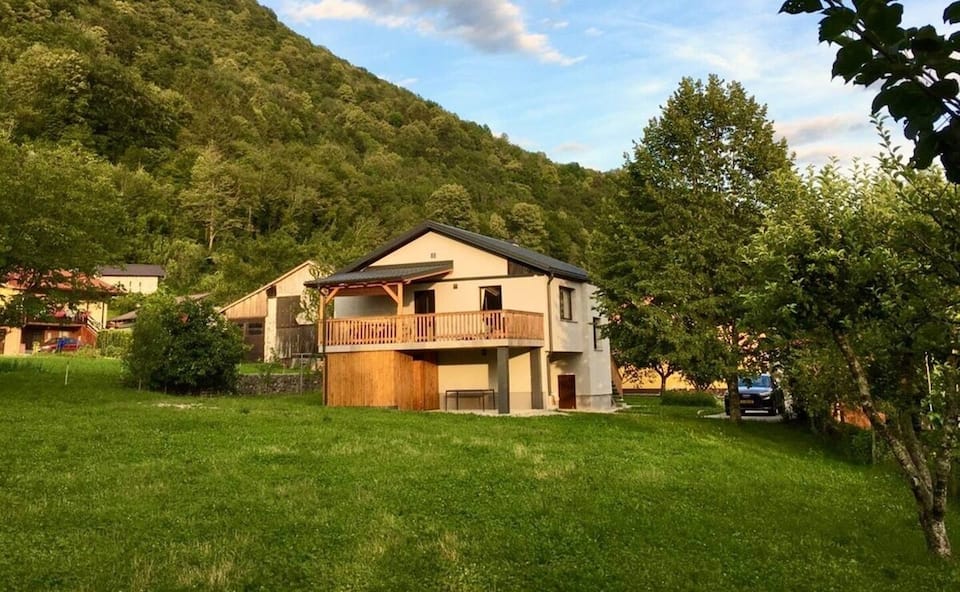

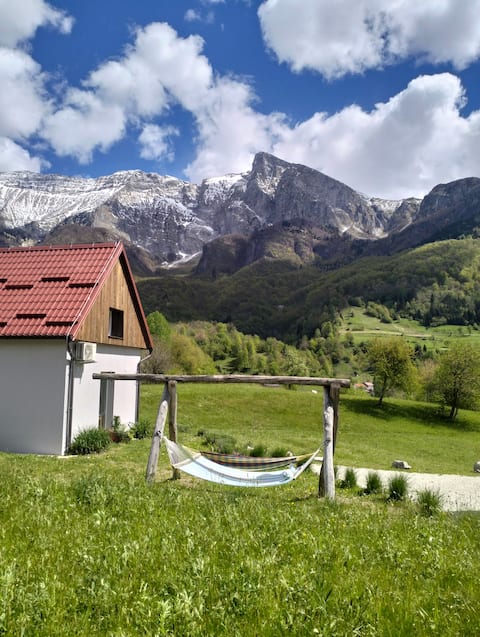
Top-earning Airbnb listings in Kobarid - Avg. revenue
- €12,800 +15% vs. last year
- Occupancy
- 44%
- Nightly rate
- €130
- Active listings
- 144
Where it places among the 3 ranked markets in Tolmin
- Revenue 3rd of 3
- Occupancy 3rd of 3
- Market size 3rd of 3
- Year-round 2nd of 3
- Growth 3rd of 3
- How it earns
- Kobarid is Tolmin's third-largest Airbnb market, with 144 active listings to price against. Listings averaged €12,800 in revenue over the year, the third-highest of the 3 ranked markets. Month to month, the median listing earns about €1,360 and a top-quarter listing €2,060 or more. Revenue per listing rose 15% over the year, the third-biggest gain in Tolmin, helped by nightly rates 12% higher.
- When it earns
- In Kobarid, the months from June to September earn above the yearly average, led by August at about €3,460 per listing; November is the low point at about €728.
- Who books
- Nearly all guests come from abroad, led by visitors from Germany, France and the United States.
- What sells
- The most common entire home has 2 bedrooms (39% of entire homes), and apartments and condos make up 60% of supply.
- Who it suits
- A good fit for buyers who are prepared for thin bookings around November.
Revenue per listing by month
€3,460 €728- Median listing
- €1,360/mo
- Top 25% of listings
- €2,060+/mo
- Booked ahead
- 70 days
- Average stay
- 4 nights
- Guests from abroad
- 99%
- Most common home size
- 2 bedrooms
Full ranking
How All 3 Ranked Markets in Tolmin Compare
The overall ranking with the five measures behind it. "Slow month" is a market's weakest month of revenue as a share of its best, so a higher figure means steadier income. Select a column heading to re-sort.
By measure
Tolmin Airbnb Markets Ranked by Revenue, Nightly Rate and Occupancy
The overall ranking balances five measures. These lists take one at a time, for buyers who care most about income, pricing power, bookings, a steady calendar, momentum or market size.
Highest-earning Airbnb markets in Tolmin
Average annual revenue per active listing over the past 12 months. Markets with at least 60 listings.
Most expensive Airbnb markets in Tolmin by nightly rate
Average rate per booked night. A high rate earns most where occupancy holds up too. Markets with at least 60 listings.
Highest-occupancy Airbnb markets in Tolmin
Share of available nights booked over the past 12 months. Markets with at least 60 listings.
Most year-round Airbnb markets in Tolmin
Revenue in the slowest month as a share of the best month, so a higher figure means steadier income. Markets with at least 60 listings.
Fastest-growing Airbnb markets in Tolmin
Change in revenue per listing from the year before, among markets where it rose. Markets with at least 60 listings.
Largest Airbnb markets in Tolmin
Active listings. Bigger markets have more comparable rentals to price against and more buyers at resale.
Method
How the Ranking Works
The ranking covers the 3 markets in Tolmin with at least 30 active Airbnb listings and data through October 2026. Each market is compared with the others on five measures, and markets are ordered by a weighted blend of where they place on each:
- Revenue per listing (35%): average revenue an active listing earned over the past 12 months.
- Occupancy (20%): share of available nights that were booked.
- Market size (20%): active listings. Bigger markets offer more comparable rentals to price against and more buyers when you sell.
- Year-round demand (15%): revenue in the slowest month as a share of the best month. The latest month is left out when its bookings look incomplete.
- Growth (10%): change in revenue per listing from the year before. Markets whose boundaries changed between years are scored in the middle.
The score measures how rentals perform. It does not include purchase prices, financing, operating costs or local short-term rental rules, which vary by address and should be checked before buying. Figures are in euros and match each market's own report; see the data methodology for how listings are tracked.
To check one property before buying, run its address and size through the Airbnb calculator for a revenue, occupancy and nightly-rate range from comparable listings.
FAQ
Frequently Asked Questions About Airbnb Investing in Tolmin
What is the best place to buy an Airbnb in Tolmin?
Bovec ranks first of the 3 markets in Tolmin in AirROI's ranking, with €17,200 in average revenue per listing and 45% occupancy. Tolmin and Kobarid follow. The ranking weighs revenue, occupancy, market size, seasonality and growth; it leaves out purchase prices.
What are the most profitable Airbnb locations in Tolmin?
By revenue per listing, among markets with at least 60 listings, Bovec leads at €17,200 a year, ahead of Tolmin at €15,300. Profit also depends on what a property costs to buy and run, which varies far more between markets than revenue does.
How much does an Airbnb make in Tolmin?
The average active listing in Tolmin earned €15,600 over the 12 months to October 2026, at 45% occupancy. Averages include listings that operated for only part of the year, so a listing rented all year typically earns more.
Where is Airbnb demand highest in Tolmin?
Among ranked markets with at least 60 listings, Bovec has the highest occupancy, with 45% of available nights booked, followed by Tolmin at 45%. Its listings average about €160 a night and €17,200 a year.
Where are Airbnb nightly rates highest in Tolmin?
Among ranked markets with at least 60 listings, Bovec has the highest average nightly rate, about €160, followed by Tolmin at €145. Kobarid is the least expensive, at about €130. The average booked night in Tolmin costs about €150.
Which Airbnb markets in Tolmin earn the most evenly through the year?
Among ranked markets with at least 60 listings, Tolmin has the steadiest income: its slowest month, January, still earns about a quarter of its best. Kobarid follows, at 21%. Steadier markets are easier to budget for, though they do not always earn the most per listing.
Which Airbnb markets are growing fastest in Tolmin?
Among ranked markets with at least 60 listings, revenue per listing grew most in Bovec, up 19% on the year before, and in Tolmin, up 19%. A single strong year can reflect events or new supply, so it is worth checking a market's monthly trend before relying on it.
How many Airbnb listings are there in Tolmin?
AirROI tracked 709 active Airbnb listings in Tolmin over the 12 months to October 2026, across 3 markets. The largest ranked market is Bovec, with 324 listings, followed by Tolmin with 241.
Directory
All 3 Airbnb Markets in Tolmin
Every Tolmin city with an AirROI Airbnb market report, A–Z, with its active listing count.