Boal, Asturias Airbnb Market Data 2026: STR Report & Statistics
How much can you earn on Airbnb in Boal, Asturias? Based on AirROI's 2026 dataset (May 2025 – April 2026), the short answer is $3,396 per year — at a $101 nightly rate, 33.4% occupancy, and a $27 RevPAR that reflects a wider gap between nightly rates and realized revenue that rewards occupancy-focused strategies.
With just 19 active listings, Boal is a micro-market where selective demand that rewards strong listing quality and pricing strategy. Supply grew 46.2% year over year, and the market is recalibrating around a new competitive baseline. This is the stage where hosts who invest in amenities, guest experience, and dynamic pricing build durable advantages that compound as the market matures.
Regulation is high, and hosts should factor licensing costs and compliance timelines into their launch plan. In a market this size, differentiated listings with strong reviews can capture outsized returns relative to the competition.
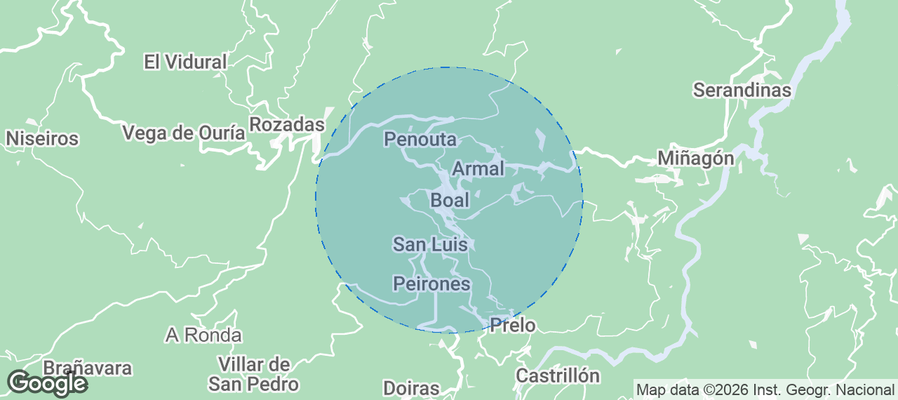
Table of Contents [hide] [show]
What Are the Key Airbnb Metrics in Boal?
In Boal, the headline Airbnb metrics are $3,396 in average annual revenue,33.4% occupancy, $101 ADR, and $27 in RevPAR, and guests book about 55 days in advance.
How Much Do Airbnb Hosts Earn Monthly in Boal?
Understanding the monthly revenue variations for Airbnb listings in Boal is key to maximizing your short term rental income potential. Seasonality significantly impacts earnings. Our analysis, based on data from the past 12 months, shows that the peak revenue month for STRs in Boal is typically August, while May often presents the lowest earnings, highlighting opportunities for strategic pricing adjustments during shoulder and low seasons. Explore the typical Airbnb income in Boal across different performance tiers:
- Best-in-class properties (Top 10%) achieve $1,303+ monthly, often utilizing dynamic pricing and superior guest experiences.
- Strong performing properties (Top 25%) earn $839 or more, indicating effective management and desirable locations/amenities.
- Typical properties (Median) generate around $420 per month, representing the average market performance.
- Entry-level properties (Bottom 25%) see earnings around $278, often with potential for optimization.
Average Monthly Airbnb Earnings Trend in Boal
What Is the Monthly Airbnb Occupancy Rate in Boal?
Maximize your bookings by understanding the Boal STR occupancy trends. Seasonal demand shifts significantly influence how often properties are booked. Typically, Augustsees the highest demand (peak season occupancy), while November experiences the lowest (low season). Effective strategies, like adjusting minimum stays or offering promotions, can boost occupancy during slower periods. Here's how different property tiers perform in Boal:
- Best-in-class properties (Top 10%) achieve 52%+ occupancy, indicating high desirability and potentially optimized availability.
- Strong performing properties (Top 25%) maintain 33% or higher occupancy, suggesting good market fit and guest satisfaction.
- Typical properties (Median) have an occupancy rate around 21%.
- Entry-level properties (Bottom 25%) average 9% occupancy, potentially facing higher vacancy.
Average Monthly Occupancy Rate Trend in Boal
What Is the Average Airbnb Nightly Rate in Boal?
Effective short term rental pricing strategy in Boal involves understanding monthly ADR fluctuations. The Average Daily Rate (ADR) for Airbnb in Boal typically peaks in July and dips lowest during December. Leveraging Airbnb dynamic pricing tools or strategies based on this seasonality can significantly boost revenue. Here's a look at the typical nightly rates achieved:
- Best-in-class properties (Top 10%) command rates of $192+ per night, often due to premium features or locations.
- Strong performing properties (Top 25%) achieve nightly rates of $155 or more.
- Typical properties (Median) charge around $112 per night.
- Entry-level properties (Bottom 25%) earn around $26 per night.
Average Daily Rate (ADR) Trend by Month in Boal
What Is the RevPAR for Airbnb in Boal?
RevPAR in Boal is currently $27. Because RevPAR combines nightly rates with realized occupancy, it is one of the cleanest ways to compare how efficiently listings turn demand into revenue across the market.
- Entry-level properties (Bottom 25%) see $10 RevPAR.
- Typical properties (Median) generate $19 RevPAR.
- Strong performers (Top 25%) earn $47 RevPAR.
- Best-in-class (Top 10%) achieve $63 RevPAR.
Average Monthly RevPAR Trend in Boal
RevPAR Insights for Boal
- The average RevPAR in Boal is $27. This metric combines nightly rates with realized occupancy, making it one of the best single-number indicators of market efficiency.
- The gap between the top 10% ($63) and bottom 25% ($10) is $53, suggesting a relatively compressed market where operational differences yield moderate returns.
- RevPAR peaks in Aug and bottoms out in Feb, mirroring the broader seasonal demand pattern and suggesting opportunities for dynamic pricing.
Recommendations for Hosts
- Track your own RevPAR monthly against these Boal benchmarks. If your RevPAR falls below the median of $19, examine whether low occupancy or low ADR is the primary drag.
- Top-quartile listings achieve $47+ RevPAR through a combination of competitive pricing, strong reviews, and strategic amenities. Target this tier through incremental improvements.
- Use RevPAR rather than revenue alone when comparing properties of different sizes — it normalizes for available nights and gives a more accurate picture of performance.
Get Live Boal Market Intelligence 👇
Explore Real-time Analytics
When Is the Peak Season for Airbnb in Boal?
Boal's peak Airbnb season falls in August, July, January, while the softest stretch is February, May, November. Overall, the market shows highly seasonal trends requiring careful strategy, which should guide pricing, minimum stays, and cash-flow planning.
Peak Season (August, July, January)
- Revenue averages $1,130 per month
- Occupancy rates average 36.4%
- Daily rates average $120
Shoulder Season
- Revenue averages $479 per month
- Occupancy maintains around 22.3%
- Daily rates hold near $113
Low Season (February, May, November)
- Revenue drops to average $187 per month
- Occupancy decreases to average 7.9%
- Daily rates adjust to average $116
Seasonality Insights for Boal
- Airbnb seasonality in Boal is pronounced. Revenue swings sharply between peak and low months, which means pricing strategy, minimum-stay settings, and cash reserves all need to account for extended slower periods.
- During the high season, the absolute peak month showcases Boal's highest earning potential, with monthly revenues climbing to $1,250, occupancy reaching 44.1%, and ADRs peaking at $128.
- Conversely, the slowest single month marks the market's lowest point — revenue may dip to $0, occupancy could drop to 0.0%, and ADRs may adjust to $102.
- Lower occupancy paired with meaningful seasonality means hosts in Boal need to maximize every peak-season booking and seriously consider whether off-season pricing adjustments or minimum-stay changes can capture incremental revenue.
Seasonal Strategies for Maximizing Profit
- Peak Season: Maximize revenue through premium pricing. In a high-regulation market like Boal, ensure your permit covers the number of nights you plan to book — some jurisdictions cap annual rental days.
- Low Season: Offer competitive pricing, extended-stay discounts, and flexible cancellation policies. Target off-season travelers like remote workers, budget-conscious guests, and travelers with flexible schedules.
- Shoulder Seasons: Implement dynamic pricing that bridges peak and low rates. Target weekend travelers, local events, and business visitors. Slightly more flexible terms than peak season can help maintain occupancy without deep discounting.
- In a highly seasonal market like Boal, building a cash reserve during the top months is essential for covering fixed costs during the slow period. Automated pricing tools can help capture demand shifts in real time.
Do You Need a License for Airbnb in Boal?
Boal, Asturias, Spain has a high regulation classification, yet only 53% of listings show registration evidence. That gap between regulation on the books and compliance on the ground can shift quickly — municipalities often tighten enforcement in waves, putting unregistered operators at risk of fines or delisting. Always verify the latest short-term rental regulations and Airbnb license requirements directly with local government authorities for Boal to ensure full compliance before hosting.
(Source: AirROI data, 2026, based on 53% licensed listings)
What Are the Best Neighborhoods for Airbnb in Boal?
With a compact short-term rental market, Boal gives early-mover hosts an advantage in the right neighborhoods. The areas listed below are where guest demand and local attractions converge — a useful lens for investors evaluating whether to enter this market and where to position their listing.
| Neighborhood / Area | Why Host Here? (Target Guests & Appeal) | Key Attractions & Landmarks |
|---|---|---|
| Cangas de Onís | A charming town known as the gateway to the Picos de Europa National Park, attracting nature lovers and adventure seekers. Ideal for hosting tourists who want to explore the natural beauty of Asturias. | Picos de Europa National Park, Covadonga Lakes, Covadonga Sanctuary, Sella River, Cangas de Onís Bridge |
| Gijón | A major coastal city with beautiful beaches, cultural events, and a thriving nightlife. It attracts a wide variety of travelers, making it a solid choice for Airbnb investments. | San Lorenzo Beach, Gijón Marina, Cerro de Sta Catalina, Museo del Ferrocarril de Asturias, Jardín Botánico Atlántico |
| Oviedo | The historic capital of Asturias, known for its rich culture, architecture, and gastronomy. A great location for tourists looking to immerse themselves in local history and cuisine. | Cathedral of San Salvador, Museum of Fine Arts of Asturias, Parque de San Francisco, Old Town Oviedo, La Regenta |
| Lastres | A picturesque fishing village that offers stunning coastal views and a glimpse of traditional Asturian life. It attracts visitors who want a peaceful retreat by the sea. | Lastres Beach, Cove of the Basilisk, Evaristo San Miguel's Palace, Fishing Port of Lastres, Casa del Doctor Mateo |
| Llanes | A beautiful coastal town known for its beaches and the nearby Picos de Europa. It’s popular among tourists seeking a mix of beach relaxation and outdoor activities. | Sablon Beach, Bufones de Pría, Llanes Old Town, Picos de Europa National Park, Casa de los Miu |
| Ribadesella | Famous for its caves and prehistoric history, as well as beautiful beaches. Attracts history buffs and beachgoers alike. | Cueva de Tito Bustillo, Ribadesella Beach, Canoeing on the Sella River, Santa María Beach, Centro de Arte Rupestre |
| Villaviciosa | A town known for its cider production and beautiful surroundings, appealing to those interested in nature and local traditions. It's a tranquil area perfect for rural tourism. | Villaviciosa Estuary, Cider Houses, Church of Santuario de la Virgen de la Consolación, Playa de Rodiles, Hiking in the Sierra del Sueve |
| Tazones | A quaint fishing village with a rich maritime history and beautifully preserved architecture. It attracts those looking for an authentic and scenic getaway on the Asturian coast. | Tazones Beach, Fishing Port, Casa de los Cuentos, Old Town, Seafront Promenade |
Because Boal has a high regulation profile, confirming that short-term rental permits are available in your target neighborhood is a critical first step before committing to a property purchase. Regulation can vary at the neighborhood or district level even within the same city.
What Types of Properties Are on Airbnb in Boal?
Room Type Distribution
Property Type Distribution
Market Composition Insights for Boal
- The Boal Airbnb market composition is heavily skewed towards Entire Home/Apt listings, which make up 73.7% of the 19 active rentals. This indicates strong guest preference for privacy and space.
- Looking at the property type distribution in Boal, Apartment/Condo properties are the most common (73.7%), reflecting the local real estate landscape.
- Houses represent a significant 26.3% portion, catering likely to families or larger groups.
Boal Airbnb Room Capacity Analysis (2026): Bedroom Distribution
Distribution of Listings by Number of Bedrooms
Room Capacity Insights for Boal
- The dominant room capacity in Boal is 1 bedroom listings, making up 36.8% of the market. This suggests a strong demand for properties suitable for couples or solo travelers.
- Together, 1 bedroom and 2 bedrooms properties represent 52.6% of the active Airbnb listings in Boal, indicating a high concentration in these sizes.
- A significant 36.9% of listings offer 3+ bedrooms, catering to larger groups and families seeking more space in Boal.
Boal Vacation Rental Guest Capacity Trends (2026)
Distribution of Listings by Guest Capacity
Guest Capacity Insights for Boal
- The most common guest capacity trend in Boal vacation rentals is listings accommodating 4 guests (26.3%). This suggests the primary traveler segment is likely small families or groups.
- Properties designed for 4 guests and 2 guests dominate the Boal STR market, accounting for 52.6% of listings.
- 15.8% of properties accommodate 6+ guests, serving the market segment for larger families or group travel in Boal.
- On average, properties in Boal are equipped to host 3.2 guests.
How Do Listings in Boal Compare on Quality?
Listing quality in Boal can be approximated through presentation depth, bedroom count, and how often hosts disclose exact locations. These signals show how professionally the local supply base is merchandised.
Listing Quality Insights for Boal
- At 26.9 photos per listing on average, Boal hosts invest well in visual presentation. Listings with 20+ photos consistently outperform in search ranking and conversion.
- 0.0% of listings show their exact location. Lower disclosure rates can increase booking hesitation — guests want to know exactly where they are staying.
Recommendations for Hosts
- Enable exact location if possible — it removes a common source of guest uncertainty and can improve your listing's position in map-based searches.
- Use these quality indicators as a self-audit checklist. Listings that exceed the Boal averages across all three metrics are better positioned for premium pricing.
What Amenities Do Airbnb Guests Expect in Boal?
Amenity Prevalence
Amenity Insights for Boal
- Essential amenities in Boal that guests expect include: Wifi, Heating. Lacking these (any) could significantly impact bookings.
- Popular amenities like Dishes and silverware, Fire extinguisher, Refrigerator are common but not universal. Offering these can provide a competitive edge.
Recommendations for Hosts
- Ensure your listing includes all essential amenities for Boal: Wifi, Heating.
- Prioritize adding missing essentials: Wifi.
- Consider adding popular differentiators like Dishes and silverware or Fire extinguisher to increase appeal.
- Highlight unique or less common amenities you offer (e.g., hot tub, dedicated workspace, EV charger) in your listing description and photos.
- Regularly check competitor amenities in Boal to stay competitive.
Which Airbnb Amenities Boost Revenue in Boal?
Not every amenity matters equally. This table focuses on the amenities most associated with higher revenue in Boal, which makes it more useful for prioritizing upgrades than a simple popularity list alone.
| Amenity | Prevalence | Revenue With | Revenue Without | Revenue Uplift |
|---|---|---|---|---|
Backyard | 47.4% | $5,065 | $1,894 | 167.5% |
Free parking on premises | 63.2% | $4,236 | $1,956 | 116.6% |
BBQ grill | 73.7% | $3,839 | $2,155 | 78.2% |
Patio or balcony | 68.4% | $3,867 | $2,374 | 62.9% |
Crib | 31.6% | $4,571 | $2,853 | 60.2% |
Outlet covers | 31.6% | $4,571 | $2,853 | 60.2% |
High chair | 26.3% | $4,610 | $2,962 | 55.6% |
Body soap | 36.8% | $3,967 | $3,063 | 29.5% |
Shampoo | 42.1% | $3,907 | $3,024 | 29.2% |
Hair dryer | 73.7% | $3,544 | $2,979 | 19.0% |
Revenue Impact Insights for Boal
- Backyard tops the revenue impact list with a 167.5% uplift — listings with this amenity earn $5,065 vs. $1,894 without it.
Recommendations for Hosts
- Focus your upgrade budget on amenities in the top half of this table. Below-median amenities may improve guest experience but contribute less to revenue growth.
- Highlight revenue-impacting amenities prominently in your listing title, photos, and description — guests can't value what they don't notice.
Dive Deeper: Advanced Boal STR Market Data (2026)
Ready to unlock more insights? AirROI provides access to advanced metrics and comprehensive Airbnb data for Boal. Explore detailed analytics beyond this report to refine your investment strategy, optimize pricing, and maximize your vacation rental profits.
Explore Advanced MetricsBoal Airbnb Guest Demographics & Profile Analysis (2026)
Guest Profile Summary for Boal
- The typical guest profile for Airbnb in Boal consists of a mix of domestic (63%) and international guests, often arriving from nearby Madrid, typically belonging to the 1990s (Older Gen Z) group (50%), primarily speaking English or French.
- Domestic travelers account for 62.5% of guests.
- Key international markets include Spain (62.5%) and United Kingdom (12.5%).
- Top languages spoken are English (40%) followed by French (20%).
- A significant demographic segment is the Post-2000s (Gen Z/Alpha) group, representing 50% of guests.
Recommendations for Hosts
- Target domestic marketing efforts towards travelers from Madrid and England.
- Tailor amenities and listing descriptions to appeal to the dominant 1990s (Older Gen Z) demographic (e.g., highlight fast WiFi, smart home features, local guides).
- Highlight unique local experiences or amenities relevant to the primary guest profile.
- Consider seasonal promotions aligned with peak travel times for key origin markets.
What Are Airbnb Guest Ratings in Boal?
Listings in Boal average 4.87 out of 5 overall, with about 5 reviews per active listing and 15.8% of listings carrying the Guest Favorite badge.
Rating Breakdown by Category
Guest Rating Insights for Boal
- With an overall rating of 4.87, Boal listings meet an exceptionally high bar. Guests consistently report strong satisfaction, which drives repeat bookings and referral traffic.
- The strongest subcategory is Communication (4.89), while Location (4.74) trails behind — a useful signal for hosts looking to prioritize upgrades.
- 15.8% of listings carry the Guest Favorite badge, a strong trust signal that can meaningfully lift click-through and booking rates.
Recommendations for Hosts
- Focus improvement efforts on Location — even small gains in the weakest subcategory can lift overall ratings and search ranking.
- Encourage guests to leave reviews after checkout. Listings with more reviews rank higher in search results and convert browsers into bookers more effectively.
- With only 15.8% of listings earning Guest Favorite status, hosts who consistently exceed expectations have a clear competitive advantage.
Boal Airbnb Booking Patterns (2026): Available vs. Booked Days
Available Days Distribution
Booked Days Distribution
Booking Pattern Insights for Boal
- The most common availability pattern in Boal falls within the 271-366 days range, representing 89.5% of listings. This suggests many properties have significant open periods on their calendars.
- Approximately 100.0% of listings show high availability (181+ days open annually), indicating potential for increased bookings or specific owner usage patterns.
- For booked days, the 31-90 days range is most frequent in Boal (52.6%), reflecting common guest stay durations or potential owner blocking patterns.
How Far in Advance Do Guests Book Airbnb in Boal?
Average Booking Lead Time by Month
Booking Lead Time Insights for Boal
- The overall average booking lead time for vacation rentals in Boal is 55 days.
- Guests book furthest in advance for stays during December (average 90 days), likely coinciding with peak travel demand or local events.
- The shortest booking windows occur for stays in November (average 0 days), indicating more last-minute travel plans during this time.
- Seasonally, Summer (65 days avg.) sees the longest lead times, while Spring (10 days avg.) has the shortest, reflecting typical travel planning cycles.
Recommendations for Hosts
- Use the overall average lead time (55 days) as a baseline for your pricing and availability strategy in Boal.
- For December stays, consider implementing length-of-stay discounts or slightly higher rates for bookings made less than 90 days out to capitalize on advance planning.
- During November, focus on last-minute booking availability and promotions, as guests book with very short notice (0 days avg.).
- Target marketing efforts for the Summer season well in advance (at least 65 days) to capture early planners.
- Monitor your own booking lead times against these Boal averages to identify opportunities for dynamic pricing adjustments.
What Is the Average Length of Stay for Airbnb in Boal?
Guests in Boal stay about 8.7 nights on average, generating roughly 99 reservations and 5.2 bookings per listing in the latest AirROI dataset. The most common check-in time is 3:00 PM and check-out is 12:00 PM.
Monthly Length of Stay in Boal
Check-in Time Distribution
Check-out Time Distribution
Stay Pattern Insights for Boal
- Longer stays mean fewer turnovers and lower cleaning costs per revenue dollar. This pattern also opens the door to monthly discount strategies that attract remote workers and extended-stay travelers.
- Stay lengths peak in May (12.8 nights) and shorten in Apr (3 nights). Adjust minimum-night requirements seasonally to match.
Recommendations for Hosts
- Leverage the longer-stay pattern by offering weekly discounts — even 5-10% off can convert browsing into bookings for guests considering an extended stay.
- Set your check-in time to match or beat the market standard of 3:00 PM. Offering early check-in flexibility can be a low-cost differentiator.
- Monitor length-of-stay seasonality to adjust minimum-night requirements — longer minimums during peak periods maximize revenue while shorter minimums fill gaps in shoulder seasons.
Boal Airbnb Minimum Stay Requirements Analysis
Distribution of Listings by Minimum Night Requirement
1 Night
2 listings
10.5% of total
2 Nights
3 listings
15.8% of total
7-29 Nights
7 listings
36.8% of total
30+ Nights
7 listings
36.8% of total
Key Insights
- The most prevalent minimum stay requirement in Boal is 7-29 Nights, adopted by 36.8% of listings. This highlights the market's preference for shorter, flexible bookings.
- A significant segment (36.8%) caters to monthly stays (30+ nights) in Boal, pointing to opportunities in the extended-stay market.
Recommendations
- Align with the market by considering a 7-29 Nights minimum stay, as 36.8% of Boal hosts use this setting.
- If feasible, allowing 1-night stays, especially midweek or during low season, could capture last-minute bookings, as only 10.5% currently do.
- Explore offering discounts for stays of 30+ nights to attract the 36.8% of the market seeking extended stays.
- Adjust minimum nights based on seasonality – potentially shorter during low season and longer during peak demand periods in Boal.
Boal Airbnb Cancellation Policy Trends Analysis (2026)
Flexible
1 listings
5.3% of total
Moderate
4 listings
21.1% of total
Firm
10 listings
52.6% of total
Strict
4 listings
21.1% of total
Cancellation Policy Insights for Boal
- The prevailing Airbnb cancellation policy trend in Boal is Firm, used by 52.6% of listings.
- A majority (73.7%) of hosts in Boal utilize Firm or Strict policies, indicating a market where hosts prioritize booking security.
Recommendations for Hosts
- Consider adopting a Firm policy to align with the 52.6% market standard in Boal.
- Regularly review your cancellation policy against competitors and market demand shifts in Boal.
How Much Are Airbnb Cleaning Fees in Boal?
Cleaning fees in Boal are meaningful operating levers, not just pass-through charges. What matters most is how often hosts charge them, how high they run relative to market norms, and how large a share of gross revenue they consume.
Cleaning Fee Insights for Boal
- Only 21.1% of listings charge a cleaning fee, suggesting that most hosts in Boal bundle cleaning costs into the nightly rate.
- The gap between the average ($76) and median ($17) cleaning fee indicates some high-end properties are pulling the average up considerably.
- Cleaning fees represent 1.6% of gross revenue on average — a modest component of the overall booking price.
Recommendations for Hosts
- Price your cleaning fee competitively against the Boal median of $17. Fees significantly above market norms can deter bookings, especially for shorter stays.
- Monitor competitor cleaning fees regularly. Airbnb's search algorithm factors in total price, so a well-calibrated cleaning fee can improve your listing's ranking.
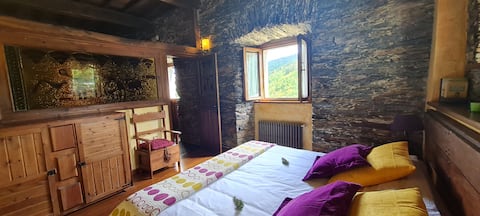
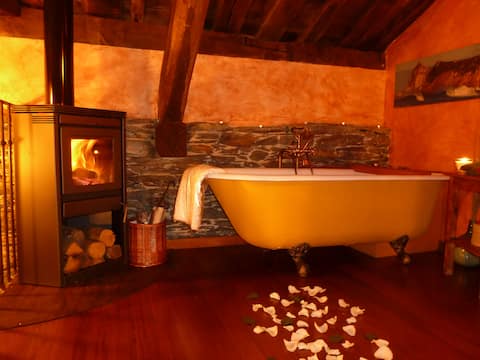
What Do the Top Airbnb Listings in Boal Look Like?
Benchmark your potential! Explore examples of top-performing Airbnb properties in Boalbased on Trailing Twelve Month (TTM) revenue. Analyze their characteristics, revenue, occupancy rate, and ADR to understand what drives success in this market.

Casona El Espín
Entire Place • 4 bedrooms
El Bosque de las Viñas. Apartment with Jacuzzi.
Entire Place • 6 bedrooms
Duplex apartment with fireplace Ferro
Entire Place • 6 bedrooms

La Casa del Abuelo Justo - Apartamento El Horreo
Entire Place • 1 bedroom

A Casua
Entire Place • 3 bedrooms

La Casa del Abuelo Justo - Apartment A Figueira
Entire Place • 1 bedroom
Note: Performance varies based on location, size, amenities, seasonality, and management quality. Data reflects the past 12 months.
Who Are the Top Airbnb Hosts in Boal?
Learn from the best! This table showcases top-performing Airbnb hosts in Boal based on the number of properties managed and estimated total revenue over the past year. Analyze their scale and performance metrics.
| Host Name | Properties | Grossing Revenue | Stay Reviews | Avg Rating |
|---|---|---|---|---|
| Nuria | 3 | $16,477 | 3 | Not Rated |
| Noelia | 7 | $12,566 | 30 | 4.94/5.0 |
| Nerea | 1 | $11,607 | 5 | 5.00/5.0 |
| Rocio | 3 | $10,950 | 20 | 4.83/5.0 |
| Gisela | 1 | $5,259 | 10 | 4.80/5.0 |
| Mar | 1 | $4,019 | 16 | 4.88/5.0 |
| Sandra | 1 | $2,531 | 7 | 4.43/5.0 |
| Daniel | 1 | $619 | 2 | Not Rated |
| Lorena | 1 | $491 | 2 | Not Rated |
Analyzing the strategies of top hosts, such as their property selection, pricing, and guest communication, can offer valuable lessons for optimizing your own Airbnb operations in Boal.
Who Are the Airbnb Hosts in Boal?
Boal is a quality-focused market, with a high Superhost share and fairly mature operating standards.
Host Profile Insights for Boal
- With 52.6% Superhosts, Boal has an experienced host base that sets high guest expectations. New entrants should plan for competitive quality standards.
- 15.8% of listings are professionally managed, reflecting a market still dominated by individual hosts.
- 5.3% of listings have Instant Book enabled. Lower Instant Book adoption means many guests must request approval, which can slow conversions.
- 52.6% of listings use Airbnb's simplified pricing (host-only fee), where the host pays the entire platform service fee and the guest sees one all-in price with no separate Airbnb service charge. High adoption signals a professional, PMS-connected host base — Airbnb mandates simplified pricing for software-connected listings.
Recommendations for Hosts
- Consider enabling Instant Book — it reduces booking friction and Airbnb's algorithm tends to favor Instant Book listings in search results.
- Benchmark your host metrics against these Boal averages regularly and adjust your hosting strategy based on what top performers do differently.
Top Professional Management Companies in Boal
These are the highest-grossing professional property management operations in Boal, ranked by total revenue across their portfolio. Their performance metrics offer a benchmark for what institutional-level hosting looks like in this market.
| Company | Listings | Revenue | ADR | Occ. | Rating |
|---|---|---|---|---|---|
| Rocio | 3 | $10,950 | $115 | 40.1% | 4.83/5 |
Management Company Insights for Boal
- The leading management company, Rocio, operates 3 listings with $10,950 in gross revenue — a useful benchmark for what scale looks like in Boal.
- Top managers average 3 properties each, suggesting professional management in Boal still operates at a relatively boutique scale.
- Professionally managed listings in the top tier average 4.83/5 in guest ratings — demonstrating that scale and quality can coexist.
Recommendations
- With only 15.8% of listings professionally managed, there may be an opportunity to differentiate through more structured operations and consistent guest experiences.
- Study how top management companies price, position, and maintain their portfolios — their ADR and occupancy rates reflect strategies refined across dozens of listings.
- If you're considering hiring a property manager, compare their portfolio performance against these benchmarks before committing.
How Does Boal's Airbnb Market Compare to Nearby Cities?
How does the Boal Airbnb market stack up against its neighbors? Compare key performance metrics like average monthly revenue, ADR, and occupancy rates in surrounding areas to understand the broader regional STR landscape.
Compared with Palas de Rei, Boal has 11 percentage points lower occupancy and about $50 lower ADR. That helps frame whether this market is winning more on demand, pricing, or both.
| Market | Active Properties | Monthly Revenue | Daily Rate | Avg. Occupancy |
|---|---|---|---|---|
| Llanera | 15 | $1,619 | $275.53 | 36% |
| Portomarín | 13 | $1,545 | $175.71 | 42% |
| Villaviciosa | 218 | $1,490 | $206.11 | 36% |
| O Saviñao | 22 | $1,309 | $185.21 | 30% |
| Palas de Rei | 18 | $1,278 | $150.60 | 44% |
| Gijón | 1,218 | $1,259 | $154.78 | 39% |
| Asturias | 32 | $1,236 | $196.40 | 43% |
| Parres | 130 | $1,220 | $183.44 | 33% |
| Cangas de Onís | 330 | $1,219 | $155.95 | 37% |
| Oviedo | 769 | $1,210 | $134.52 | 43% |
Frequently Asked Questions About Airbnb in Boal
These quick answers summarize the most common investor and operator questions using AirROI's latest market data for Boal.
How much do Airbnb hosts make in Boal?
Boal hosts earn about $3,396 per year on average, with an average nightly rate of $101 and RevPAR of $27. Those figures describe the typical revenue environment for active listings in Boal, Asturias, not the ceiling for the best operators. Source: AirROI 2026 data, Boal market, May 2025 to April 2026.
What is the average Airbnb occupancy rate in Boal?
The average Airbnb occupancy rate in Boal is 33.4%. August is the strongest month and May is the softest, so hosts should expect demand to move meaningfully throughout the year rather than stay flat.
What is the average Airbnb daily rate in Boal?
Listings in Boal average $101 per night. The broader pricing spread also matters: lower-performing listings cluster closer to the lower quartiles, while premium homes can price materially above the city average when demand spikes or listing quality stands out.
How many Airbnb listings are active in Boal?
Boal currently has about 19 active Airbnb listings in AirROI's market dataset. That supply count helps explain how competitive the market is, how much depth there is for benchmarking, and whether the market behaves like a niche destination or a scaled urban market.
How strict are short-term rental regulations in Boal?
AirROI currently classifies the short-term rental regulation level in Boal as High. The dataset also shows about 52.6% of listings with registration evidence. That is a market signal, not legal advice, so hosts should still confirm current licensing and compliance rules locally before listing.
What is the RevPAR for Airbnb in Boal?
RevPAR in Boal is about $27. That metric combines pricing and occupancy into one efficiency number, so it is often a better quick benchmark than ADR alone when investors want to compare how well listings convert nightly rates into realized revenue.
Is Airbnb profitable in Boal?
Occupancy of 33.4% means Boal is a more selective market. Profitability is achievable but requires careful cost management, premium positioning, or targeting longer stays to reduce turnover. Average annual revenue is $3,396, but individual returns depend on property type, location within the city, and the host's operating efficiency.
How far in advance do guests book Airbnb in Boal?
The average booking lead time in Boal is about 55 days — a longer planning horizon typical of destination or vacation markets where travelers book well in advance. Hosts who understand their market's booking cadence can adjust minimum stays and pricing windows accordingly.
What are the best neighborhoods for Airbnb in Boal?
Based on AirROI's analysis, some of the top neighborhoods for short-term rentals in Boal include Cangas de Onís, Gijón, Oviedo. Each area attracts different guest profiles — from business travelers to leisure visitors — so the best location depends on the property type and target audience a host is aiming for. See the full neighborhood breakdown above.
What type of property performs best on Airbnb in Boal?
entire_home listings make up 73.7% of the active supply in Boal. The most common configuration does not always mean the most profitable — operators who identify underserved property types or bedroom counts can sometimes outperform the market average by filling a gap in local supply.
How does Boal compare to nearby Airbnb markets?
Among neighboring markets, Llanera posts $19,427 in average annual revenue with 36.4% occupancy, compared to Boal's $3,396 and 33.4%. Comparing nearby markets helps investors understand whether a destination's performance reflects local demand or broader regional trends.
What is the average length of stay in Boal?
The average Airbnb stay length in Boal is about 8.7 nights. That matters for turnover, cleaning operations, and pricing strategy because shorter stays increase changeovers while longer stays can smooth occupancy and reduce operational friction.
What is the average Airbnb guest rating in Boal?
Airbnb listings in Boal average 4.87 out of 5 overall. About 15.8% of listings carry the guest favorite badge, which suggests a meaningful share of inventory is competing on review quality rather than price alone.
Which amenities boost Airbnb revenue in Boal?
Backyard and Free parking on premises are among the strongest revenue-linked amenities in Boal. In AirROI's latest dataset, listings with these amenities outperform those without on average revenue, which makes amenities analysis useful for prioritizing investment and listing upgrades.
Do Airbnb hosts charge cleaning fees in Boal?
Yes. About 21.1% of active Airbnb listings in Boal charge a cleaning fee, and the average fee is $76. The more important operating benchmark is how much of gross revenue that fee consumes, not just the absolute dollar amount.
What percentage of Airbnb hosts are Superhosts in Boal?
A 52.6% Superhost rate signals a highly competitive market where review quality and responsiveness are table stakes, not differentiators.
About AirROI Market Data
AirROI tracks over 20 million properties across 190+ countries and maintains 15+ years of historical performance data, making it one of the deepest Airbnb and STR intelligence platforms available. The analytics pipeline aggregates listing-level data monthly — revenue, occupancy, nightly rates, RevPAR, guest demographics, booking patterns, and competitive supply — so investors and operators can benchmark any market against its own history and against neighboring destinations.
Real estate investors, property managers, financial institutions, hedge funds, tourism boards, hospitality consultants, tech platforms, and academic researchers rely on AirROI data to underwrite acquisitions, optimize pricing, model macro trends, and conduct peer-reviewed research. Data is available through in-depth market reports like this one and the Airbnb API with 22 endpoints and an Airbnb MCP Server for AI agents.
AirROI proprietary analytics as of 2026-04-30. Metrics reflect trailing twelve-month aggregates from active listings. Revenue figures are market averages, not projections. Neighborhood descriptions are AI-generated and reviewed for accuracy. For full methodology, see the data methodology page.