Durness, Scotland Airbnb Market Data 2026: STR Report & Statistics
How much can you earn on Airbnb in Durness, Scotland? Based on AirROI's 2026 dataset (July 2025 – June 2026), the short answer is $27,604 per year — at a $302 nightly rate, 46.6% occupancy, and a $119 RevPAR that reflects moderate rate-to-revenue efficiency with room to optimize.
With just 28 active listings, Durness is a micro-market where moderate demand with room for well-positioned listings to outperform. Supply has held steady year over year while revenue and nightly rates climbed — a mature market where existing hosts capture more value per listing. Stable inventory paired with rising returns reflects healthy demand.
Regulation is high, and hosts should factor licensing costs and compliance timelines into their launch plan. In a market this size, differentiated listings with strong reviews can capture outsized returns relative to the competition.

Table of Contents [hide] [show]
What Are the Key Airbnb Metrics in Durness?
In Durness, the headline Airbnb metrics are $27,604 in average annual revenue,46.6% occupancy, $302 ADR, and $119 in RevPAR, and guests book about 95 days in advance.
How Much Do Airbnb Hosts Earn Monthly in Durness?
Understanding the monthly revenue variations for Airbnb listings in Durness is key to maximizing your short term rental income potential. Seasonality significantly impacts earnings. Our analysis, based on data from the past 12 months, shows that the peak revenue month for STRs in Durness is typically September, while January often presents the lowest earnings, highlighting opportunities for strategic pricing adjustments during shoulder and low seasons. Explore the typical Airbnb income in Durness across different performance tiers:
- Best-in-class properties (Top 10%) achieve $5,037+ monthly, often utilizing dynamic pricing and superior guest experiences.
- Strong performing properties (Top 25%) earn $4,069 or more, indicating effective management and desirable locations/amenities.
- Typical properties (Median) generate around $3,142 per month, representing the average market performance.
- Entry-level properties (Bottom 25%) see earnings around $2,001, often with potential for optimization.
Average Monthly Airbnb Earnings Trend in Durness
What Is the Monthly Airbnb Occupancy Rate in Durness?
Maximize your bookings by understanding the Durness STR occupancy trends. Seasonal demand shifts significantly influence how often properties are booked. Typically, Septembersees the highest demand (peak season occupancy), while January experiences the lowest (low season). Effective strategies, like adjusting minimum stays or offering promotions, can boost occupancy during slower periods. Here's how different property tiers perform in Durness:
- Best-in-class properties (Top 10%) achieve 79%+ occupancy, indicating high desirability and potentially optimized availability.
- Strong performing properties (Top 25%) maintain 67% or higher occupancy, suggesting good market fit and guest satisfaction.
- Typical properties (Median) have an occupancy rate around 50%.
- Entry-level properties (Bottom 25%) average 33% occupancy, potentially facing higher vacancy.
Average Monthly Occupancy Rate Trend in Durness
What Is the Average Airbnb Nightly Rate in Durness?
Effective short term rental pricing strategy in Durness involves understanding monthly ADR fluctuations. The Average Daily Rate (ADR) for Airbnb in Durness typically peaks in June and dips lowest during November. Leveraging Airbnb dynamic pricing tools or strategies based on this seasonality can significantly boost revenue. Here's a look at the typical nightly rates achieved:
- Best-in-class properties (Top 10%) command rates of $510+ per night, often due to premium features or locations.
- Strong performing properties (Top 25%) achieve nightly rates of $326 or more.
- Typical properties (Median) charge around $251 per night.
- Entry-level properties (Bottom 25%) earn around $174 per night.
Average Daily Rate (ADR) Trend by Month in Durness
What Is the RevPAR for Airbnb in Durness?
RevPAR in Durness is currently $119. Because RevPAR combines nightly rates with realized occupancy, it is one of the cleanest ways to compare how efficiently listings turn demand into revenue across the market.
- Entry-level properties (Bottom 25%) see $91 RevPAR.
- Typical properties (Median) generate $122 RevPAR.
- Strong performers (Top 25%) earn $143 RevPAR.
- Best-in-class (Top 10%) achieve $159 RevPAR.
Average Monthly RevPAR Trend in Durness
RevPAR Insights for Durness
- The average RevPAR in Durness is $119. This metric combines nightly rates with realized occupancy, making it one of the best single-number indicators of market efficiency.
- The gap between the top 10% ($159) and bottom 25% ($91) is $68, suggesting a relatively compressed market where operational differences yield moderate returns.
- RevPAR peaks in Sep and bottoms out in Jan, mirroring the broader seasonal demand pattern and suggesting opportunities for dynamic pricing.
Recommendations for Hosts
- Track your own RevPAR monthly against these Durness benchmarks. If your RevPAR falls below the median of $122, examine whether low occupancy or low ADR is the primary drag.
- Top-quartile listings achieve $143+ RevPAR through a combination of competitive pricing, strong reviews, and strategic amenities. Target this tier through incremental improvements.
- Use RevPAR rather than revenue alone when comparing properties of different sizes — it normalizes for available nights and gives a more accurate picture of performance.
Get Live Durness Market Intelligence 👇
Explore Real-time Analytics
When Is the Peak Season for Airbnb in Durness?
Durness's peak Airbnb season falls in September, May, July, while the softest stretch is January, February, December. Overall, the market shows highly seasonal trends requiring careful strategy, which should guide pricing, minimum stays, and cash-flow planning.
Peak Season (September, May, July)
- Revenue averages $5,112 per month
- Occupancy rates average 70.9%
- Daily rates average $308
Shoulder Season
- Revenue averages $3,084 per month
- Occupancy maintains around 48.6%
- Daily rates hold near $304
Low Season (January, February, December)
- Revenue drops to average $1,495 per month
- Occupancy decreases to average 31.2%
- Daily rates adjust to average $284
Seasonality Insights for Durness
- Airbnb seasonality in Durness is pronounced. Revenue swings sharply between peak and low months, which means pricing strategy, minimum-stay settings, and cash reserves all need to account for extended slower periods.
- During the high season, the absolute peak month showcases Durness's highest earning potential, with monthly revenues climbing to $5,743, occupancy reaching 77.3%, and ADRs peaking at $329.
- Conversely, the slowest single month marks the market's lowest point — revenue may dip to $1,305, occupancy could drop to 24.7%, and ADRs may adjust to $276.
- Understanding both the seasonal averages and these monthly peaks and troughs in revenue, occupancy, and ADR is crucial for maximizing your Airbnb profit potential in Durness.
Seasonal Strategies for Maximizing Profit
- Peak Season: Maximize revenue through premium pricing. In a high-regulation market like Durness, ensure your permit covers the number of nights you plan to book — some jurisdictions cap annual rental days.
- Low Season: Offer competitive pricing, extended-stay discounts, and flexible cancellation policies. Target off-season travelers like remote workers, budget-conscious guests, and travelers with flexible schedules.
- Shoulder Seasons: Implement dynamic pricing that bridges peak and low rates. Target weekend travelers, local events, and business visitors. Slightly more flexible terms than peak season can help maintain occupancy without deep discounting.
- In a highly seasonal market like Durness, building a cash reserve during the top months is essential for covering fixed costs during the slow period. Automated pricing tools can help capture demand shifts in real time.
Do You Need a License for Airbnb in Durness?
Durness, Scotland, United Kingdom has a high regulation classification, yet only 43% of listings show registration evidence. That gap between regulation on the books and compliance on the ground can shift quickly — municipalities often tighten enforcement in waves, putting unregistered operators at risk of fines or delisting. Always verify the latest short-term rental regulations and Airbnb license requirements directly with local government authorities for Durness to ensure full compliance before hosting.
(Source: AirROI data, 2026, based on 43% licensed listings)
What Are the Best Neighborhoods for Airbnb in Durness?
With a compact short-term rental market, Durness gives early-mover hosts an advantage in the right neighborhoods. The areas listed below are where guest demand and local attractions converge — a useful lens for investors evaluating whether to enter this market and where to position their listing.
| Neighborhood / Area | Why Host Here? (Target Guests & Appeal) | Key Attractions & Landmarks |
|---|---|---|
| Sango Sands | Popular for its stunning sandy beaches and dramatic cliffs. Attracts tourists looking for scenic views and outdoor activities like hiking and beachcombing. | Sango Bay, Durness Beach, Cape Wrath, John Lennon Memorial, Smoo Cave |
| Balnakeil Beach | Beautiful and serene beach location, perfect for those seeking tranquility and natural beauty. It's a hidden gem for travelers who love the outdoors. | Balnakeil Beach, Balnakeil Craft Village, Durness Golf Club, Ceannabeinne Beach, Smoo Cave |
| Durness Village | The heart of Durness, offering local shops, cafes, and accommodations. A great base for tourists exploring the surrounding region. | Durness Village Hall, Local cafes, Durness Beach, Smoo Cave, Near Cape Wrath |
| Cape Wrath | Remote and dramatic cliffs, perfect for adventure seekers and those wishing to explore the rugged beauty of Scotland's coastline. A popular destination for nature lovers. | Cape Wrath Lighthouse, Cape Wrath Trail, Beautiful coastal views, Wildlife watching, Historic landmarks |
| Loch Eriboll | Stunning loch area with amazing views and opportunities for outdoor activities. Popular for fishing, kayaking, and sightseeing. | Loch Eriboll, Peatlands, Wildlife viewing, Hiking trails, Scenic photography |
| Foinaven | A beautiful mountain area for hikers and nature enthusiasts. Known for its stunning landscapes and diverse wildlife. | Foinaven Mountain, Hiking routes, Wild flora and fauna, Stunning landscapes, Kayaking opportunities |
| Smoo Cave | An impressive sea cave that attracts visitors interested in geology and adventure. A popular tourist site for those exploring the Durness area. | Smoo Cave, Guided tours, Natural beauty, Historical significance, Nearby beaches |
| Durness Golf Club | A hidden gem for golf lovers, offering spectacular views and a challenging course. Draws both local and traveling golfers. | Durness Golf Course, Scenic views, Pro shop, Clubhouse, Nearby beaches |
Because Durness has a high regulation profile, confirming that short-term rental permits are available in your target neighborhood is a critical first step before committing to a property purchase. Regulation can vary at the neighborhood or district level even within the same city.
What Types of Properties Are on Airbnb in Durness?
Room Type Distribution
Property Type Distribution
Market Composition Insights for Durness
- The Durness Airbnb market composition is heavily skewed towards Entire Home/Apt listings, which make up 60.7% of the 28 active rentals. This indicates strong guest preference for privacy and space.
- However, a notable 39.3% share for Private Rooms suggests opportunities for budget-conscious travelers or hosts renting out spare rooms.
- Looking at the property type distribution in Durness, House properties are the most common (57.1%), reflecting the local real estate landscape.
- Houses represent a significant 57.1% portion, catering likely to families or larger groups.
- The presence of 28.6% Hotel/Boutique listings indicates integration with traditional hospitality.
- Smaller segments like outdoor/unique (combined 3.6%) offer potential for unique stay experiences.
Durness Airbnb Room Capacity Analysis (2026): Bedroom Distribution
Distribution of Listings by Number of Bedrooms
Room Capacity Insights for Durness
- The dominant room capacity in Durness is 1 bedroom listings, making up 39.3% of the market. This suggests a strong demand for properties suitable for couples or solo travelers.
- Together, 1 bedroom and 2 bedrooms properties represent 53.6% of the active Airbnb listings in Durness, indicating a high concentration in these sizes.
- A significant 25.0% of listings offer 3+ bedrooms, catering to larger groups and families seeking more space in Durness.
Durness Vacation Rental Guest Capacity Trends (2026)
Distribution of Listings by Guest Capacity
Guest Capacity Insights for Durness
- The most common guest capacity trend in Durness vacation rentals is listings accommodating 2 guests (35.7%). This suggests the primary traveler segment is likely couples or solo travelers.
- Properties designed for 2 guests and 8+ guests dominate the Durness STR market, accounting for 53.6% of listings.
- 35.8% of properties accommodate 6+ guests, serving the market segment for larger families or group travel in Durness.
- On average, properties in Durness are equipped to host 3.6 guests.
How Do Listings in Durness Compare on Quality?
Listing quality in Durness can be approximated through presentation depth, bedroom count, and how often hosts disclose exact locations. These signals show how professionally the local supply base is merchandised.
Listing Quality Insights for Durness
- At 24.8 photos per listing on average, Durness hosts invest well in visual presentation. Listings with 20+ photos consistently outperform in search ranking and conversion.
- 10.7% of listings show their exact location. Lower disclosure rates can increase booking hesitation — guests want to know exactly where they are staying.
Recommendations for Hosts
- Enable exact location if possible — it removes a common source of guest uncertainty and can improve your listing's position in map-based searches.
- Use these quality indicators as a self-audit checklist. Listings that exceed the Durness averages across all three metrics are better positioned for premium pricing.
What Amenities Do Airbnb Guests Expect in Durness?
Amenity Prevalence
Amenity Insights for Durness
- Essential amenities in Durness that guests expect include: Essentials, Free parking on premises, Heating, Hot water, TV. Lacking these (any) could significantly impact bookings.
- Popular amenities like Bed linens, Smoke alarm, Wifi are common but not universal. Offering these can provide a competitive edge.
- Warning: Wifi is not universally provided but is considered essential globally. Ensure reliable Wifi is offered.
Recommendations for Hosts
- Ensure your listing includes all essential amenities for Durness: Essentials, Free parking on premises, Heating, Hot water, TV.
- Prioritize adding missing essentials: TV.
- Consider adding popular differentiators like Bed linens or Smoke alarm to increase appeal.
- Highlight unique or less common amenities you offer (e.g., hot tub, dedicated workspace, EV charger) in your listing description and photos.
- Regularly check competitor amenities in Durness to stay competitive.
Which Airbnb Amenities Boost Revenue in Durness?
Not every amenity matters equally. This table focuses on the amenities most associated with higher revenue in Durness, which makes it more useful for prioritizing upgrades than a simple popularity list alone.
| Amenity | Prevalence | Revenue With | Revenue Without | Revenue Uplift |
|---|---|---|---|---|
Private entrance | 75.0% | $30,716 | $18,270 | 68.1% |
Dining table | 32.1% | $37,582 | $22,878 | 64.3% |
Wine glasses | 42.9% | $35,322 | $21,816 | 61.9% |
Clothing storage | 42.9% | $35,192 | $21,914 | 60.6% |
Beach access | 32.1% | $36,776 | $23,260 | 58.1% |
Self check-in | 42.9% | $34,599 | $22,358 | 54.7% |
Hangers | 78.6% | $29,822 | $19,472 | 53.2% |
Cleaning products | 35.7% | $35,457 | $23,242 | 52.6% |
Laundromat nearby | 35.7% | $35,126 | $23,425 | 50.0% |
Hot water kettle | 57.1% | $31,618 | $22,252 | 42.1% |
Revenue Impact Insights for Durness
- Private entrance tops the revenue impact list with a 68.1% uplift — listings with this amenity earn $30,716 vs. $18,270 without it.
Recommendations for Hosts
- Focus your upgrade budget on amenities in the top half of this table. Below-median amenities may improve guest experience but contribute less to revenue growth.
- Highlight revenue-impacting amenities prominently in your listing title, photos, and description — guests can't value what they don't notice.
Dive Deeper: Advanced Durness STR Market Data (2026)
Ready to unlock more insights? AirROI provides access to advanced metrics and comprehensive Airbnb data for Durness. Explore detailed analytics beyond this report to refine your investment strategy, optimize pricing, and maximize your vacation rental profits.
Explore Advanced MetricsDurness Airbnb Guest Demographics & Profile Analysis (2026)
Guest Profile Summary for Durness
- The typical guest profile for Airbnb in Durness consists of a mix of domestic (53%) and international guests, often arriving from nearby England, typically belonging to the Post-2000s (Gen Z/Alpha) group (50%), primarily speaking English or German.
- Domestic travelers account for 53.1% of guests.
- Key international markets include United Kingdom (53.1%) and United States (10.3%).
- Top languages spoken are English (55.6%) followed by German (9.3%).
- A significant demographic segment is the Post-2000s (Gen Z/Alpha) group, representing 50% of guests.
Recommendations for Hosts
- Balance marketing efforts between domestic and international channels based on the guest mix.
- Tailor amenities and listing descriptions to appeal to the dominant Post-2000s (Gen Z/Alpha) demographic (e.g., highlight fast WiFi, smart home features, local guides).
- Highlight unique local experiences or amenities relevant to the primary guest profile.
- Consider seasonal promotions aligned with peak travel times for key origin markets.
What Are Airbnb Guest Ratings in Durness?
Listings in Durness average 4.84 out of 5 overall, with about 174.2 reviews per active listing and 53.6% of listings carrying the Guest Favorite badge.
Rating Breakdown by Category
Guest Rating Insights for Durness
- With an overall rating of 4.84, Durness listings meet an exceptionally high bar. Guests consistently report strong satisfaction, which drives repeat bookings and referral traffic.
- The strongest subcategory is Accuracy (4.92), while Value (4.67) trails behind — a useful signal for hosts looking to prioritize upgrades.
- 53.6% of listings carry the Guest Favorite badge, a strong trust signal that can meaningfully lift click-through and booking rates.
Recommendations for Hosts
- Focus improvement efforts on Value — even small gains in the weakest subcategory can lift overall ratings and search ranking.
- Encourage guests to leave reviews after checkout. Listings with more reviews rank higher in search results and convert browsers into bookers more effectively.
Durness Airbnb Booking Patterns (2026): Available vs. Booked Days
Available Days Distribution
Booked Days Distribution
Booking Pattern Insights for Durness
- The most common availability pattern in Durness falls within the 271-366 days range, representing 32.1% of listings. This suggests many properties have significant open periods on their calendars.
- Approximately 64.2% of listings show high availability (181+ days open annually), indicating potential for increased bookings or specific owner usage patterns.
- For booked days, the 91-180 days range is most frequent in Durness (32.1%), reflecting common guest stay durations or potential owner blocking patterns.
- A notable 35.7% of properties secure long booking periods (181+ days booked per year), highlighting successful long-term rental strategies or significant owner usage.
How Far in Advance Do Guests Book Airbnb in Durness?
Average Booking Lead Time by Month
Booking Lead Time Insights for Durness
- The overall average booking lead time for vacation rentals in Durness is 95 days.
- Guests book furthest in advance for stays during June (average 127 days), likely coinciding with peak travel demand or local events.
- The shortest booking windows occur for stays in November (average 33 days), indicating more last-minute travel plans during this time.
- Seasonally, Summer (108 days avg.) sees the longest lead times, while Winter (57 days avg.) has the shortest, reflecting typical travel planning cycles.
Recommendations for Hosts
- Use the overall average lead time (95 days) as a baseline for your pricing and availability strategy in Durness.
- For June stays, consider implementing length-of-stay discounts or slightly higher rates for bookings made less than 127 days out to capitalize on advance planning.
- Target marketing efforts for the Summer season well in advance (at least 108 days) to capture early planners.
- Monitor your own booking lead times against these Durness averages to identify opportunities for dynamic pricing adjustments.
What Is the Average Length of Stay for Airbnb in Durness?
Guests in Durness stay about 3.3 nights on average, generating roughly 835 reservations and 29.8 bookings per listing in the latest AirROI dataset. The most common check-in time is 4:00 PM and check-out is 10:00 AM.
Monthly Length of Stay in Durness
Check-in Time Distribution
Check-out Time Distribution
Stay Pattern Insights for Durness
- A mid-range stay length points to leisure-driven demand — weekend getaways and short vacations. Hosts should optimize for quick turnover efficiency while keeping the guest experience smooth.
- At 29.8 bookings per listing, the turnover rate is high. Hosts with streamlined operations (self-check-in, automated messaging, reliable cleaners) have a structural advantage.
- Stay lengths peak in Feb (6.5 nights) and shorten in Nov (1.5 nights). Adjust minimum-night requirements seasonally to match.
Recommendations for Hosts
- With shorter average stays, focus on streamlining turnover. Self-check-in, reliable cleaning crews, and pre-staged amenities can reduce per-booking operational costs.
- Set your check-in time to match or beat the market standard of 4:00 PM. Offering early check-in flexibility can be a low-cost differentiator.
- Monitor length-of-stay seasonality to adjust minimum-night requirements — longer minimums during peak periods maximize revenue while shorter minimums fill gaps in shoulder seasons.
Durness Airbnb Minimum Stay Requirements Analysis
Distribution of Listings by Minimum Night Requirement
1 Night
12 listings
42.9% of total
2 Nights
3 listings
10.7% of total
7-29 Nights
2 listings
7.1% of total
30+ Nights
11 listings
39.3% of total
Key Insights
- The most prevalent minimum stay requirement in Durness is 1 Night, adopted by 42.9% of listings. This highlights the market's preference for shorter, flexible bookings.
- A significant segment (39.3%) caters to monthly stays (30+ nights) in Durness, pointing to opportunities in the extended-stay market.
Recommendations
- Align with the market by considering a 1 Night minimum stay, as 42.9% of Durness hosts use this setting.
- Explore offering discounts for stays of 30+ nights to attract the 39.3% of the market seeking extended stays.
- Adjust minimum nights based on seasonality – potentially shorter during low season and longer during peak demand periods in Durness.
Durness Airbnb Cancellation Policy Trends Analysis (2026)
Super Strict 60 Days
3 listings
10.7% of total
Limited
1 listings
3.6% of total
Flexible
5 listings
17.9% of total
Firm
3 listings
10.7% of total
Strict
16 listings
57.1% of total
Cancellation Policy Insights for Durness
- The prevailing Airbnb cancellation policy trend in Durness is Strict, used by 57.1% of listings.
- A majority (67.8%) of hosts in Durness utilize Firm or Strict policies, indicating a market where hosts prioritize booking security.
Recommendations for Hosts
- Consider adopting a Strict policy to align with the 57.1% market standard in Durness.
- With 57.1% using Strict terms, this is a viable option in Durness, particularly for high-value properties or during peak demand periods.
- Regularly review your cancellation policy against competitors and market demand shifts in Durness.
How Much Are Airbnb Cleaning Fees in Durness?
Cleaning fees in Durness are meaningful operating levers, not just pass-through charges. What matters most is how often hosts charge them, how high they run relative to market norms, and how large a share of gross revenue they consume.
Cleaning Fee Insights for Durness
- Only 17.9% of listings charge a cleaning fee, suggesting that most hosts in Durness bundle cleaning costs into the nightly rate.
- The gap between the average ($549) and median ($13) cleaning fee indicates some high-end properties are pulling the average up considerably.
- Cleaning fees represent 3.7% of gross revenue on average — a modest component of the overall booking price.
Recommendations for Hosts
- Price your cleaning fee competitively against the Durness median of $13. Fees significantly above market norms can deter bookings, especially for shorter stays.
- Monitor competitor cleaning fees regularly. Airbnb's search algorithm factors in total price, so a well-calibrated cleaning fee can improve your listing's ranking.
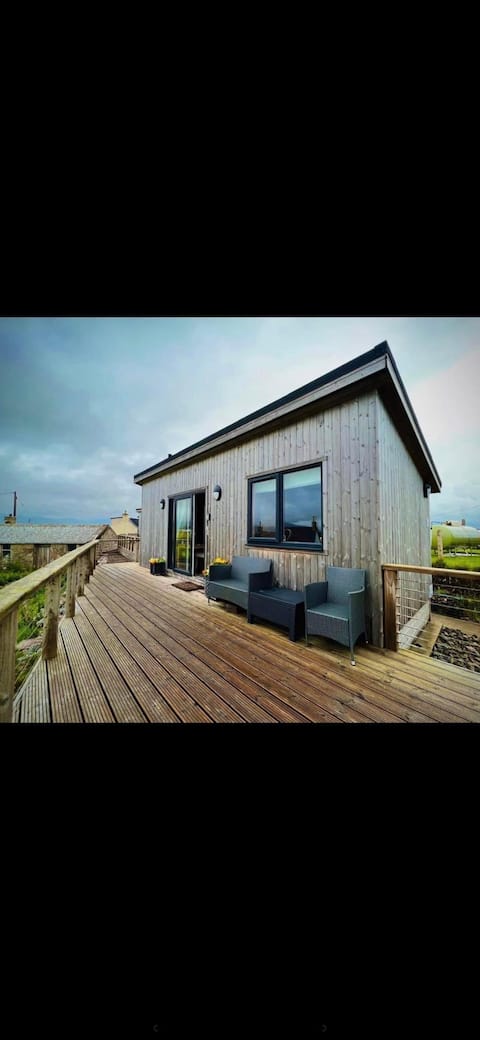
What Do the Top Airbnb Listings in Durness Look Like?
Benchmark your potential! Explore examples of top-performing Airbnb properties in Durnessbased on Trailing Twelve Month (TTM) revenue. Analyze their characteristics, revenue, occupancy rate, and ADR to understand what drives success in this market.
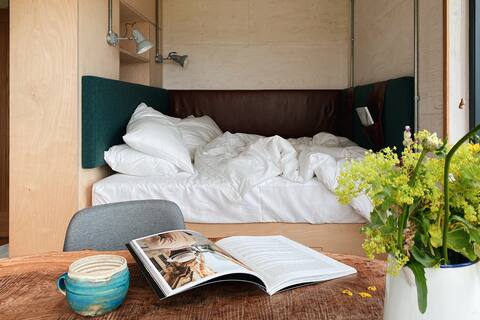
THE BOTHAN - unique Tiny House @ Mackay's
Entire Place • N/A
Acacia shepherd hut @ Aiden House B&B, Durness
Entire Place • 1 bedroom

Holiday House with garden & sauna (Self Catering)
Entire Place • 2 bedrooms
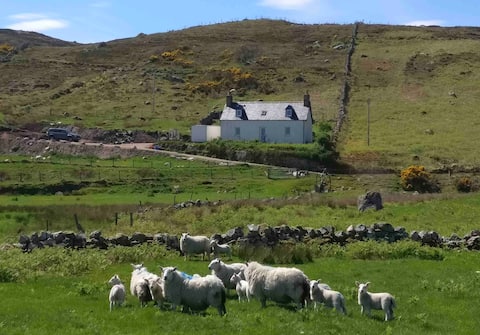
TIGH CEIT (Kate's House) a traditional croft house
Entire Place • 3 bedrooms

Kenandra, shepherd hut @ Aiden House B&B, Durness
Entire Place • 1 bedroom

Atlantic Pods Durness - Puffin Pod
Entire Place • 1 bedroom
Note: Performance varies based on location, size, amenities, seasonality, and management quality. Data reflects the past 12 months.
Who Are the Top Airbnb Hosts in Durness?
Learn from the best! This table showcases top-performing Airbnb hosts in Durness based on the number of properties managed and estimated total revenue over the past year. Analyze their scale and performance metrics.
| Host Name | Properties | Grossing Revenue | Stay Reviews | Avg Rating |
|---|---|---|---|---|
| Alexandra | 6 | $217,632 | 1132 | 4.94/5.0 |
| Fiona | 6 | $151,009 | 937 | 4.59/5.0 |
| Kirsteen | 3 | $115,956 | 736 | 4.93/5.0 |
| Philipp | 2 | $76,194 | 1492 | 4.67/5.0 |
| Donald | 1 | $47,526 | 208 | 4.89/5.0 |
| Merlin | 3 | $43,561 | 100 | 4.99/5.0 |
| Fiona | 3 | $39,707 | 14 | 4.92/5.0 |
| Ewen | 1 | $39,323 | 72 | 4.94/5.0 |
| Sally | 1 | $32,378 | 8 | 5.00/5.0 |
| Elliot Houses | 1 | $6,285 | 3 | 5.00/5.0 |
Analyzing the strategies of top hosts, such as their property selection, pricing, and guest communication, can offer valuable lessons for optimizing your own Airbnb operations in Durness.
Who Are the Airbnb Hosts in Durness?
Durness has a relatively balanced host base.
Host Profile Insights for Durness
- A 42.9% Superhost share is healthy — enough experienced operators to anchor quality without making the market impenetrable for newcomers.
- 3.6% of listings are professionally managed, reflecting a market still dominated by individual hosts.
- 0.0% of listings have Instant Book enabled. Lower Instant Book adoption means many guests must request approval, which can slow conversions.
- 75.0% of listings use Airbnb's simplified pricing (host-only fee), where the host pays the entire platform service fee and the guest sees one all-in price with no separate Airbnb service charge. High adoption signals a professional, PMS-connected host base — Airbnb mandates simplified pricing for software-connected listings.
Recommendations for Hosts
- Earning Superhost status can significantly improve search ranking and guest trust. Focus on maintaining high response rates, low cancellations, and strong reviews.
- Consider enabling Instant Book — it reduces booking friction and Airbnb's algorithm tends to favor Instant Book listings in search results.
- Benchmark your host metrics against these Durness averages regularly and adjust your hosting strategy based on what top performers do differently.
Top Professional Management Companies in Durness
These are the highest-grossing professional property management operations in Durness, ranked by total revenue across their portfolio. Their performance metrics offer a benchmark for what institutional-level hosting looks like in this market.
| Company | Listings | Revenue | ADR | Occ. | Rating |
|---|---|---|---|---|---|
| Holidaycottages.Co.Uk | 1 | $3,347 | $776 | 8.1% | N/A |
Management Company Insights for Durness
- The leading management company, Holidaycottages.Co.Uk, operates 1 listings with $3,347 in gross revenue — a useful benchmark for what scale looks like in Durness.
- Top managers average 1 properties each, suggesting professional management in Durness still operates at a relatively boutique scale.
Recommendations
- With only 3.6% of listings professionally managed, there may be an opportunity to differentiate through more structured operations and consistent guest experiences.
- Study how top management companies price, position, and maintain their portfolios — their ADR and occupancy rates reflect strategies refined across dozens of listings.
- If you're considering hiring a property manager, compare their portfolio performance against these benchmarks before committing.
How Does Durness's Airbnb Market Compare to Nearby Cities?
How does the Durness Airbnb market stack up against its neighbors? Compare key performance metrics like average monthly revenue, ADR, and occupancy rates in surrounding areas to understand the broader regional STR landscape.
Compared with Stromeferry, Durness has 17 percentage points lower occupancy and about $41 higher ADR. That helps frame whether this market is winning more on demand, pricing, or both.
| Market | Active Properties | Monthly Revenue | Daily Rate | Avg. Occupancy |
|---|---|---|---|---|
| Foyers | 16 | $7,142 | $386.76 | 61% |
| North Kessock | 11 | $5,491 | $543.42 | 50% |
| Camuscross | 13 | $5,050 | $389.95 | 54% |
| Insh | 13 | $4,875 | $304.12 | 56% |
| Dulnain Bridge | 15 | $4,623 | $408.62 | 45% |
| Dallas | 10 | $4,086 | $356.82 | 42% |
| Broadford | 86 | $4,009 | $302.93 | 58% |
| Nethy Bridge | 50 | $3,836 | $270.36 | 49% |
| Daviot | 11 | $3,815 | $320.89 | 48% |
| Stromeferry | 13 | $3,742 | $260.43 | 64% |
Frequently Asked Questions About Airbnb in Durness
These quick answers summarize the most common investor and operator questions using AirROI's latest market data for Durness.
How much do Airbnb hosts make in Durness?
Durness hosts earn about $27,604 per year on average, with an average nightly rate of $302 and RevPAR of $119. Those figures describe the typical revenue environment for active listings in Durness, Scotland, not the ceiling for the best operators. Source: AirROI 2026 data, Durness market, July 2025 to June 2026.
What is the average Airbnb occupancy rate in Durness?
The average Airbnb occupancy rate in Durness is 46.6%. September is the strongest month and January is the softest, so hosts should expect demand to move meaningfully throughout the year rather than stay flat.
What is the average Airbnb daily rate in Durness?
Listings in Durness average $302 per night. The broader pricing spread also matters: lower-performing listings cluster closer to the lower quartiles, while premium homes can price materially above the city average when demand spikes or listing quality stands out.
How many Airbnb listings are active in Durness?
Durness currently has about 28 active Airbnb listings in AirROI's market dataset. That supply count helps explain how competitive the market is, how much depth there is for benchmarking, and whether the market behaves like a niche destination or a scaled urban market.
How strict are short-term rental regulations in Durness?
AirROI currently classifies the short-term rental regulation level in Durness as High. The dataset also shows about 42.9% of listings with registration evidence. That is a market signal, not legal advice, so hosts should still confirm current licensing and compliance rules locally before listing.
What is the RevPAR for Airbnb in Durness?
RevPAR in Durness is about $119. That metric combines pricing and occupancy into one efficiency number, so it is often a better quick benchmark than ADR alone when investors want to compare how well listings convert nightly rates into realized revenue.
Is Airbnb profitable in Durness?
At 46.6% occupancy, Durness can be profitable — but margins depend heavily on operating costs, property acquisition price, and how well hosts optimize pricing across seasons. Average annual revenue is $27,604, but individual returns depend on property type, location within the city, and the host's operating efficiency.
How far in advance do guests book Airbnb in Durness?
The average booking lead time in Durness is about 95 days — a longer planning horizon typical of destination or vacation markets where travelers book well in advance. Hosts who understand their market's booking cadence can adjust minimum stays and pricing windows accordingly.
What are the best neighborhoods for Airbnb in Durness?
Based on AirROI's analysis, some of the top neighborhoods for short-term rentals in Durness include Sango Sands, Balnakeil Beach, Durness Village. Each area attracts different guest profiles — from business travelers to leisure visitors — so the best location depends on the property type and target audience a host is aiming for. See the full neighborhood breakdown above.
What type of property performs best on Airbnb in Durness?
entire_home listings make up 60.7% of the active supply in Durness. The most common configuration does not always mean the most profitable — operators who identify underserved property types or bedroom counts can sometimes outperform the market average by filling a gap in local supply.
How does Durness compare to nearby Airbnb markets?
Among neighboring markets, Foyers posts $85,709 in average annual revenue with 60.8% occupancy, compared to Durness's $27,604 and 46.6%. Comparing nearby markets helps investors understand whether a destination's performance reflects local demand or broader regional trends.
What is the average length of stay in Durness?
The average Airbnb stay length in Durness is about 3.3 nights. That matters for turnover, cleaning operations, and pricing strategy because shorter stays increase changeovers while longer stays can smooth occupancy and reduce operational friction.
What is the average Airbnb guest rating in Durness?
Airbnb listings in Durness average 4.84 out of 5 overall. About 53.6% of listings carry the guest favorite badge, which suggests a meaningful share of inventory is competing on review quality rather than price alone.
Which amenities boost Airbnb revenue in Durness?
Private entrance and Dining table are among the strongest revenue-linked amenities in Durness. In AirROI's latest dataset, listings with these amenities outperform those without on average revenue, which makes amenities analysis useful for prioritizing investment and listing upgrades.
Do Airbnb hosts charge cleaning fees in Durness?
Yes. About 17.9% of active Airbnb listings in Durness charge a cleaning fee, and the average fee is $549. The more important operating benchmark is how much of gross revenue that fee consumes, not just the absolute dollar amount.
What percentage of Airbnb hosts are Superhosts in Durness?
A 42.9% Superhost rate signals a highly competitive market where review quality and responsiveness are table stakes, not differentiators.
About AirROI Market Data
AirROI tracks over 20 million properties across 190+ countries and maintains 15+ years of historical performance data, making it one of the deepest Airbnb and STR intelligence platforms available. The analytics pipeline aggregates listing-level data monthly — revenue, occupancy, nightly rates, RevPAR, guest demographics, booking patterns, and competitive supply — so investors and operators can benchmark any market against its own history and against neighboring destinations.
Real estate investors, property managers, financial institutions, hedge funds, tourism boards, hospitality consultants, tech platforms, and academic researchers rely on AirROI data to underwrite acquisitions, optimize pricing, model macro trends, and conduct peer-reviewed research. Data is available through in-depth market reports like this one and the Airbnb API with 22 endpoints and an Airbnb MCP Server for AI agents.
AirROI proprietary analytics as of 2026-06-30. Metrics reflect trailing twelve-month aggregates from active listings. Revenue figures are market averages, not projections. Neighborhood descriptions are AI-generated and reviewed for accuracy. For full methodology, see the data methodology page.