Panama City Beach, Florida Airbnb Market Data 2026: STR Report & Statistics
How much can you earn on Airbnb in Panama City Beach, Florida? Based on AirROI's 2026 dataset (July 2025 – June 2026), the short answer is $34,199 per year — at a $356 nightly rate, 38.0% occupancy, and a $142 RevPAR that reflects moderate rate-to-revenue efficiency with room to optimize.
Panama City Beach's 10,341 active listings and moderate demand with room for well-positioned listings to outperform make it a major short-term rental market. Supply grew 15.6% over the past year, yet revenue and nightly rates both trended upward — a signal that traveler demand is outpacing new inventory rather than being diluted by it. For hosts, pricing power remains intact even as competition increases.
Regulation is high and 67% of listings show active registration — compliance is the cost of entry. The data points to a market where fundamentals reward execution — the right property, priced well, in the right neighborhood still outperforms.

Table of Contents [hide] [show]
What Are the Key Airbnb Metrics in Panama City Beach?
In Panama City Beach, the headline Airbnb metrics are $34,199 in average annual revenue,38.0% occupancy, $356 ADR, and $142 in RevPAR, and guests book about 60 days in advance.
How Much Do Airbnb Hosts Earn Monthly in Panama City Beach?
Understanding the monthly revenue variations for Airbnb listings in Panama City Beach is key to maximizing your short term rental income potential. Seasonality significantly impacts earnings. Our analysis, based on data from the past 12 months, shows that the peak revenue month for STRs in Panama City Beach is typically July, while January often presents the lowest earnings, highlighting opportunities for strategic pricing adjustments during shoulder and low seasons. Explore the typical Airbnb income in Panama City Beach across different performance tiers:
- Best-in-class properties (Top 10%) achieve $8,663+ monthly, often utilizing dynamic pricing and superior guest experiences.
- Strong performing properties (Top 25%) earn $5,729 or more, indicating effective management and desirable locations/amenities.
- Typical properties (Median) generate around $3,363 per month, representing the average market performance.
- Entry-level properties (Bottom 25%) see earnings around $1,717, often with potential for optimization.
Average Monthly Airbnb Earnings Trend in Panama City Beach
What Is the Monthly Airbnb Occupancy Rate in Panama City Beach?
Maximize your bookings by understanding the Panama City Beach STR occupancy trends. Seasonal demand shifts significantly influence how often properties are booked. Typically, Julysees the highest demand (peak season occupancy), while January experiences the lowest (low season). Effective strategies, like adjusting minimum stays or offering promotions, can boost occupancy during slower periods. Here's how different property tiers perform in Panama City Beach:
- Best-in-class properties (Top 10%) achieve 77%+ occupancy, indicating high desirability and potentially optimized availability.
- Strong performing properties (Top 25%) maintain 56% or higher occupancy, suggesting good market fit and guest satisfaction.
- Typical properties (Median) have an occupancy rate around 35%.
- Entry-level properties (Bottom 25%) average 18% occupancy, potentially facing higher vacancy.
Average Monthly Occupancy Rate Trend in Panama City Beach
What Is the Average Airbnb Nightly Rate in Panama City Beach?
Effective short term rental pricing strategy in Panama City Beach involves understanding monthly ADR fluctuations. The Average Daily Rate (ADR) for Airbnb in Panama City Beach typically peaks in June and dips lowest during November. Leveraging Airbnb dynamic pricing tools or strategies based on this seasonality can significantly boost revenue. Here's a look at the typical nightly rates achieved:
- Best-in-class properties (Top 10%) command rates of $545+ per night, often due to premium features or locations.
- Strong performing properties (Top 25%) achieve nightly rates of $403 or more.
- Typical properties (Median) charge around $302 per night.
- Entry-level properties (Bottom 25%) earn around $233 per night.
Average Daily Rate (ADR) Trend by Month in Panama City Beach
What Is the RevPAR for Airbnb in Panama City Beach?
RevPAR in Panama City Beach is currently $142. Because RevPAR combines nightly rates with realized occupancy, it is one of the cleanest ways to compare how efficiently listings turn demand into revenue across the market.
- Entry-level properties (Bottom 25%) see $81 RevPAR.
- Typical properties (Median) generate $120 RevPAR.
- Strong performers (Top 25%) earn $174 RevPAR.
- Best-in-class (Top 10%) achieve $246 RevPAR.
Average Monthly RevPAR Trend in Panama City Beach
RevPAR Insights for Panama City Beach
- The average RevPAR in Panama City Beach is $142. This metric combines nightly rates with realized occupancy, making it one of the best single-number indicators of market efficiency.
- The gap between the top 10% ($246) and bottom 25% ($81) is $166, indicating significant performance disparity driven by property quality, pricing strategy, and location.
- RevPAR peaks in Jul and bottoms out in Jan, mirroring the broader seasonal demand pattern and suggesting opportunities for dynamic pricing.
Recommendations for Hosts
- Track your own RevPAR monthly against these Panama City Beach benchmarks. If your RevPAR falls below the median of $120, examine whether low occupancy or low ADR is the primary drag.
- Top-quartile listings achieve $174+ RevPAR through a combination of competitive pricing, strong reviews, and strategic amenities. Target this tier through incremental improvements.
- Use RevPAR rather than revenue alone when comparing properties of different sizes — it normalizes for available nights and gives a more accurate picture of performance.
Get Live Panama City Beach Market Intelligence 👇
Explore Real-time Analytics
When Is the Peak Season for Airbnb in Panama City Beach?
Panama City Beach's peak Airbnb season falls in July, June, May, while the softest stretch is January, November, December. Overall, the market shows highly seasonal trends requiring careful strategy, which should guide pricing, minimum stays, and cash-flow planning.
Peak Season (July, June, May)
- Revenue averages $6,420 per month
- Occupancy rates average 48.2%
- Daily rates average $428
Shoulder Season
- Revenue averages $4,213 per month
- Occupancy maintains around 40.6%
- Daily rates hold near $338
Low Season (January, November, December)
- Revenue drops to average $2,411 per month
- Occupancy decreases to average 25.5%
- Daily rates adjust to average $302
Seasonality Insights for Panama City Beach
- Airbnb seasonality in Panama City Beach is pronounced. Revenue swings sharply between peak and low months, which means pricing strategy, minimum-stay settings, and cash reserves all need to account for extended slower periods.
- During the high season, the absolute peak month showcases Panama City Beach's highest earning potential, with monthly revenues climbing to $8,765, occupancy reaching 64.7%, and ADRs peaking at $473.
- Conversely, the slowest single month marks the market's lowest point — revenue may dip to $2,295, occupancy could drop to 24.2%, and ADRs may adjust to $292.
- Lower occupancy paired with meaningful seasonality means hosts in Panama City Beach need to maximize every peak-season booking and seriously consider whether off-season pricing adjustments or minimum-stay changes can capture incremental revenue.
Seasonal Strategies for Maximizing Profit
- Peak Season: Maximize revenue through premium pricing. In a high-regulation market like Panama City Beach, ensure your permit covers the number of nights you plan to book — some jurisdictions cap annual rental days.
- Low Season: Offer competitive pricing, extended-stay discounts, and flexible cancellation policies. Target off-season travelers like remote workers, budget-conscious guests, and travelers with flexible schedules.
- Shoulder Seasons: Implement dynamic pricing that bridges peak and low rates. Target weekend travelers, local events, and business visitors. Slightly more flexible terms than peak season can help maintain occupancy without deep discounting.
- In a highly seasonal market like Panama City Beach, building a cash reserve during the top months is essential for covering fixed costs during the slow period. Automated pricing tools can help capture demand shifts in real time.
Do You Need a License for Airbnb in Panama City Beach?
Yes, Panama City Beach, Florida, United States enforces high STR regulations and 67% of active listings show registration evidence — indicating that enforcement is active and compliance is a prerequisite for operating legally. Hosts entering this market should budget for permit fees, inspections, and potential occupancy tax obligations as part of their startup costs. Always verify the latest short-term rental regulations and Airbnb license requirements directly with local government authorities for Panama City Beach to ensure full compliance before hosting.
(Source: AirROI data, 2026, based on 67% licensed listings)
What Are the Best Neighborhoods for Airbnb in Panama City Beach?
In a large, heavily regulated market like Panama City Beach, neighborhood selection is one of the strongest levers for Airbnb investment performance. Zoning rules, permitting availability, and guest demand patterns can vary block by block. The 8 neighborhoods below represent areas where short-term rental activity concentrates — understanding why each one attracts guests and hosts helps investors evaluate where their property type and budget fit best.
| Neighborhood / Area | Why Host Here? (Target Guests & Appeal) | Key Attractions & Landmarks |
|---|---|---|
| Panama City Beach | A renowned beach destination famous for its stunning white sandy beaches and emerald-green waters. It's a popular vacation spot for families and party-goers alike, making it an ideal location for vacation rentals. | Pier Park, Gulf World Marine Park, St. Andrews State Park, Captain Anderson's Marina, Shell Island, Panama City Beach Skywheel |
| East Front Beach Road | Offers a mix of beachside accommodations and proximity to attractions like Pier Park. It's particularly desirable for those looking to enjoy the beach and nearby dining and shopping. | Pier Park, M.B. Miller County Pier, Gulf View Cafe, Mellow Mushroom, The Dasher, Shaw Park |
| Thomas Drive | Known for its family-friendly atmosphere and close access to major attractions, making it a preferred choice for families and vacationing groups. | Schooners Beach Club, St. Andrews State Park, 864 m to be or not to be, Emerald Falls Family Recreation Center, Coconut Creek Family Fun Park |
| West End | This area offers a quieter, more relaxed beach experience while still being close to many popular attractions, great for visitors looking to avoid crowding. | Carillon Beach, Inlet Beach, The Hub, Watersound Beach, Camp Helen State Park |
| North Lagoon Drive | Provides a mix of waterfront properties and access to the bay, appealing for those looking for both beach and boating experiences. | Gran Lagunas, Nora's Cove, Sandy Point, Near Glassy Waters, Panama City Beach Boat Rentals |
| Laguna Beach | A peaceful alternative to the busier areas, known for its beautiful homes and residential vibe, making it appealing for longer stays and family vacations. | Laguna Beach Winery, Alys Beach, Seacrest Beach, Rosemary Beach |
| South Thomas Drive | Famous for its nightlife and beach parties, this area attracts younger crowds and is perfect for short-term rental investments to cater to party-goers. | Club La Vela, Coyote Ugly Saloon, The Hangout, Hurricane Oyster Bar |
| Frankford Avenue | An up-and-coming area that combines charm with proximity to the beach; appealing for those seeking rental opportunities in a developing neighborhood. | Frankford Avenue Beach Access, Taco Bell, Nearby Supermarket, Local boutiques and shops |
Because Panama City Beach has a high regulation profile, confirming that short-term rental permits are available in your target neighborhood is a critical first step before committing to a property purchase. Regulation can vary at the neighborhood or district level even within the same city.
What Types of Properties Are on Airbnb in Panama City Beach?
Room Type Distribution
Property Type Distribution
Market Composition Insights for Panama City Beach
- The Panama City Beach Airbnb market composition is heavily skewed towards Entire Home/Apt listings, which make up 99.1% of the 10,341 active rentals. This indicates strong guest preference for privacy and space.
- Looking at the property type distribution in Panama City Beach, Apartment/Condo properties are the most common (71.6%), reflecting the local real estate landscape.
- Houses represent a significant 27% portion, catering likely to families or larger groups.
- Smaller segments like hotel/boutique, others, unique stays (combined 1.3%) offer potential for unique stay experiences.
Panama City Beach Airbnb Room Capacity Analysis (2026): Bedroom Distribution
Distribution of Listings by Number of Bedrooms
Room Capacity Insights for Panama City Beach
- The dominant room capacity in Panama City Beach is 2 bedrooms listings, making up 35.7% of the market. This suggests a strong demand for properties suitable for couples or solo travelers.
- Together, 2 bedrooms and 1 bedroom properties represent 62.5% of the active Airbnb listings in Panama City Beach, indicating a high concentration in these sizes.
- A significant 33.7% of listings offer 3+ bedrooms, catering to larger groups and families seeking more space in Panama City Beach.
Panama City Beach Vacation Rental Guest Capacity Trends (2026)
Distribution of Listings by Guest Capacity
Guest Capacity Insights for Panama City Beach
- The most common guest capacity trend in Panama City Beach vacation rentals is listings accommodating 8+ guests (42.2%). This suggests the primary traveler segment is likely larger groups.
- Properties designed for 8+ guests and 6 guests dominate the Panama City Beach STR market, accounting for 73.2% of listings.
- 76.7% of properties accommodate 6+ guests, serving the market segment for larger families or group travel in Panama City Beach.
- On average, properties in Panama City Beach are equipped to host 6.4 guests.
How Do Listings in Panama City Beach Compare on Quality?
Listing quality in Panama City Beach can be approximated through presentation depth, bedroom count, and how often hosts disclose exact locations. These signals show how professionally the local supply base is merchandised.
Listing Quality Insights for Panama City Beach
- At 42.6 photos per listing on average, Panama City Beach hosts invest well in visual presentation. Listings with 20+ photos consistently outperform in search ranking and conversion.
- 48.7% of listings show their exact location. Lower disclosure rates can increase booking hesitation — guests want to know exactly where they are staying.
Recommendations for Hosts
- Enable exact location if possible — it removes a common source of guest uncertainty and can improve your listing's position in map-based searches.
- Use these quality indicators as a self-audit checklist. Listings that exceed the Panama City Beach averages across all three metrics are better positioned for premium pricing.
What Amenities Do Airbnb Guests Expect in Panama City Beach?
Amenity Prevalence
Amenity Insights for Panama City Beach
- Essential amenities in Panama City Beach that guests expect include: Air conditioning, Wifi, TV, Kitchen, Smoke alarm, Coffee maker. Lacking these (any) could significantly impact bookings.
- Popular amenities like Microwave, Heating, Washer are common but not universal. Offering these can provide a competitive edge.
Recommendations for Hosts
- Ensure your listing includes all essential amenities for Panama City Beach: Air conditioning, Wifi, TV, Kitchen, Smoke alarm, Coffee maker.
- Prioritize adding missing essentials: Air conditioning, Wifi, TV, Kitchen, Smoke alarm, Coffee maker.
- Consider adding popular differentiators like Microwave or Heating to increase appeal.
- Highlight unique or less common amenities you offer (e.g., hot tub, dedicated workspace, EV charger) in your listing description and photos.
- Regularly check competitor amenities in Panama City Beach to stay competitive.
Which Airbnb Amenities Boost Revenue in Panama City Beach?
Not every amenity matters equally. This table focuses on the amenities most associated with higher revenue in Panama City Beach, which makes it more useful for prioritizing upgrades than a simple popularity list alone.
| Amenity | Prevalence | Revenue With | Revenue Without | Revenue Uplift |
|---|---|---|---|---|
Heating | 94.2% | $35,387 | $14,978 | 136.3% |
Baby monitorHigh opportunity | 0.3% | $77,097 | $34,074 | 126.3% |
Kitchen | 97.6% | $34,652 | $15,546 | 122.9% |
PianoHigh opportunity | 0.1% | $73,145 | $34,158 | 114.1% |
Baby bathHigh opportunity | 0.6% | $71,805 | $33,987 | 111.3% |
Table corner guardsHigh opportunity | 0.1% | $70,567 | $34,146 | 106.7% |
Children's playroom | 1.0% | $67,014 | $33,879 | 97.8% |
Theme room | 0.9% | $63,852 | $33,927 | 88.2% |
Life size games | 1.3% | $63,046 | $33,823 | 86.4% |
Window guards | 0.6% | $58,894 | $34,048 | 73.0% |
Revenue Impact Insights for Panama City Beach
- Heating tops the revenue impact list with a 136.3% uplift — listings with this amenity earn $35,387 vs. $14,978 without it.
- High-opportunity amenities — Baby monitor, Piano, Baby bath — combine revenue uplift above 100% with prevalence under 10%, meaning most competitors haven't adopted them yet.
- Heating, Kitchen — while widespread — still correlate with meaningful revenue gains, making them table stakes rather than true differentiators.
Recommendations for Hosts
- Prioritize adding Baby monitor — it has the best combination of high revenue impact and low market saturation in Panama City Beach.
- Focus your upgrade budget on amenities in the top half of this table. Below-median amenities may improve guest experience but contribute less to revenue growth.
- Highlight revenue-impacting amenities prominently in your listing title, photos, and description — guests can't value what they don't notice.
Dive Deeper: Advanced Panama City Beach STR Market Data (2026)
Ready to unlock more insights? AirROI provides access to advanced metrics and comprehensive Airbnb data for Panama City Beach. Explore detailed analytics beyond this report to refine your investment strategy, optimize pricing, and maximize your vacation rental profits.
Explore Advanced MetricsPanama City Beach Airbnb Guest Demographics & Profile Analysis (2026)
Guest Profile Summary for Panama City Beach
- The typical guest profile for Airbnb in Panama City Beach consists of primarily domestic travelers (98%), often arriving from nearby Atlanta, typically belonging to the Post-2000s (Gen Z/Alpha) group (50%), primarily speaking English or Spanish.
- Domestic travelers account for 98.2% of guests.
- Key international markets include United States (98.2%) and Canada (0.4%).
- Top languages spoken are English (77.5%) followed by Spanish (13.4%).
- A significant demographic segment is the Post-2000s (Gen Z/Alpha) group, representing 50% of guests.
Recommendations for Hosts
- Target domestic marketing efforts towards travelers from Atlanta and Nashville.
- Tailor amenities and listing descriptions to appeal to the dominant Post-2000s (Gen Z/Alpha) demographic (e.g., highlight fast WiFi, smart home features, local guides).
- Highlight unique local experiences or amenities relevant to the primary guest profile.
- Consider seasonal promotions aligned with peak travel times for key origin markets.
What Are Airbnb Guest Ratings in Panama City Beach?
Listings in Panama City Beach average 4.73 out of 5 overall, with about 35.2 reviews per active listing and 30.5% of listings carrying the Guest Favorite badge.
Rating Breakdown by Category
Guest Rating Insights for Panama City Beach
- An average rating of 4.73 places Panama City Beach in solid territory. Most guests leave satisfied, though there is room for hosts to push toward the top tier.
- The strongest subcategory is Location (4.87), while Value (4.68) trails behind — a useful signal for hosts looking to prioritize upgrades.
- 30.5% of listings carry the Guest Favorite badge, a strong trust signal that can meaningfully lift click-through and booking rates.
Recommendations for Hosts
- Focus improvement efforts on Cleanliness — even small gains in the weakest subcategory can lift overall ratings and search ranking.
- Encourage guests to leave reviews after checkout. Listings with more reviews rank higher in search results and convert browsers into bookers more effectively.
Panama City Beach Airbnb Booking Patterns (2026): Available vs. Booked Days
Available Days Distribution
Booked Days Distribution
Booking Pattern Insights for Panama City Beach
- The most common availability pattern in Panama City Beach falls within the 271-366 days range, representing 59.1% of listings. This suggests many properties have significant open periods on their calendars.
- Approximately 88.1% of listings show high availability (181+ days open annually), indicating potential for increased bookings or specific owner usage patterns.
- For booked days, the 31-90 days range is most frequent in Panama City Beach (39.7%), reflecting common guest stay durations or potential owner blocking patterns.
- A notable 12.8% of properties secure long booking periods (181+ days booked per year), highlighting successful long-term rental strategies or significant owner usage.
How Far in Advance Do Guests Book Airbnb in Panama City Beach?
Average Booking Lead Time by Month
Booking Lead Time Insights for Panama City Beach
- The overall average booking lead time for vacation rentals in Panama City Beach is 60 days.
- Guests book furthest in advance for stays during February (average 81 days), likely coinciding with peak travel demand or local events.
- The shortest booking windows occur for stays in March (average 49 days), indicating more last-minute travel plans during this time.
- Seasonally, Winter (64 days avg.) sees the longest lead times, while Spring (56 days avg.) has the shortest, reflecting typical travel planning cycles.
Recommendations for Hosts
- Use the overall average lead time (60 days) as a baseline for your pricing and availability strategy in Panama City Beach.
- For February stays, consider implementing length-of-stay discounts or slightly higher rates for bookings made less than 81 days out to capitalize on advance planning.
- Target marketing efforts for the Winter season well in advance (at least 64 days) to capture early planners.
- Monitor your own booking lead times against these Panama City Beach averages to identify opportunities for dynamic pricing adjustments.
What Is the Average Length of Stay for Airbnb in Panama City Beach?
Guests in Panama City Beach stay about 5.2 nights on average, generating roughly 185,554 reservations and 17.9 bookings per listing in the latest AirROI dataset. The most common check-in time is 4:00 PM and check-out is 10:00 AM.
Monthly Length of Stay in Panama City Beach
Check-in Time Distribution
Check-out Time Distribution
Stay Pattern Insights for Panama City Beach
- A mid-range stay length points to leisure-driven demand — weekend getaways and short vacations. Hosts should optimize for quick turnover efficiency while keeping the guest experience smooth.
- 17.9 bookings per listing is a manageable pace that balances revenue with operational overhead.
- Stay lengths peak in Jan (10.8 nights) and shorten in May (4.2 nights). Adjust minimum-night requirements seasonally to match.
Recommendations for Hosts
- Leverage the longer-stay pattern by offering weekly discounts — even 5-10% off can convert browsing into bookings for guests considering an extended stay.
- Set your check-in time to match or beat the market standard of 4:00 PM. Offering early check-in flexibility can be a low-cost differentiator.
- Monitor length-of-stay seasonality to adjust minimum-night requirements — longer minimums during peak periods maximize revenue while shorter minimums fill gaps in shoulder seasons.
Panama City Beach Airbnb Minimum Stay Requirements Analysis
Distribution of Listings by Minimum Night Requirement
1 Night
673 listings
6.5% of total
2 Nights
1349 listings
13% of total
3 Nights
1045 listings
10.1% of total
4-6 Nights
634 listings
6.1% of total
7-29 Nights
185 listings
1.8% of total
30+ Nights
6455 listings
62.4% of total
Key Insights
- The most prevalent minimum stay requirement in Panama City Beach is 30+ Nights, adopted by 62.4% of listings. This highlights the market's preference for longer commitments.
- Very short stays (1-2 nights) are less common (19.5%), suggesting hosts prefer slightly longer bookings to optimize turnover.
- A significant segment (62.4%) caters to monthly stays (30+ nights) in Panama City Beach, pointing to opportunities in the extended-stay market.
Recommendations
- Align with the market by considering a 30+ Nights minimum stay, as 62.4% of Panama City Beach hosts use this setting.
- If feasible, allowing 1-night stays, especially midweek or during low season, could capture last-minute bookings, as only 6.5% currently do.
- Explore offering discounts for stays of 30+ nights to attract the 62.4% of the market seeking extended stays.
- Adjust minimum nights based on seasonality – potentially shorter during low season and longer during peak demand periods in Panama City Beach.
Panama City Beach Airbnb Cancellation Policy Trends Analysis (2026)
Super Strict 30 Days
1555 listings
15% of total
Limited
555 listings
5.4% of total
Super Strict 60 Days
309 listings
3% of total
Refundable
2 listings
0% of total
Non-refundable
1 listings
0% of total
Flexible
478 listings
4.6% of total
Moderate
1610 listings
15.6% of total
Firm
5036 listings
48.7% of total
Strict
791 listings
7.7% of total
Cancellation Policy Insights for Panama City Beach
- The prevailing Airbnb cancellation policy trend in Panama City Beach is Firm, used by 48.7% of listings.
- A majority (56.4%) of hosts in Panama City Beach utilize Firm or Strict policies, indicating a market where hosts prioritize booking security.
- Strict cancellation policies are quite rare (7.7%), potentially making listings with this policy less competitive unless justified by high demand or property type.
Recommendations for Hosts
- Consider adopting a Firm policy to align with the 48.7% market standard in Panama City Beach.
- Using a Strict policy might deter some guests, as only 7.7% of listings use it. Evaluate if potential revenue protection outweighs possible lower booking rates.
- Regularly review your cancellation policy against competitors and market demand shifts in Panama City Beach.
How Much Are Airbnb Cleaning Fees in Panama City Beach?
Cleaning fees in Panama City Beach are meaningful operating levers, not just pass-through charges. What matters most is how often hosts charge them, how high they run relative to market norms, and how large a share of gross revenue they consume.
Cleaning Fee Insights for Panama City Beach
- 97.3% of listings charge a cleaning fee, making it standard practice in Panama City Beach. Guests expect it and factor it into their booking decisions.
- The gap between the average ($329) and median ($275) cleaning fee indicates some high-end properties are pulling the average up considerably.
- Cleaning fees represent 16.3% of gross revenue on average — a significant line item that impacts total guest cost and competitiveness.
Recommendations for Hosts
- Price your cleaning fee competitively against the Panama City Beach median of $275. Fees significantly above market norms can deter bookings, especially for shorter stays.
- Consider whether bundling the cleaning fee into a slightly higher nightly rate might improve conversion, since many guests filter by total price and separate fees can feel punitive.
- Monitor competitor cleaning fees regularly. Airbnb's search algorithm factors in total price, so a well-calibrated cleaning fee can improve your listing's ranking.
What Do the Top Airbnb Listings in Panama City Beach Look Like?
Benchmark your potential! Explore examples of top-performing Airbnb properties in Panama City Beachbased on Trailing Twelve Month (TTM) revenue. Analyze their characteristics, revenue, occupancy rate, and ADR to understand what drives success in this market.
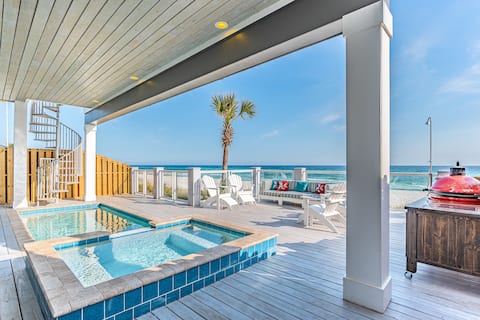
*NEW* LUX beach mansion Sleep 37 | Lap Pool & Golf
Entire Place • 9 bedrooms
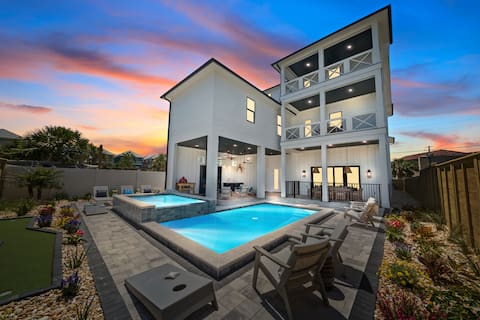
Hammerhead - Group Trip Goals Beachfront Vacation!
Entire Place • 9 bedrooms
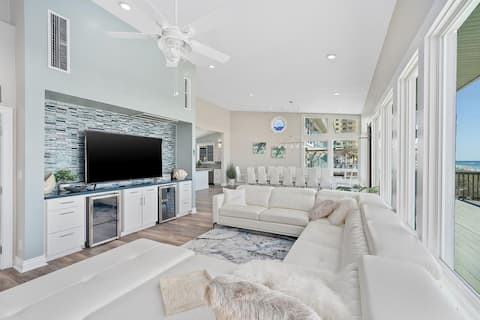
Coastal Haven - Perfect Vacation Home in PCB!
Entire Place • 9 bedrooms
Beachfront Bliss & Unmatched Gulf Views!
Entire Place • 6 bedrooms
Great White - Beachfront+pool, Family Vacation
Entire Place • 9 bedrooms
Surf Shack - Beachfront, Private Pool, + Game Room
Entire Place • 8 bedrooms
Note: Performance varies based on location, size, amenities, seasonality, and management quality. Data reflects the past 12 months.
Who Are the Top Airbnb Hosts in Panama City Beach?
Learn from the best! This table showcases top-performing Airbnb hosts in Panama City Beach based on the number of properties managed and estimated total revenue over the past year. Analyze their scale and performance metrics.
| Host Name | Properties | Grossing Revenue | Stay Reviews | Avg Rating |
|---|---|---|---|---|
| RealJoy Vacations | 547 | $18,171,632 | 9592 | 4.57/5.0 |
| Panhandle Getaways | 587 | $12,278,776 | 2342 | 4.61/5.0 |
| Southern Vacation Rentals | 431 | $10,724,210 | 1701 | 4.40/5.0 |
| Mitch | 169 | $8,468,314 | 1341 | 4.88/5.0 |
| David | 160 | $7,965,569 | 10282 | 4.72/5.0 |
| Holiday Beach Rentals | 38 | $5,980,690 | 473 | 4.83/5.0 |
| Kelly | 95 | $5,927,015 | 6205 | 4.84/5.0 |
| Cort Harwood | 69 | $5,691,098 | 2194 | 4.83/5.0 |
| Evolve | 143 | $5,034,069 | 5206 | 4.69/5.0 |
| Best Beach Getaways | 136 | $3,907,587 | 1029 | 4.67/5.0 |
Analyzing the strategies of top hosts, such as their property selection, pricing, and guest communication, can offer valuable lessons for optimizing your own Airbnb operations in Panama City Beach.
Who Are the Airbnb Hosts in Panama City Beach?
Panama City Beach leans more toward professional operations than casual hosting, which usually raises the competitive bar for new entrants.
Host Profile Insights for Panama City Beach
- A 42.0% Superhost share is healthy — enough experienced operators to anchor quality without making the market impenetrable for newcomers.
- 60.2% of listings are professionally managed, indicating a mature, competitive market with institutional players.
- 24.0% of listings have Instant Book enabled. Lower Instant Book adoption means many guests must request approval, which can slow conversions.
- 80.0% of listings use Airbnb's simplified pricing (host-only fee), where the host pays the entire platform service fee and the guest sees one all-in price with no separate Airbnb service charge. High adoption signals a professional, PMS-connected host base — Airbnb mandates simplified pricing for software-connected listings.
Recommendations for Hosts
- Earning Superhost status can significantly improve search ranking and guest trust. Focus on maintaining high response rates, low cancellations, and strong reviews.
- Consider enabling Instant Book — it reduces booking friction and Airbnb's algorithm tends to favor Instant Book listings in search results.
- With 18.7% cohosted listings, there may be a growing local market for property management services.
- Benchmark your host metrics against these Panama City Beach averages regularly and adjust your hosting strategy based on what top performers do differently.
Top Professional Management Companies in Panama City Beach
These are the highest-grossing professional property management operations in Panama City Beach, ranked by total revenue across their portfolio. Their performance metrics offer a benchmark for what institutional-level hosting looks like in this market.
| Company | Listings | Revenue | ADR | Occ. | Rating |
|---|---|---|---|---|---|
| RealJoy Vacations | 547 | $18,171,632 | $311 | 39.1% | 4.57/5 |
| Panhandle Getaways | 587 | $12,278,776 | $403 | 27.4% | 4.61/5 |
| Southern Vacation Rentals | 431 | $10,724,210 | $324 | 30.5% | 4.40/5 |
| Mitch | 169 | $8,468,314 | $587 | 36.4% | 4.88/5 |
| David | 160 | $7,965,569 | $383 | 42.6% | 4.72/5 |
| Holiday Beach Rentals | 38 | $5,980,690 | $1,496 | 36.1% | 4.83/5 |
| Kelly | 95 | $5,927,015 | $320 | 55.2% | 4.84/5 |
| Cort Harwood | 69 | $5,691,098 | $545 | 47.3% | 4.83/5 |
| Evolve | 143 | $5,034,069 | $285 | 48.6% | 4.69/5 |
| Best Beach Getaways | 136 | $3,907,587 | $334 | 38.1% | 4.67/5 |
Management Company Insights for Panama City Beach
- The leading management company, RealJoy Vacations, operates 547 listings with $18,171,632 in gross revenue — a useful benchmark for what scale looks like in Panama City Beach.
- Top managers average 238 properties each, pointing to a market where portfolio scale is a meaningful competitive factor.
- Professionally managed listings in the top tier average 4.7/5 in guest ratings — demonstrating that scale and quality can coexist.
Recommendations
- Study how top management companies price, position, and maintain their portfolios — their ADR and occupancy rates reflect strategies refined across dozens of listings.
- If you're considering hiring a property manager, compare their portfolio performance against these benchmarks before committing.
How Does Panama City Beach's Airbnb Market Compare to Nearby Cities?
How does the Panama City Beach Airbnb market stack up against its neighbors? Compare key performance metrics like average monthly revenue, ADR, and occupancy rates in surrounding areas to understand the broader regional STR landscape.
Compared with Seacrest, Panama City Beach has 8 percentage points lower occupancy and about $261 lower ADR. That helps frame whether this market is winning more on demand, pricing, or both.
| Market | Active Properties | Monthly Revenue | Daily Rate | Avg. Occupancy |
|---|---|---|---|---|
| Seacrest | 51 | $6,780 | $617.08 | 46% |
| Alys Beach | 448 | $6,460 | $740.20 | 39% |
| Seacrest Beach | 357 | $6,221 | $642.17 | 42% |
| Seaside | 698 | $6,084 | $847.74 | 34% |
| Rosemary Beach | 549 | $5,870 | $712.87 | 39% |
| Inlet Beach | 112 | $4,913 | $583.69 | 40% |
| Watersound | 132 | $4,741 | $542.02 | 40% |
| Walton County | 175 | $4,664 | $646.98 | 35% |
| Santa Rosa Beach | 3,512 | $4,633 | $582.94 | 37% |
| Saint George Island | 182 | $4,191 | $539.83 | 38% |
Frequently Asked Questions About Airbnb in Panama City Beach
These quick answers summarize the most common investor and operator questions using AirROI's latest market data for Panama City Beach.
How much do Airbnb hosts make in Panama City Beach?
Panama City Beach hosts earn about $34,199 per year on average, with an average nightly rate of $356 and RevPAR of $142. Those figures describe the typical revenue environment for active listings in Panama City Beach, Florida, not the ceiling for the best operators. Source: AirROI 2026 data, Panama City Beach market, July 2025 to June 2026.
What is the average Airbnb occupancy rate in Panama City Beach?
The average Airbnb occupancy rate in Panama City Beach is 38.0%. July is the strongest month and January is the softest, so hosts should expect demand to move meaningfully throughout the year rather than stay flat.
What is the average Airbnb daily rate in Panama City Beach?
Listings in Panama City Beach average $356 per night. The broader pricing spread also matters: lower-performing listings cluster closer to the lower quartiles, while premium homes can price materially above the city average when demand spikes or listing quality stands out.
How many Airbnb listings are active in Panama City Beach?
Panama City Beach currently has about 10,341 active Airbnb listings in AirROI's market dataset. That supply count helps explain how competitive the market is, how much depth there is for benchmarking, and whether the market behaves like a niche destination or a scaled urban market.
How strict are short-term rental regulations in Panama City Beach?
AirROI currently classifies the short-term rental regulation level in Panama City Beach as High. The dataset also shows about 67.1% of listings with registration evidence. That is a market signal, not legal advice, so hosts should still confirm current licensing and compliance rules locally before listing.
What is the RevPAR for Airbnb in Panama City Beach?
RevPAR in Panama City Beach is about $142. That metric combines pricing and occupancy into one efficiency number, so it is often a better quick benchmark than ADR alone when investors want to compare how well listings convert nightly rates into realized revenue.
Is Airbnb profitable in Panama City Beach?
Occupancy of 38.0% means Panama City Beach is a more selective market. Profitability is achievable but requires careful cost management, premium positioning, or targeting longer stays to reduce turnover. Average annual revenue is $34,199, but individual returns depend on property type, location within the city, and the host's operating efficiency.
How far in advance do guests book Airbnb in Panama City Beach?
The average booking lead time in Panama City Beach is about 60 days — a longer planning horizon typical of destination or vacation markets where travelers book well in advance. Hosts who understand their market's booking cadence can adjust minimum stays and pricing windows accordingly.
What are the best neighborhoods for Airbnb in Panama City Beach?
Based on AirROI's analysis, some of the top neighborhoods for short-term rentals in Panama City Beach include Panama City Beach, East Front Beach Road, Thomas Drive. Each area attracts different guest profiles — from business travelers to leisure visitors — so the best location depends on the property type and target audience a host is aiming for. See the full neighborhood breakdown above.
What type of property performs best on Airbnb in Panama City Beach?
entire_home listings make up 99.1% of the active supply in Panama City Beach. The most common configuration does not always mean the most profitable — operators who identify underserved property types or bedroom counts can sometimes outperform the market average by filling a gap in local supply.
How does Panama City Beach compare to nearby Airbnb markets?
Among neighboring markets, Seacrest posts $81,355 in average annual revenue with 46.3% occupancy, compared to Panama City Beach's $34,199 and 38.0%. Comparing nearby markets helps investors understand whether a destination's performance reflects local demand or broader regional trends.
What is the average length of stay in Panama City Beach?
The average Airbnb stay length in Panama City Beach is about 5.2 nights. That matters for turnover, cleaning operations, and pricing strategy because shorter stays increase changeovers while longer stays can smooth occupancy and reduce operational friction.
What is the average Airbnb guest rating in Panama City Beach?
Airbnb listings in Panama City Beach average 4.73 out of 5 overall. About 30.5% of listings carry the guest favorite badge, which suggests a meaningful share of inventory is competing on review quality rather than price alone.
Which amenities boost Airbnb revenue in Panama City Beach?
Heating and Baby monitor are among the strongest revenue-linked amenities in Panama City Beach. In AirROI's latest dataset, listings with these amenities outperform those without on average revenue, which makes amenities analysis useful for prioritizing investment and listing upgrades.
Do Airbnb hosts charge cleaning fees in Panama City Beach?
Yes. About 97.3% of active Airbnb listings in Panama City Beach charge a cleaning fee, and the average fee is $329. The more important operating benchmark is how much of gross revenue that fee consumes, not just the absolute dollar amount.
What percentage of Airbnb hosts are Superhosts in Panama City Beach?
A 42.0% Superhost rate signals a highly competitive market where review quality and responsiveness are table stakes, not differentiators.
About AirROI Market Data
AirROI tracks over 20 million properties across 190+ countries and maintains 15+ years of historical performance data, making it one of the deepest Airbnb and STR intelligence platforms available. The analytics pipeline aggregates listing-level data monthly — revenue, occupancy, nightly rates, RevPAR, guest demographics, booking patterns, and competitive supply — so investors and operators can benchmark any market against its own history and against neighboring destinations.
Real estate investors, property managers, financial institutions, hedge funds, tourism boards, hospitality consultants, tech platforms, and academic researchers rely on AirROI data to underwrite acquisitions, optimize pricing, model macro trends, and conduct peer-reviewed research. Data is available through in-depth market reports like this one and the Airbnb API with 22 endpoints and an Airbnb MCP Server for AI agents.
AirROI proprietary analytics as of 2026-06-30. Metrics reflect trailing twelve-month aggregates from active listings. Revenue figures are market averages, not projections. Neighborhood descriptions are AI-generated and reviewed for accuracy. For full methodology, see the data methodology page.