AirROI ranking · 2026213 markets ranked
Best Places to Buy an Airbnb in Florida (2026)
Clermont is the best place to buy an Airbnb in Florida in 2026, according to AirROI's ranking of 213 markets. Its listings averaged $58,800 in revenue over the 12 months to October 2026 and were booked on 52% of nights. It leads on the blend rather than on any one measure, placing in the top 5% of ranked markets for occupancy and the top 20% for revenue per listing and year-round demand. Key West and Jacksonville Beach come next.
- Markets tracked
- 478
- Active Airbnb listings
- 200,000
- Avg. revenue per listing
- $41,400
- Occupancy rate
- 43%
- Avg. nightly rate
- $345
- Revenue change, typical market
- +8%
The short answer
Florida Airbnb Market at a Glance
Across Florida, the 200,000 active Airbnb listings tracked by AirROI, a short-term-rental data firm, averaged $41,400 over the same period. They were booked on 43% of nights at about $345 a night; the ranking covers the 213 markets with at least 100 active listings. Revenue per listing rose in 163 of the 204 ranked markets with a comparable year of data, by 8% in the typical one.
The ranking weighs revenue per listing most, then occupancy and market size, then how evenly income spreads across the year and how it changed on the year. It reflects rental performance, not purchase prices or local short-term rental rules. How the ranking works.
Where the top 10 Airbnb markets in Florida are
Each dot is one of the 478 markets AirROI tracks in Florida, sized by active listings and coloured by average revenue per listing. Select a number to jump to its profile.
Top 10
The Top 10 Airbnb Markets in Florida
Each profile draws on the market's full AirROI report: how it earns, when in the year, who books and what sells. Monthly figures are averages per listing active in that month, so twelve of them add up to more than the annual average, which also counts listings that operated for only part of the year.
| # | Market | Avg. revenue | Occupancy |
|---|---|---|---|
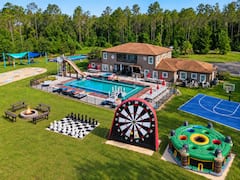 Clermont High occupancy · High earnings | $58,800 | 52% | |
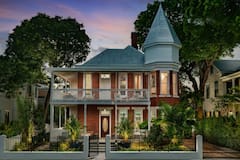 Key West High earnings · High occupancy | $97,100 | 47% | |
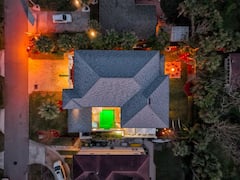 Jacksonville Beach High occupancy · High earnings | $55,500 | 48% | |
| 4 | 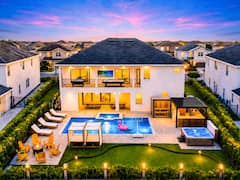 Kissimmee Large market · High occupancy | $41,300 | 48% |
| 5 |  Indian Rocks Beach High earnings · High occupancy | $73,100 | 48% |
| 6 |  Fort Lauderdale Large market · High occupancy | $53,400 | 46% |
| 7 |  Anna Maria Island High earnings · Growing revenue | $121,000 | 44% |
| 8 |  Delray Beach High occupancy · High earnings | $60,200 | 49% |
| 9 |  Four Corners Large market · Growing revenue | $42,500 | 44% |
| 10 |  Marathon High earnings · Large market | $69,200 | 43% |
1. Clermont
Known for: High occupancy · High earnings
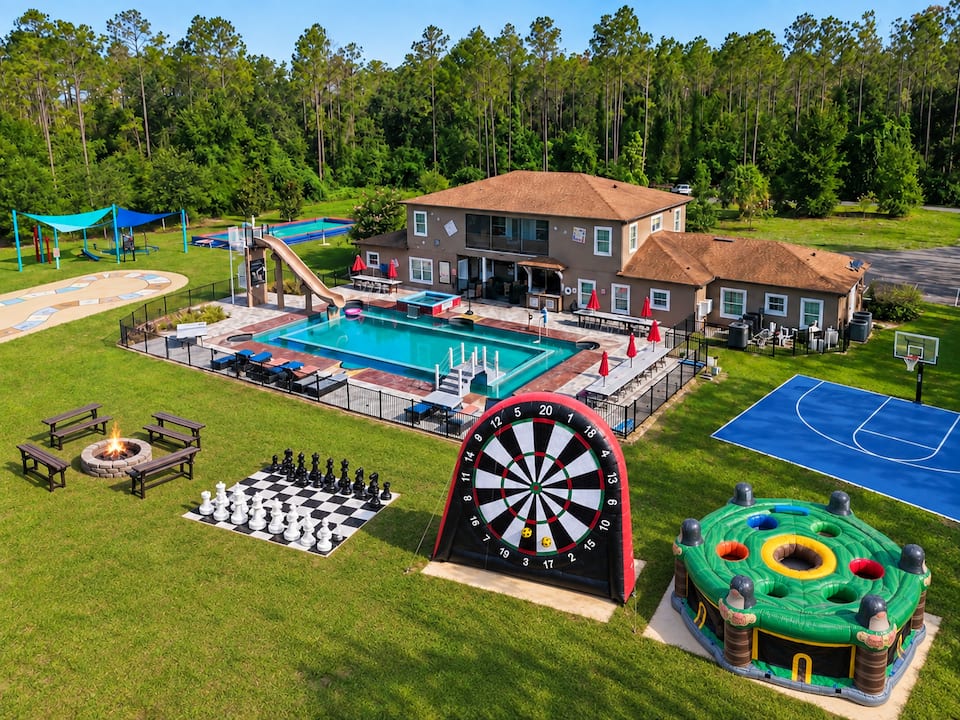
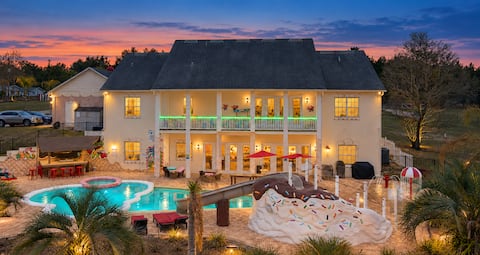
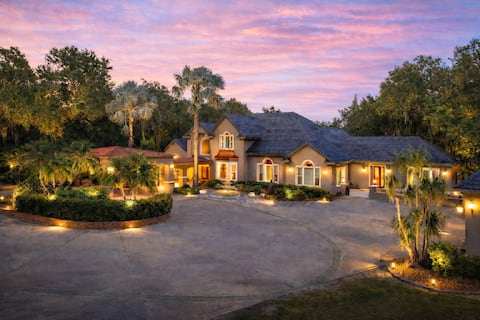
Top-earning Airbnb listings in Clermont - Avg. revenue
- $58,800
- Occupancy
- 52%
- Nightly rate
- $370
- Active listings
- 800
Where it places among the 213 ranked markets in Florida
- Revenue Top 12%
- Occupancy Top 2%
- Market size Top 25%
- Year-round Top 14%
- Growth No prior year
- How it earns
- Clermont fills more nights than most of Florida: 52% of them, the third-highest occupancy of the 213 ranked markets, at about $370 a night. That adds up to $58,800 per listing over the year, 42% above the Florida average. A typical listing takes in about $5,350 a month; the top quarter clear $9,400 or more.
- When it earns
- Clermont has two seasons, June–July and December–January. June is the strongest month at about $7,640 per listing, and September the quietest at about $4,120.
- What sells
- Big homes set the market: 86% of entire homes have three or more bedrooms, against about 47% in the typical market in Florida, and houses make up 93% of supply.
- Who it suits
- It suits buyers who want a large home for groups and families.
Revenue per listing by month
$7,640 $4,120- Median listing
- $5,350/mo
- Top 25% of listings
- $9,400+/mo
- Booked ahead
- 55 days
- Average stay
- 6 nights
- Most common home size
- 5+ bedrooms
- Superhosts
- 59%
Areas in the full report: Citrus Tower · Lake Louisa State Park · Historic Downtown Clermont
Full Clermont Airbnb report2. Key West
Known for: High earnings · High occupancy
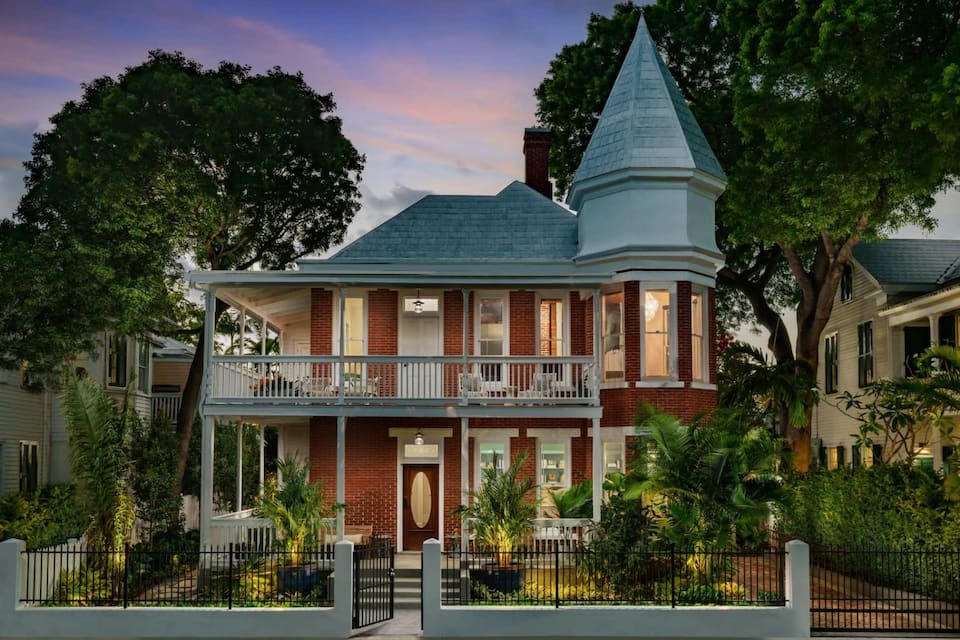
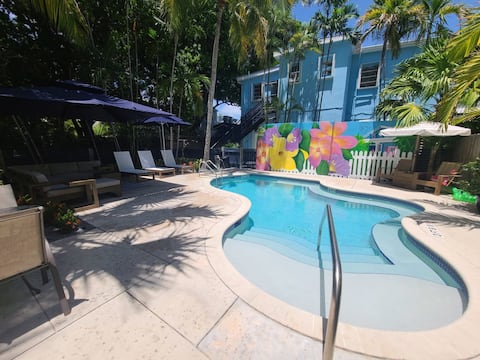
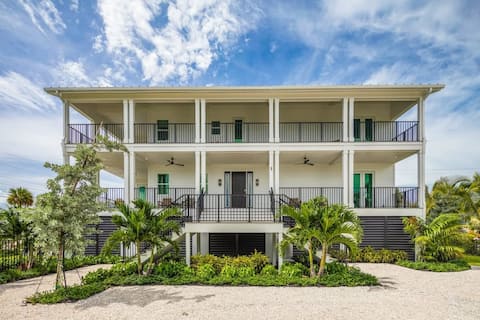
Top-earning Airbnb listings in Key West - Avg. revenue
- $97,100 +9% vs. last year
- Occupancy
- 47%
- Nightly rate
- $690
- Active listings
- 1,260
Where it places among the 213 ranked markets in Florida
- Revenue Top 1%
- Occupancy Top 9%
- Market size Top 16%
- Year-round Top 48%
- Growth Top 47%
- How it earns
- Key West commands premium rates, about $690 a night, and still books 47% of nights, 4 points above the Florida average. Listings averaged $97,100 in revenue over the year, the second-highest of the 213 ranked markets. In a typical month the median listing brings in about $8,750, and the best quarter clear $14,600. Revenue per listing rose 9% over the year, helped by nightly rates 9% higher.
- When it earns
- Key West's season runs from December to April, peaking in March at about $16,300 per listing; September, the quietest month, brings in about $6,330. Guests book early, about 87 days ahead against roughly 56 for the typical market in Florida, and stay about 7 nights.
- What sells
- Smaller places set the market: only 27% of entire homes have three or more bedrooms, against about 47% in the typical market in Florida; apartments and condos make up 42% of supply.
- The competition
- Professional managers run 45% of listings, against about 19% in the typical market in Florida, and the largest operator runs 87 listings, so new hosts compete with polished operations.
- Who it suits
- Best for buyers who can furnish and price for a premium stay and plan to use a professional manager or run a polished operation.
Revenue per listing by month
$16,300 $6,330- Median listing
- $8,750/mo
- Top 25% of listings
- $14,600+/mo
- Booked ahead
- 87 days
- Average stay
- 7 nights
- Most common home size
- 2 bedrooms
- Superhosts
- 67%
Areas in the full report: Duval Street · Old Town · Mallory Square
Full Key West Airbnb report3. Jacksonville Beach
Known for: High occupancy · High earnings
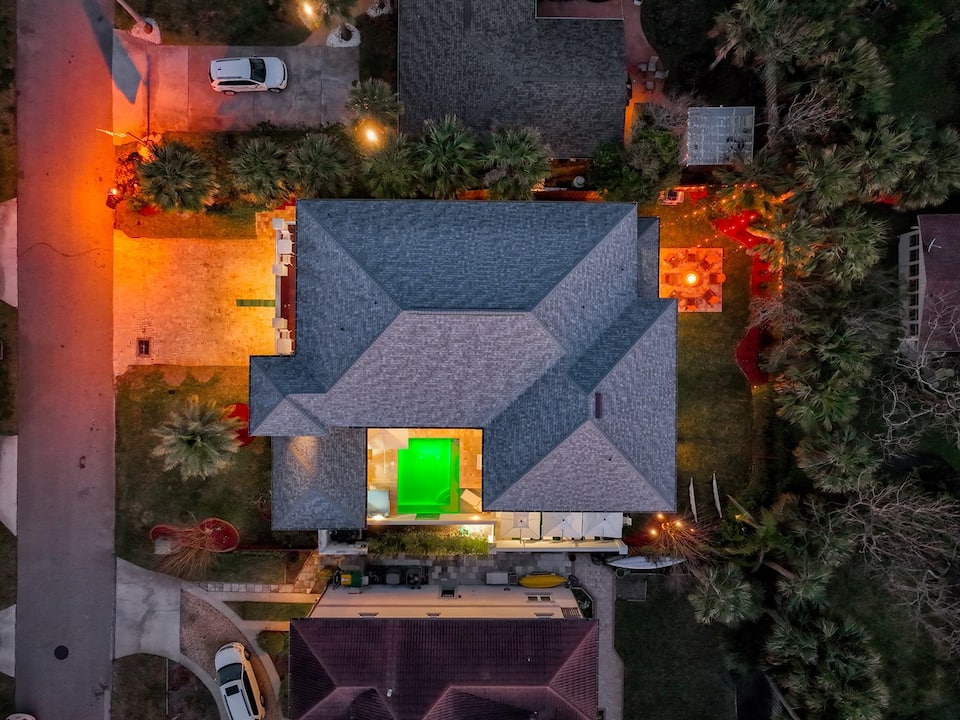


Top-earning Airbnb listings in Jacksonville Beach - Avg. revenue
- $55,500 +15% vs. last year
- Occupancy
- 48%
- Nightly rate
- $375
- Active listings
- 780
Where it places among the 213 ranked markets in Florida
- Revenue Top 15%
- Occupancy Top 8%
- Market size Top 26%
- Year-round Top 24%
- Growth Top 30%
- How it earns
- Listings in Jacksonville Beach are booked on 48% of nights, 5 points above the Florida average, at about $375 a night. Average revenue per listing came to $55,500, 34% above the Florida average. Month to month, the median listing earns about $4,370 and a top-quarter listing $7,220 or more. Revenue per listing rose 15% over the year, helped by nightly rates 16% higher.
- When it earns
- Revenue in Jacksonville Beach concentrates from March to July: July earns about $7,670 per listing, about twice as much as January.
- What sells
- The most common entire home has 2 bedrooms (31% of entire homes), and houses make up 66% of supply.
Revenue per listing by month
$7,670 $3,810- Median listing
- $4,370/mo
- Top 25% of listings
- $7,220+/mo
- Booked ahead
- 43 days
- Average stay
- 5 nights
- Most common home size
- 2 bedrooms
- Superhosts
- 73%
Areas in the full report: South Jacksonville Beach · Neptune Beach · Atlantic Beach
Full Jacksonville Beach Airbnb report4. Kissimmee
Known for: Large market · High occupancy
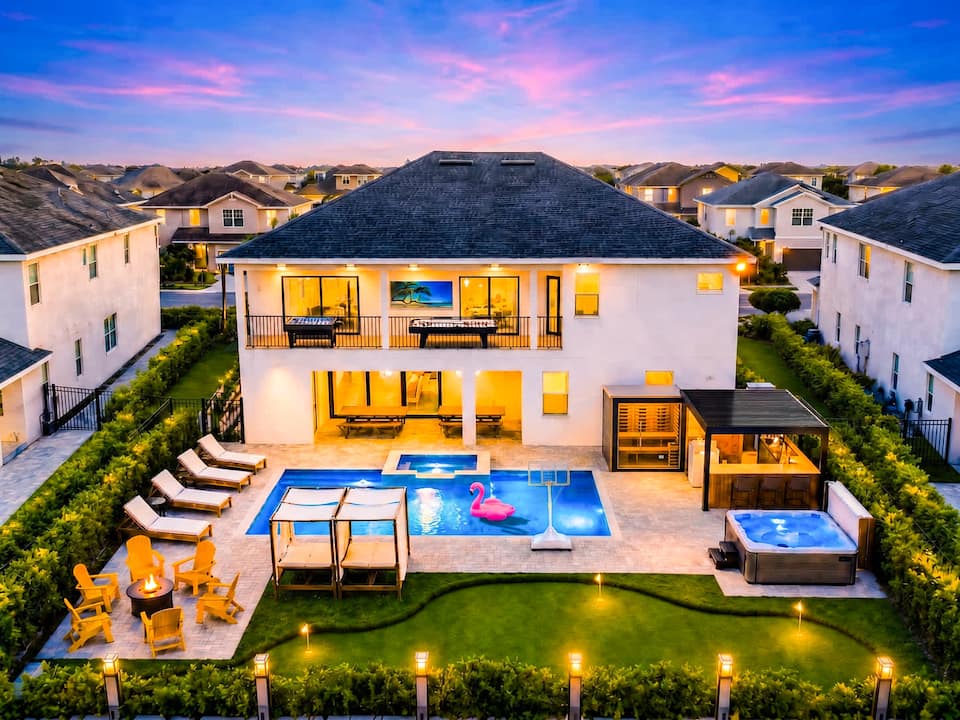
Top-earning Airbnb listings in Kissimmee - Avg. revenue
- $41,300 +15% vs. last year
- Occupancy
- 48%
- Nightly rate
- $300
- Active listings
- 11,000
Where it places among the 213 ranked markets in Florida
- Revenue Top 39%
- Occupancy Top 8%
- Market size Top 1%
- Year-round Top 8%
- Growth Top 31%
- How it earns
- Kissimmee earns on volume. Rates run below the Florida average at about $300 a night, but listings book 48% of nights. Revenue per listing, $41,300, is close to the Florida average. A typical listing takes in about $4,060 a month; the top quarter clear $6,420 or more. Revenue per listing rose 15% over the year, helped by nightly rates 18% higher, even as the number of listings grew 44%.
- When it earns
- Revenue in Kissimmee peaks twice, over February–April and again over June–July; July leads at about $5,580 per listing, while September brings in about $3,240.
- What sells
- Big homes set the market: 85% of entire homes have three or more bedrooms, against about 47% in the typical market in Florida, and houses make up 81% of supply.
- Guest expectations
- Average ratings (4.70 stars) trail the typical market in Florida (4.82), which leaves room for a well-run listing to stand out.
- Who it suits
- A good fit for buyers who want a large home for groups and families and would rather price for occupancy than for rate.
Revenue per listing by month
$5,580 $3,240- Median listing
- $4,060/mo
- Top 25% of listings
- $6,420+/mo
- Booked ahead
- 63 days
- Average stay
- 6 nights
- Guests from abroad
- 26%
- Most common home size
- 5+ bedrooms
Areas in the full report: Kissimmee Historic District · Lake Buena Vista · Reunion Village
Full Kissimmee Airbnb report5. Indian Rocks Beach
Known for: High earnings · High occupancy
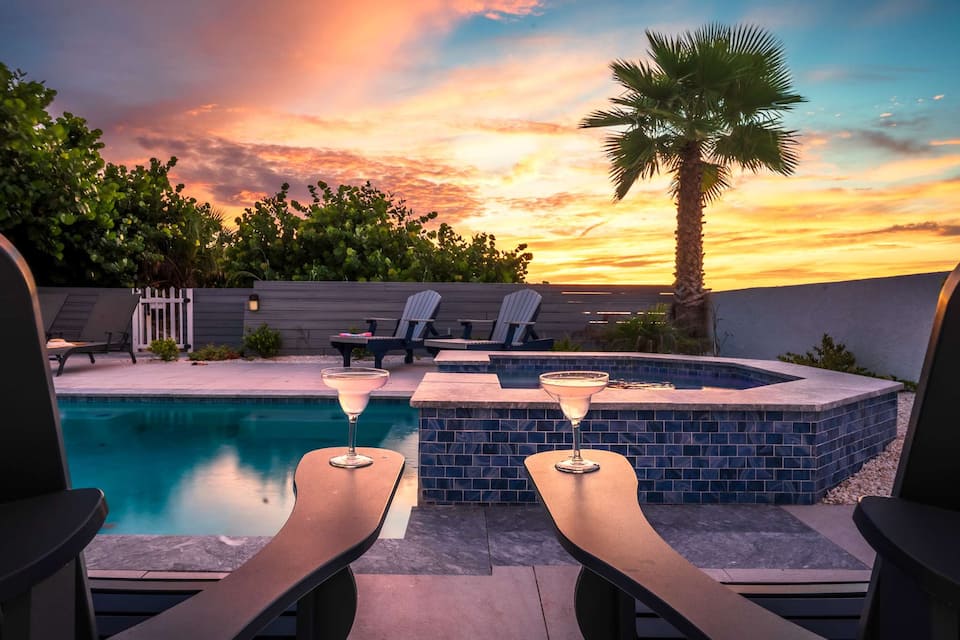

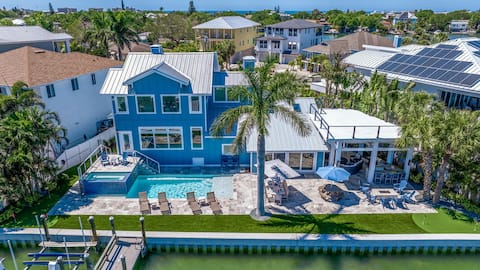
Top-earning Airbnb listings in Indian Rocks Beach - Avg. revenue
- $73,100 +14% vs. last year
- Occupancy
- 48%
- Nightly rate
- $470
- Active listings
- 1,030
Where it places among the 213 ranked markets in Florida
- Revenue Top 6%
- Occupancy Top 6%
- Market size Top 19%
- Year-round Bottom 35%
- Growth Top 33%
- How it earns
- Demand runs high in Indian Rocks Beach: 48% of nights booked, 5 points above the Florida average, at about $470 a night. Listings averaged $73,100 in revenue over the year, 77% above the Florida average. In a typical month the median listing brings in about $6,040, and the best quarter clear $10,200. Revenue per listing rose 14% over the year, helped by nightly rates 11% higher, even as the number of listings grew 24%.
- When it earns
- In Indian Rocks Beach, the months from February to July earn above the yearly average, led by March at about $13,100 per listing; September is the low point at about $4,570. Bookings arrive well in advance, about 76 days before check-in, so much of a season's calendar fills early; stays average 6 nights.
- The competition
- Professional managers run 43% of listings, against about 19% in the typical market in Florida, and the largest operator runs 80 listings, so new hosts compete with polished operations.
- What sells
- Two-bedroom homes lead the market (45% of entire homes), and apartments and condos make up 52% of supply.
- Who it suits
- It suits buyers who can ride out a slow September and plan to use a professional manager or run a polished operation.
Revenue per listing by month
$13,100 $4,570- Median listing
- $6,040/mo
- Top 25% of listings
- $10,200+/mo
- Booked ahead
- 76 days
- Average stay
- 6 nights
- Most common home size
- 2 bedrooms
- Superhosts
- 67%
Areas in the full report: Indian Rocks Beach · Indian Shores · Clearwater Beach
Full Indian Rocks Beach Airbnb report6. Fort Lauderdale
Known for: Large market · High occupancy
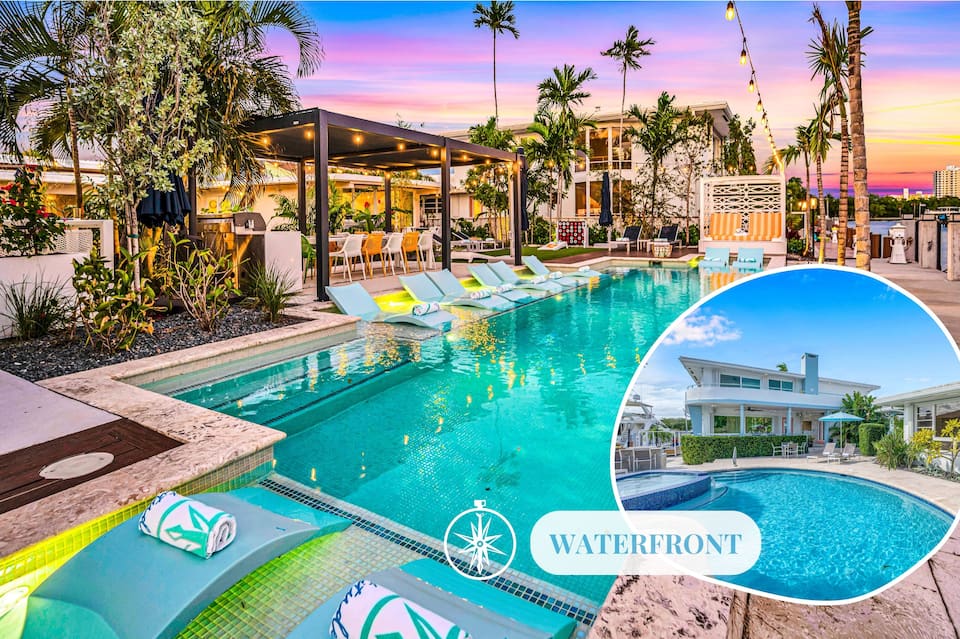
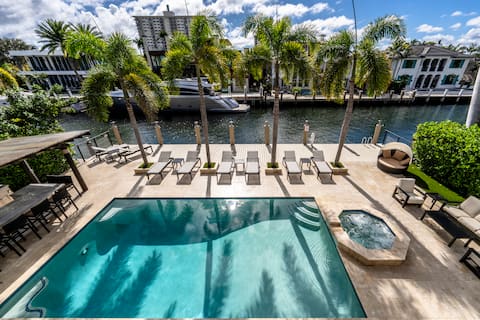

Top-earning Airbnb listings in Fort Lauderdale - Avg. revenue
- $53,400 +9% vs. last year
- Occupancy
- 46%
- Nightly rate
- $400
- Active listings
- 3,880
Where it places among the 213 ranked markets in Florida
- Revenue Top 17%
- Occupancy Top 16%
- Market size Top 7%
- Year-round Top 43%
- Growth Top 46%
- How it earns
- Fort Lauderdale books 46% of available nights, 3 points above the Florida average, and charges about $400 a night. Average revenue per listing came to $53,400, 29% above the Florida average. The gap between listings is wide: a typical one takes in about $3,920 a month, while the top quarter clear $7,510 and the top 10% $13,500, so pricing and presentation count for more here than in most of Florida. Revenue per listing rose 9% over the year, helped by nightly rates 13% higher.
- When it earns
- Fort Lauderdale has two seasons, December–April and June–July. March is the strongest month at about $8,830 per listing, and September the quietest at about $3,610. Guests book later than in most of Florida, about 41 days ahead against roughly 56 for the typical market in Florida; stays average 6 nights.
- Who books
- Most guests are domestic (81%), and Canada and Brazil send the most visitors from abroad.
- What sells
- The most common entire home has 1 bedroom (32% of entire homes), and houses make up 48% of supply.
- Who it suits
- Best for buyers who are comfortable adjusting prices close to the date.
Revenue per listing by month
$8,830 $3,610- Median listing
- $3,920/mo
- Top 25% of listings
- $7,510+/mo
- Booked ahead
- 41 days
- Average stay
- 6 nights
- Guests from abroad
- 19%
- Most common home size
- 1 bedroom
Areas in the full report: Las Olas Boulevard · Fort Lauderdale Beach · Victoria Park
Full Fort Lauderdale Airbnb report7. Anna Maria Island
Known for: High earnings · Growing revenue
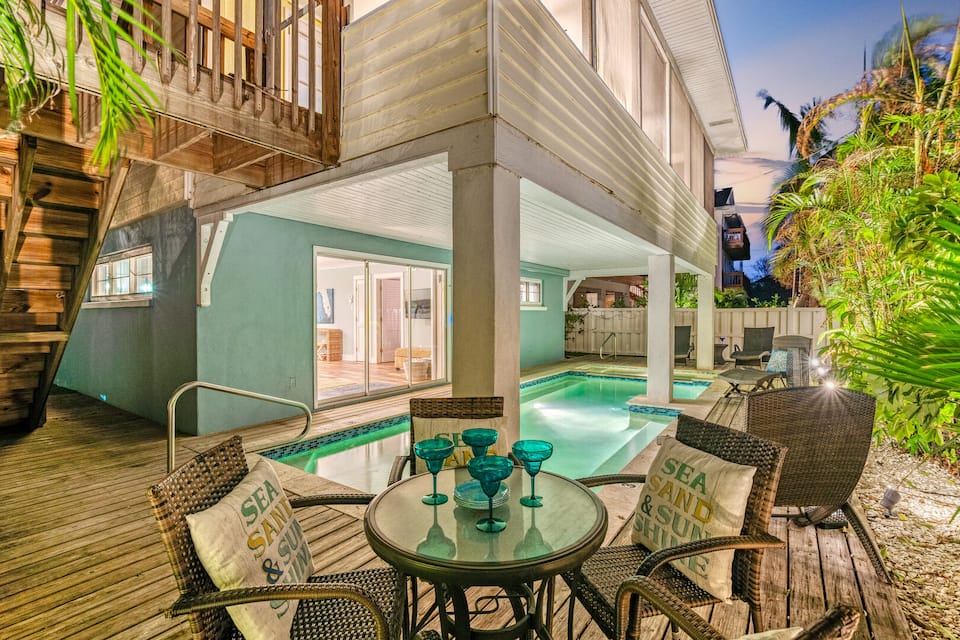

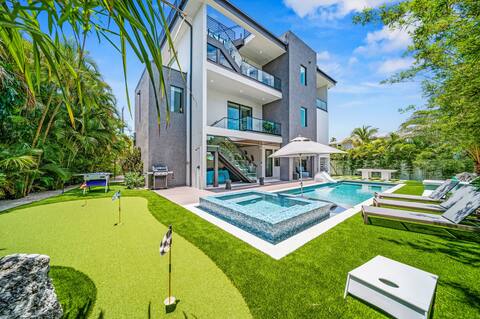
Top-earning Airbnb listings in Anna Maria Island - Avg. revenue
- $121,000 +42% vs. last year
- Occupancy
- 44%
- Nightly rate
- $940
- Active listings
- 553
Where it places among the 213 ranked markets in Florida
- Revenue Top 1%
- Occupancy Top 38%
- Market size Top 34%
- Year-round Bottom 51%
- Growth Top 2%
- How it earns
- Anna Maria Island earns on price: guests pay about $940 a night, about 2.7 times the Florida average. That adds up to $121,000 per listing over the year, the highest of the 213 ranked markets. Month to month, the median listing earns about $10,900 and a top-quarter listing $18,600 or more. Revenue per listing rose 42% over the year, helped by nightly rates 16% higher.
- When it earns
- Anna Maria Island's season runs from February to July, peaking in March at about $21,500 per listing; October, the quietest month, brings in about $8,150. Guests book early, about 101 days ahead against roughly 56 for the typical market in Florida, and stay about 6 nights.
- The competition
- Professional managers run 75% of listings, against about 19% in the typical market in Florida, and the largest operator runs 120 listings, so new hosts compete with polished operations.
- What sells
- Big homes set the market: 77% of entire homes have three or more bedrooms, against about 47% in the typical market in Florida, and houses make up 91% of supply.
- Who it suits
- A good fit for buyers who can furnish and price for a premium stay and plan to use a professional manager or run a polished operation.
Revenue per listing by month
$21,500 $8,150- Median listing
- $10,900/mo
- Top 25% of listings
- $18,600+/mo
- Booked ahead
- 101 days
- Average stay
- 6 nights
- Most common home size
- 3 bedrooms
- Superhosts
- 68%
Areas in the full report: Holmes Beach · Bradenton Beach · Anna Maria City
Full Anna Maria Island Airbnb report8. Delray Beach
Known for: High occupancy · High earnings
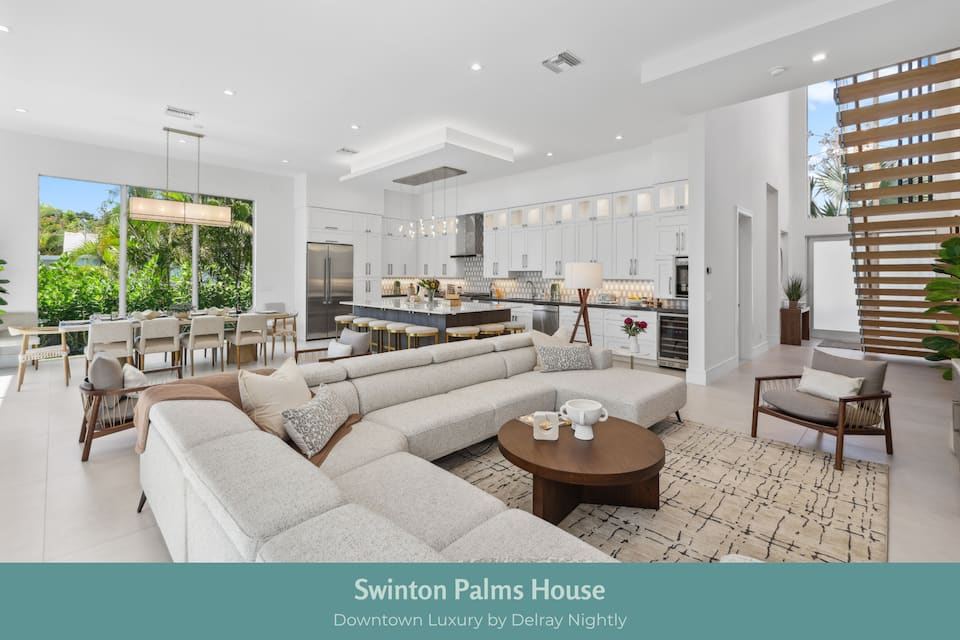
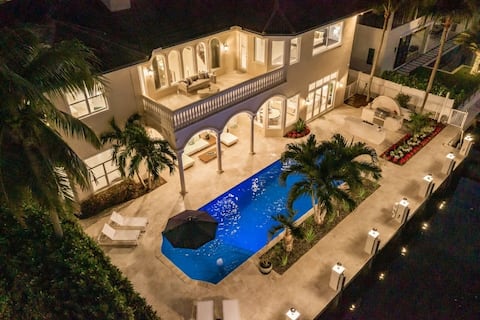

Top-earning Airbnb listings in Delray Beach - Avg. revenue
- $60,200 +15% vs. last year
- Occupancy
- 49%
- Nightly rate
- $430
- Active listings
- 749
Where it places among the 213 ranked markets in Florida
- Revenue Top 11%
- Occupancy Top 5%
- Market size Top 28%
- Year-round Bottom 29%
- Growth Top 27%
- How it earns
- Delray Beach fills more nights than most of Florida: 49% of them, the ninth-highest occupancy of the 213 ranked markets, at about $430 a night. Listings averaged $60,200 in revenue over the year, 45% above the Florida average. A typical listing takes in about $5,110 a month; the top quarter clear $9,140 or more. Revenue per listing rose 15% over the year, helped by nightly rates 12% higher, even as the number of listings grew 17%.
- When it earns
- Revenue in Delray Beach concentrates from December to April: March earns about $10,900 per listing, about three times as much as September. Trips run long, about 8 nights on average against 6 nights for the typical market in Florida, booked about 56 days ahead.
- What sells
- Two-bedroom homes lead the market (30% of entire homes), and houses make up 66% of supply.
- Who it suits
- It suits buyers who can carry costs through a quiet September.
- Registration
- Nearly all listings display a registration number, so confirm the local rules before buying.
Revenue per listing by month
$10,900 $3,700- Median listing
- $5,110/mo
- Top 25% of listings
- $9,140+/mo
- Booked ahead
- 56 days
- Average stay
- 8 nights
- Most common home size
- 2 bedrooms
- Superhosts
- 62%
Areas in the full report: Atlantic Avenue · Delray Beach Oceanfront · Pineapple Grove Arts District
Full Delray Beach Airbnb report9. Four Corners
Known for: Large market · Growing revenue
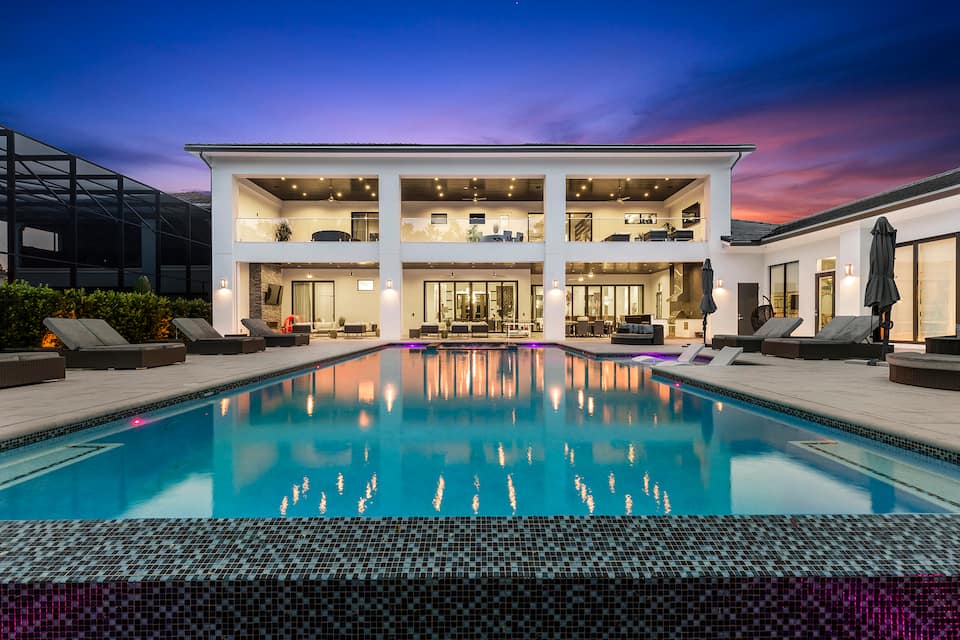

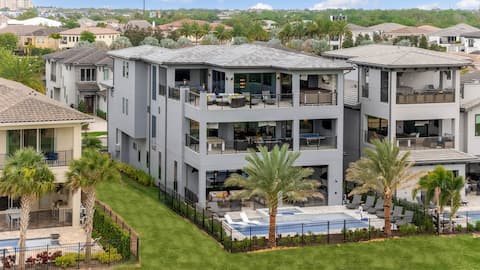
Top-earning Airbnb listings in Four Corners - Avg. revenue
- $42,500 +19% vs. last year
- Occupancy
- 44%
- Nightly rate
- $330
- Active listings
- 10,300
Where it places among the 213 ranked markets in Florida
- Revenue Top 36%
- Occupancy Top 31%
- Market size Top 2%
- Year-round Top 19%
- Growth Top 19%
- How it earns
- Four Corners is Florida's third-largest Airbnb market, with 10,300 active listings to price against. Revenue per listing, $42,500, is close to the Florida average. In a typical month the median listing brings in about $4,080, and the best quarter clear $6,510. Revenue per listing rose 19% over the year, helped by nightly rates 15% higher.
- When it earns
- Revenue in Four Corners peaks twice, over February–April and again over June–July; July leads at about $6,030 per listing, while September brings in about $3,130. Bookings arrive well in advance, about 83 days before check-in, so much of a season's calendar fills early; stays average 6 nights.
- What sells
- Big homes set the market: 92% of entire homes have three or more bedrooms, against about 47% in the typical market in Florida, and houses make up 85% of supply.
- Guest expectations
- Average ratings (4.71 stars) trail the typical market in Florida (4.82), which leaves room for a well-run listing to stand out.
- Who it suits
- Best for buyers who want a large home for groups and families and plan to use a professional manager or run a polished operation.
Revenue per listing by month
$6,030 $3,130- Median listing
- $4,080/mo
- Top 25% of listings
- $6,510+/mo
- Booked ahead
- 83 days
- Average stay
- 6 nights
- Guests from abroad
- 21%
- Most common home size
- 5+ bedrooms
Areas in the full report: Disney World Area · Kissimmee · Lake Buena Vista
Full Four Corners Airbnb report10. Marathon
Known for: High earnings · Large market
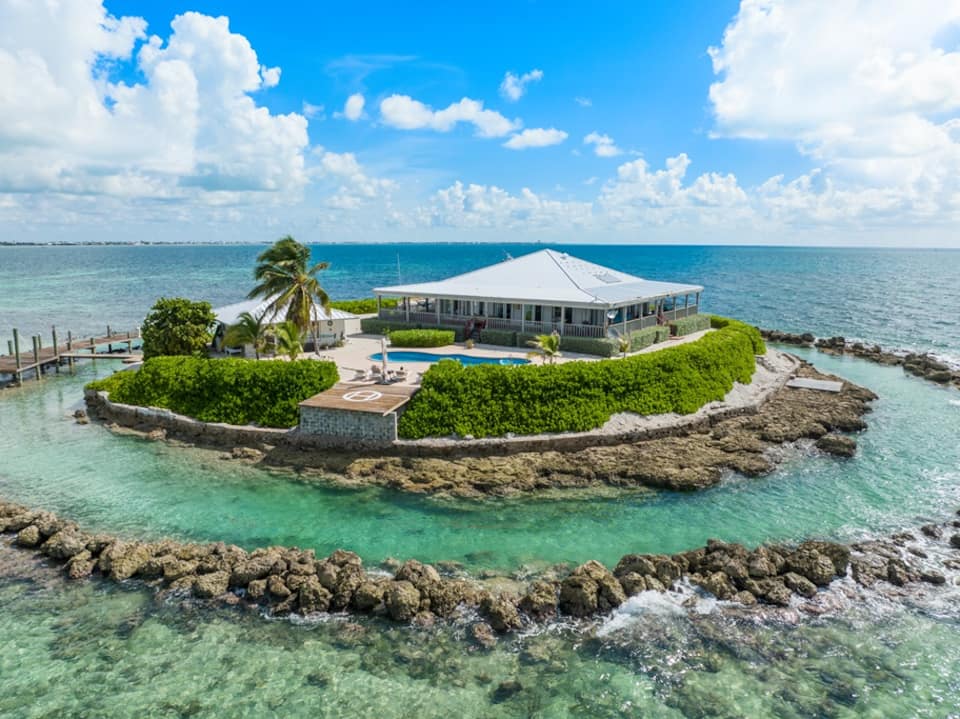
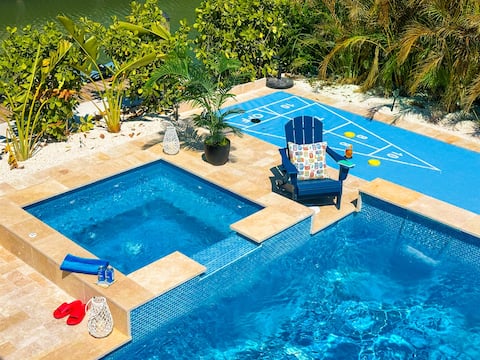

Top-earning Airbnb listings in Marathon - Avg. revenue
- $69,200 +19% vs. last year
- Occupancy
- 43%
- Nightly rate
- $555
- Active listings
- 1,100
Where it places among the 213 ranked markets in Florida
- Revenue Top 7%
- Occupancy Top 43%
- Market size Top 17%
- Year-round Bottom 51%
- Growth Top 18%
- How it earns
- Nightly rates set Marathon apart: about $555, 61% above the Florida average. That adds up to $69,200 per listing over the year, 67% above the Florida average. Month to month, the median listing earns about $6,230 and a top-quarter listing $10,900 or more. Revenue per listing rose 19% over the year, helped by nightly rates 9% higher, even as the number of listings grew 16%.
- When it earns
- Marathon has two seasons, January–April and June–July. March is the strongest month at about $11,900 per listing, and September the quietest at about $4,520. Guests book early, about 99 days ahead against roughly 56 for the typical market in Florida, and stay about 8 nights. Nearly eight in ten listings (78%) ask for a stay of a week or more.
- What sells
- The most common entire home has 3 bedrooms (28% of entire homes), and houses make up 79% of supply.
- Who it suits
- A good fit for buyers who can furnish and price for a premium stay and can ride out a slow September.
Revenue per listing by month
$11,900 $4,520- Median listing
- $6,230/mo
- Top 25% of listings
- $10,900+/mo
- Booked ahead
- 99 days
- Average stay
- 8 nights
- Most common home size
- 3 bedrooms
- Superhosts
- 48%
Areas in the full report: Key Colony Beach · Sombrero Beach · Marathon Key
Full Marathon Airbnb report
Full ranking
How the Top 100 Markets in Florida Compare
The overall ranking with the five measures behind it. "Slow month" is a market's weakest month of revenue as a share of its best, so a higher figure means steadier income. Select a column heading to re-sort.
| Clermont High occupancy, high earnings | $58,817 | 52% | $372 | 54% | – | 800 | |
| Key West High earnings, high occupancy | $97,084 | 47% | $691 | 39% | +9% | 1,261 | |
| Jacksonville Beach High occupancy, high earnings | $55,549 | 48% | $374 | 50% | +15% | 780 | |
| 4 | Kissimmee Large market, high occupancy | $41,272 | 48% | $298 | 58% | +15% | 10,968 |
| 5 | Indian Rocks Beach High earnings, high occupancy | $73,136 | 48% | $469 | 35% | +14% | 1,029 |
| 6 | Fort Lauderdale Large market, high occupancy | $53,433 | 46% | $400 | 41% | +9% | 3,878 |
| 7 | Anna Maria Island High earnings, growing revenue | $120,620 | 44% | $938 | 38% | +42% | 553 |
| 8 | Delray Beach High occupancy, high earnings | $60,160 | 49% | $429 | 34% | +15% | 749 |
| 9 | Four Corners Large market, growing revenue | $42,534 | 44% | $331 | 52% | +19% | 10,347 |
| 10 | Marathon High earnings, large market | $69,159 | 43% | $554 | 38% | +19% | 1,099 |
| 11 | Miami Large market, high occupancy | $42,190 | 46% | $328 | 51% | +9% | 9,434 |
| 12 | Jupiter High occupancy, high earnings | $54,249 | 49% | $371 | 38% | +19% | 324 |
| 13 | Cocoa Beach High occupancy, high earnings | $52,315 | 48% | $343 | 39% | +7% | 1,028 |
| 14 | Seminole High occupancy, high earnings | $57,108 | 49% | $374 | 35% | +9% | 572 |
| 15 | Orlando Large market, year-round demand | $33,052 | 46% | $251 | 65% | +14% | 4,752 |
| 16 | Hialeah Year-round demand, high occupancy | $42,592 | 46% | $294 | 56% | +18% | 432 |
| 17 | West Palm Beach Large market, high occupancy | $43,715 | 47% | $320 | 39% | +9% | 1,435 |
| 18 | Siesta Key High earnings, large market | $68,415 | 42% | $551 | 33% | +17% | 1,392 |
| 19 | St. Augustine Large market, high earnings | $44,267 | 44% | $348 | 47% | +11% | 1,906 |
| 20 | Vilano Beach High earnings, growing revenue | $81,198 | 45% | $500 | 40% | +21% | 152 |
| 21 | North Miami High earnings, year-round demand | $52,752 | 45% | $389 | 51% | +7% | 288 |
| 22 | Miami Beach Large market, high earnings | $50,773 | 42% | $409 | 42% | +6% | 4,529 |
| 23 | Largo High occupancy, large market | $49,178 | 49% | $328 | 36% | +5% | 875 |
| 24 | Wilton Manors High occupancy, high earnings | $48,085 | 47% | $328 | 38% | +13% | 467 |
| 25 | Davenport Large market, year-round demand | $35,829 | 43% | $297 | 55% | +19% | 4,001 |
| 26 | Bradenton Large market, high occupancy | $48,053 | 46% | $339 | 32% | +8% | 1,923 |
| 27 | Sarasota Large market, growing revenue | $43,465 | 44% | $341 | 35% | +18% | 3,614 |
| 28 | Key Colony Beach High earnings, high occupancy | $59,871 | 47% | $420 | 35% | +9% | 282 |
| 29 | Navarre Large market, high earnings | $52,635 | 45% | $410 | 22% | +15% | 1,389 |
| 30 | Fernandina Beach Growing revenue, large market | $50,161 | 41% | $458 | 40% | +23% | 1,075 |
| 31 | Boynton Beach High occupancy, high earnings | $49,325 | 49% | $347 | 38% | +5% | 329 |
| 32 | Clearwater Large market, high occupancy | $42,984 | 45% | $308 | 36% | +8% | 2,101 |
| 33 | Santa Rosa Beach Large market, high earnings | $67,622 | 40% | $613 | 25% | +20% | 3,609 |
| 34 | Deerfield Beach High occupancy, large market | $43,053 | 46% | $314 | 38% | +8% | 637 |
| 35 | Seacrest Beach High earnings, growing revenue | $86,874 | 44% | $672 | 19% | +16% | 341 |
| 36 | Ponte Vedra Beach High earnings, growing revenue | $78,350 | 43% | $633 | 40% | +15% | 188 |
| 37 | Holmes Beach Growing revenue, high earnings | $54,611 | 40% | $523 | 35% | +41% | 986 |
| 38 | Boca Raton High occupancy, growing revenue | $41,660 | 45% | $335 | 48% | +17% | 303 |
| 39 | Rosemary Beach High earnings, growing revenue | $81,591 | 41% | $746 | 22% | +26% | 555 |
| 40 | Belleair Beach High occupancy, high earnings | $62,639 | 54% | $367 | 38% | +11% | 109 |
| 41 | North Miami Beach High occupancy, growing revenue | $43,170 | 45% | $338 | 49% | +16% | 192 |
| 42 | Sunny Isles Beach Large market, growing revenue | $36,749 | 44% | $309 | 45% | +16% | 1,067 |
| 43 | North Bay Village High earnings, year-round demand | $84,230 | 43% | $653 | 63% | +10% | 104 |
| 44 | Plantation Year-round demand, high earnings | $62,245 | 41% | $544 | 61% | +21% | 128 |
| 45 | Indian Shores High occupancy, high earnings | $47,801 | 45% | $350 | 33% | +7% | 743 |
| 46 | Melbourne Beach High earnings | $71,251 | 43% | $535 | 37% | +5% | 289 |
| 47 | Aventura High earnings, high occupancy | $50,353 | 45% | $345 | 43% | −2% | 249 |
| 48 | Pompano Beach Large market | $41,222 | 42% | $323 | 41% | +10% | 1,433 |
| 49 | Bradenton Beach Growing revenue, high earnings | $56,869 | 39% | $529 | 36% | +26% | 471 |
| 50 | Palm Beach Gardens High occupancy, high earnings | $49,867 | 48% | $341 | 32% | +3% | 311 |
| 51 | Satellite Beach High occupancy, growing revenue | $47,686 | 54% | $286 | 36% | +26% | 110 |
| 52 | Oakland Park High occupancy | $40,638 | 47% | $299 | 41% | +4% | 341 |
| 53 | Captiva High earnings, growing revenue | $78,930 | 39% | $747 | 32% | +25% | 391 |
| 54 | Cudjoe Key High earnings, high occupancy | $56,802 | 45% | $414 | 36% | +2% | 190 |
| 55 | Celebration Year-round demand, growing revenue | $27,801 | 44% | $195 | 60% | +21% | 543 |
| 56 | Alys Beach High earnings, growing revenue | $85,901 | 40% | $778 | 21% | +15% | 451 |
| 57 | Destin Large market, high earnings | $53,497 | 40% | $495 | 21% | +14% | 4,479 |
| 58 | Fort Myers Beach Large market, high earnings | $48,492 | 40% | $417 | 28% | +16% | 1,401 |
| 59 | Madeira Beach Growing revenue, large market | $41,832 | 42% | $328 | 32% | +30% | 862 |
| 60 | Hollywood Large market | $39,839 | 42% | $336 | 41% | +4% | 3,921 |
| 61 | Key Biscayne High earnings, high occupancy | $66,798 | 45% | $539 | 35% | +13% | 107 |
| 62 | Riviera Beach Growing revenue, high earnings | $55,655 | 41% | $469 | 31% | +25% | 292 |
| 63 | Key Largo High earnings, large market | $50,981 | 41% | $424 | 35% | +3% | 874 |
| 64 | Sanibel Growing revenue, large market | $42,698 | 41% | $433 | 35% | +49% | 639 |
| 65 | Dania Beach Year-round demand, high occupancy | $34,945 | 45% | $273 | 52% | +10% | 252 |
| 66 | Watersound High earnings, growing revenue | $68,713 | 44% | $557 | 17% | +24% | 142 |
| 67 | Cutler Bay High occupancy, high earnings | $49,831 | 48% | $321 | 47% | −8% | 109 |
| 68 | Indian Harbour Beach High occupancy, high earnings | $49,588 | 47% | $311 | 36% | +10% | 122 |
| 69 | Lauderdale-by-the-Sea High earnings, high occupancy | $44,389 | 44% | $341 | 34% | +7% | 414 |
| 70 | Palm Coast Large market | $38,779 | 42% | $318 | 42% | +10% | 753 |
| 71 | Pensacola Large market, growing revenue | $34,107 | 44% | $281 | 30% | +14% | 2,588 |
| 72 | Englewood Growing revenue, large market | $32,410 | 44% | $272 | 35% | +38% | 697 |
| 73 | Tangelo Park Year-round demand, growing revenue | $28,530 | 43% | $266 | 66% | +16% | 440 |
| 74 | Seaside High earnings, growing revenue | $84,578 | 35% | $896 | 22% | +15% | 697 |
| 75 | Miramar Beach Large market, high earnings | $48,727 | 37% | $476 | 23% | +15% | 4,985 |
| 76 | Gulf Breeze Growing revenue, large market | $42,171 | 43% | $380 | 27% | +23% | 565 |
| 77 | Dunedin High occupancy | $38,950 | 50% | $259 | 30% | +8% | 266 |
| 78 | Fort Walton Beach Growing revenue, large market | $38,820 | 41% | $363 | 23% | +26% | 2,589 |
| 79 | Melbourne High occupancy, large market | $29,646 | 45% | $225 | 46% | +4% | 558 |
| 80 | Buenaventura Lakes High occupancy, year-round demand | $29,086 | 51% | $177 | 57% | +21% | 110 |
| 81 | Tampa Large market, year-round demand | $28,448 | 44% | $222 | 51% | −5% | 4,601 |
| 82 | Dr. Phillips High occupancy, year-round demand | $28,130 | 52% | $160 | 69% | +17% | 128 |
| 83 | Saint George Island High earnings, growing revenue | $63,303 | 42% | $563 | 27% | +11% | 202 |
| 84 | Port St. Joe High earnings, large market | $54,236 | 39% | $515 | 23% | +8% | 930 |
| 85 | Pensacola Beach High earnings, large market | $52,502 | 39% | $489 | 22% | +11% | 951 |
| 86 | Flagler Beach Growing revenue, high earnings | $45,225 | 39% | $380 | 44% | +29% | 201 |
| 87 | Manasota Key Growing revenue, high earnings | $44,453 | 42% | $347 | 34% | +44% | 207 |
| 88 | Treasure Island Large market, growing revenue | $40,598 | 41% | $341 | 32% | +14% | 1,122 |
| 89 | Miami Gardens Growing revenue, year-round demand | $37,927 | 40% | $299 | 54% | +23% | 252 |
| 90 | Cocoa High occupancy, year-round demand | $32,304 | 47% | $217 | 52% | +6% | 163 |
| 91 | Lake Worth Beach High occupancy | $32,255 | 47% | $253 | 37% | +6% | 414 |
| 92 | Winter Haven Growing revenue, year-round demand | $26,317 | 45% | $195 | 54% | +23% | 285 |
| 93 | Hernando Beach High occupancy, high earnings | $45,356 | 45% | $328 | 41% | −1% | 130 |
| 94 | Naples Large market, high earnings | $43,160 | 40% | $389 | 27% | +6% | 2,612 |
| 95 | Palm Harbor High occupancy | $40,897 | 46% | $295 | 34% | −1% | 308 |
| 96 | Panama City Beach Large market, growing revenue | $40,080 | 40% | $366 | 22% | +13% | 10,441 |
| 97 | Perdido Key Growing revenue, high earnings | $47,156 | 44% | $386 | 19% | +36% | 164 |
| 98 | Marco Island Large market, high earnings | $47,538 | 38% | $473 | 24% | +7% | 1,584 |
| 99 | Panama City Large market, growing revenue | $36,940 | 41% | $340 | 26% | +15% | 1,026 |
| 100 | Cape Canaveral High occupancy, large market | $28,647 | 45% | $233 | 38% | +4% | 706 |
By measure
Florida Airbnb Markets Ranked by Revenue, Nightly Rate and Occupancy
The overall ranking balances five measures. These lists take one at a time, for buyers who care most about income, pricing power, bookings, a steady calendar, momentum or market size.
Highest-earning Airbnb markets in Florida
Average annual revenue per active listing over the past 12 months. Markets with at least 200 listings.
| # | Market | Revenue |
|---|---|---|
| Anna Maria Island #7 overall | $121,000 | |
| Key West #2 overall | $97,100 | |
| Seacrest Beach #35 overall | $86,900 | |
| 4 | Alys Beach #56 overall | $85,900 |
| 5 | Seaside #74 overall | $84,600 |
| 6 | Rosemary Beach #39 overall | $81,600 |
| 7 | Captiva #53 overall | $78,900 |
| 8 | Indian Rocks Beach #5 overall | $73,100 |
| 9 | Melbourne Beach #46 overall | $71,300 |
| 10 | Marathon #10 overall | $69,200 |
| 11 | Siesta Key #18 overall | $68,400 |
| 12 | Santa Rosa Beach #33 overall | $67,600 |
| 13 | Walton County #111 overall | $67,100 |
| 14 | Saint George Island #83 overall | $63,300 |
| 15 | Delray Beach #8 overall | $60,200 |
| 16 | Key Colony Beach #28 overall | $59,900 |
| 17 | Clermont #1 overall | $58,800 |
| 18 | Seminole #14 overall | $57,100 |
| 19 | Bradenton Beach #49 overall | $56,900 |
| 20 | Riviera Beach #62 overall | $55,700 |
| 21 | Jacksonville Beach #3 overall | $55,500 |
| 22 | Holmes Beach #37 overall | $54,600 |
| 23 | Jupiter #12 overall | $54,200 |
| 24 | Port St. Joe #84 overall | $54,200 |
| 25 | Destin #57 overall | $53,500 |
Most expensive Airbnb markets in Florida by nightly rate
Average rate per booked night. A high rate earns most where occupancy holds up too. Markets with at least 200 listings.
| # | Market | Nightly |
|---|---|---|
| Anna Maria Island #7 overall | $940 | |
| Seaside #74 overall | $895 | |
| Alys Beach #56 overall | $780 | |
| 4 | Captiva #53 overall | $745 |
| 5 | Rosemary Beach #39 overall | $745 |
| 6 | Key West #2 overall | $690 |
| 7 | Islamorada #106 overall | $685 |
| 8 | Seacrest Beach #35 overall | $670 |
| 9 | Walton County #111 overall | $665 |
| 10 | Santa Rosa Beach #33 overall | $615 |
| 11 | Saint George Island #83 overall | $565 |
| 12 | Marathon #10 overall | $555 |
| 13 | Siesta Key #18 overall | $550 |
| 14 | Melbourne Beach #46 overall | $535 |
| 15 | Bradenton Beach #49 overall | $530 |
| 16 | Holmes Beach #37 overall | $525 |
| 17 | Port St. Joe #84 overall | $515 |
| 18 | Destin #57 overall | $495 |
| 19 | Escambia County #118 overall | $490 |
| 20 | Pensacola Beach #85 overall | $490 |
| 21 | Miramar Beach #75 overall | $475 |
| 22 | Marco Island #98 overall | $475 |
| 23 | Indian Rocks Beach #5 overall | $470 |
| 24 | Riviera Beach #62 overall | $470 |
| 25 | Fernandina Beach #30 overall | $460 |
Highest-occupancy Airbnb markets in Florida
Share of available nights booked over the past 12 months. Markets with at least 200 listings.
| # | Market | Occupancy |
|---|---|---|
| Clermont #1 overall | 52% | |
| Dunedin #77 overall | 50% | |
| Seminole #14 overall | 49% | |
| 4 | Boynton Beach #31 overall | 49% |
| 5 | Delray Beach #8 overall | 49% |
| 6 | Jupiter #12 overall | 49% |
| 7 | Largo #23 overall | 49% |
| 8 | Indian Rocks Beach #5 overall | 48% |
| 9 | Palm Beach Gardens #50 overall | 48% |
| 10 | Jacksonville Beach #3 overall | 48% |
| 11 | Kissimmee #4 overall | 48% |
| 12 | Cocoa Beach #13 overall | 48% |
| 13 | Key West #2 overall | 47% |
| 14 | Oakland Park #52 overall | 47% |
| 15 | Wilton Manors #24 overall | 47% |
| 16 | Key Colony Beach #28 overall | 47% |
| 17 | Lake Worth Beach #91 overall | 47% |
| 18 | West Palm Beach #17 overall | 47% |
| 19 | Deerfield Beach #34 overall | 46% |
| 20 | Hialeah #16 overall | 46% |
| 21 | Fort Lauderdale #6 overall | 46% |
| 22 | Orlando #15 overall | 46% |
| 23 | Miami #11 overall | 46% |
| 24 | Palm Harbor #95 overall | 46% |
| 25 | Bradenton #26 overall | 46% |
Most year-round Airbnb markets in Florida
Revenue in the slowest month as a share of the best month, so a higher figure means steadier income. Markets with at least 200 listings.
| # | Market | Slow month |
|---|---|---|
| Jacksonville #122 overall | 72% | |
| Tallahassee #163 overall | 70% | |
| Tangelo Park #73 overall | 66% | |
| 4 | Orlando #15 overall | 65% |
| 5 | Gainesville #121 overall | 65% |
| 6 | Celebration #55 overall | 60% |
| 7 | Kissimmee #4 overall | 58% |
| 8 | Doral #173 overall | 58% |
| 9 | Sanford #129 overall | 58% |
| 10 | Hialeah #16 overall | 56% |
| 11 | Davenport #25 overall | 55% |
| 12 | Brandon #142 overall | 55% |
| 13 | Clermont #1 overall | 54% |
| 14 | Winter Haven #92 overall | 54% |
| 15 | Miami Gardens #89 overall | 54% |
| 16 | Port Orange #109 overall | 54% |
| 17 | Mount Dora #104 overall | 54% |
| 18 | Four Corners #9 overall | 52% |
| 19 | Dania Beach #65 overall | 52% |
| 20 | Lutz #161 overall | 52% |
| 21 | Miami #11 overall | 51% |
| 22 | Tampa #81 overall | 51% |
| 23 | Ocala #151 overall | 51% |
| 24 | Lakeland #137 overall | 51% |
| 25 | Loughman #101 overall | 51% |
Fastest-growing Airbnb markets in Florida
Change in revenue per listing from the year before, among markets where it rose. Markets with at least 200 listings.
| # | Market | Change |
|---|---|---|
| Sanibel #64 overall | +49% | |
| Manasota Key #87 overall | +44% | |
| Anna Maria Island #7 overall | +42% | |
| 4 | Holmes Beach #37 overall | +41% |
| 5 | Englewood #72 overall | +38% |
| 6 | Madeira Beach #59 overall | +30% |
| 7 | Flagler Beach #86 overall | +29% |
| 8 | Bradenton Beach #49 overall | +26% |
| 9 | Loughman #101 overall | +26% |
| 10 | Fort Walton Beach #78 overall | +26% |
| 11 | Rosemary Beach #39 overall | +26% |
| 12 | Riviera Beach #62 overall | +25% |
| 13 | Captiva #53 overall | +25% |
| 14 | Gulf Breeze #76 overall | +23% |
| 15 | Winter Haven #92 overall | +23% |
| 16 | Miami Gardens #89 overall | +23% |
| 17 | Fernandina Beach #30 overall | +23% |
| 18 | Celebration #55 overall | +21% |
| 19 | Cedar Key #180 overall | +21% |
| 20 | Santa Rosa Beach #33 overall | +20% |
| 21 | Longboat Key #132 overall | +20% |
| 22 | Jupiter #12 overall | +19% |
| 23 | Davenport #25 overall | +19% |
| 24 | Marathon #10 overall | +19% |
| 25 | Four Corners #9 overall | +19% |
Largest Airbnb markets in Florida
Active listings. Bigger markets have more comparable rentals to price against and more buyers at resale.
| # | Market | Listings |
|---|---|---|
| Kissimmee #4 overall | 11,000 | |
| Panama City Beach #96 overall | 10,400 | |
| Four Corners #9 overall | 10,300 | |
| 4 | Miami #11 overall | 9,430 |
| 5 | Miramar Beach #75 overall | 4,990 |
| 6 | Orlando #15 overall | 4,750 |
| 7 | Tampa #81 overall | 4,600 |
| 8 | Miami Beach #22 overall | 4,530 |
| 9 | Destin #57 overall | 4,480 |
| 10 | Cape Coral #135 overall | 4,260 |
| 11 | Davenport #25 overall | 4,000 |
| 12 | Hollywood #60 overall | 3,920 |
| 13 | Fort Lauderdale #6 overall | 3,880 |
| 14 | Sarasota #27 overall | 3,610 |
| 15 | Santa Rosa Beach #33 overall | 3,610 |
| 16 | Naples #94 overall | 2,610 |
| 17 | Fort Walton Beach #78 overall | 2,590 |
| 18 | Pensacola #71 overall | 2,590 |
| 19 | Jacksonville #122 overall | 2,510 |
| 20 | Clearwater #32 overall | 2,100 |
| 21 | Bradenton #26 overall | 1,920 |
| 22 | St. Augustine #19 overall | 1,910 |
| 23 | New Smyrna Beach #139 overall | 1,730 |
| 24 | Daytona Beach #168 overall | 1,690 |
| 25 | Marco Island #98 overall | 1,580 |
Seasonality
When Airbnbs in Florida Earn the Most
March is the best month for nearly three-quarters of ranked markets in Florida. September is the most common slowest month, in 145 markets.
March earns about twice what September does
Average revenue per listing across the 213 ranked markets in Florida, by month
| Month | Avg. revenue per listing | Best month for | Highest-ranked examples |
|---|---|---|---|
| January | $4,190 | – | – |
| February | $5,500 | 6 markets | Boca Raton, Big Pine Key, Ocala |
| March | $6,650 | 157 markets | Key West, Indian Rocks Beach, Fort Lauderdale |
| April | $5,160 | – | – |
| May | $4,770 | – | – |
| June | $6,220 | 15 markets | Clermont, Orlando, Watersound |
| July | $6,460 | 33 markets | Jacksonville Beach, Kissimmee, Four Corners |
| August | $4,150 | – | – |
| September | $3,300 | – | – |
| October | $3,510 | 2 markets | Gainesville, Tallahassee |
| November | $3,380 | – | – |
| December | $4,190 | – | – |
Average revenue is per listing across the ranked markets, the line in the chart above. "Best month for" counts the ranked markets whose own revenue peaks in that month.
Named regions
Regions in Florida
These pages compare the towns of a region that people search by name, with figures for the region as a whole.
- Emerald Coast 20 towns
- 30A 7 towns
- Florida Keys 11 towns
- Anna Maria Island 3 towns
Management
Who Manages Airbnbs in Florida?
AirROI ranks the 50 largest of the 1,799 companies that run 5 or more Airbnb listings in Florida, by listings, guest rating and growth; companies run 39% of its listings.
Method
How the Ranking Works
The ranking covers the 213 markets in Florida with at least 100 active Airbnb listings and data through October 2026. Each market is compared with the others on five measures, and markets are ordered by a weighted blend of where they place on each:
- Revenue per listing (35%): average revenue an active listing earned over the past 12 months.
- Occupancy (20%): share of available nights that were booked.
- Market size (20%): active listings. Bigger markets offer more comparable rentals to price against and more buyers when you sell.
- Year-round demand (15%): revenue in the slowest month as a share of the best month. The latest month is left out when its bookings look incomplete.
- Growth (10%): change in revenue per listing from the year before. Markets whose boundaries changed between years are scored in the middle.
Left out: 51 markets whose data predate the latest refresh and 11 towns listed a second time under another spelling. The score measures how rentals perform. It does not include purchase prices, financing, operating costs or local short-term rental rules, which vary by address and should be checked before buying. Figures are in US dollars and match each market's own report; see the data methodology for how listings are tracked.
To check one property before buying, run its address and size through the Airbnb calculator for a revenue, occupancy and nightly-rate range from comparable listings.
FAQ
Frequently Asked Questions About Airbnb Investing in Florida
What is the best place to buy an Airbnb in Florida?
Clermont ranks first of the 213 markets in Florida in AirROI's ranking, with $58,800 in average revenue per listing and 52% occupancy. Key West and Jacksonville Beach follow. The ranking weighs revenue, occupancy, market size, seasonality and growth; it leaves out purchase prices.
What are the most profitable Airbnb locations in Florida?
By revenue per listing, among markets with at least 200 listings, Anna Maria Island leads at $121,000 a year, ahead of Key West at $97,100. Profit also depends on what a property costs to buy and run, which varies far more between markets than revenue does.
How much does an Airbnb make in Florida?
The average active listing in Florida earned $41,400 over the 12 months to October 2026, at 43% occupancy. Across the ranked markets, the middle half averaged between $25,000 and $48,100 per listing. Averages include listings that operated for only part of the year, so a listing rented all year typically earns more.
What is a good Airbnb occupancy rate in Florida?
The average listing in Florida was booked on 43% of available nights over the past 12 months. Half of the ranked markets fall between 40% and 45%, so a market above about 45% sits in the top quarter. Occupancy is only half the picture: a market with lower occupancy can still earn more if its nightly rates are higher.
Where is Airbnb demand highest in Florida?
Among ranked markets with at least 200 listings, Clermont has the highest occupancy, with 52% of available nights booked, followed by Dunedin at 50%. Its listings average about $370 a night and $58,800 a year.
Where are Airbnb nightly rates highest in Florida?
Among ranked markets with at least 200 listings, Anna Maria Island has the highest average nightly rate, about $940, followed by Seaside at $895. Lehigh Acres is the least expensive, at about $160. The average booked night in Florida costs about $345.
What is the best month for Airbnb in Florida?
March is the highest-earning month for 157 of the 213 ranked markets, followed by July (33). September is the most common slowest month, in 145 of the 213 markets. Each market's report shows its own month-by-month revenue, occupancy and rates.
Which Airbnb markets in Florida earn the most evenly through the year?
Among ranked markets with at least 200 listings, Jacksonville has the steadiest income: its slowest month, January, still earns about three-quarters of its best. Tallahassee follows, at 70%. Steadier markets are easier to budget for, though they do not always earn the most per listing.
Which Airbnb markets are growing fastest in Florida?
Among ranked markets with at least 200 listings, revenue per listing grew most in Sanibel, up 49% on the year before, and in Manasota Key, up 44%. A single strong year can reflect events or new supply, so it is worth checking a market's monthly trend before relying on it.
Is Airbnb still profitable in Florida in 2026?
Revenue per listing grew in 162 of the 204 ranked markets with a comparable year of data; in the typical market it rose 8%. Whether a given property profits depends on its purchase price, financing and running costs.
What are the best smaller Airbnb markets in Florida?
Among ranked markets with fewer than 300 active listings, Vilano Beach (#20 overall, $81,200 per listing), North Miami (#21, $52,800) and Key Colony Beach (#28, $59,900) place highest. Smaller markets have fewer comparable rentals to price against, so their averages can move more from year to year.
How many Airbnb listings are there in Florida?
AirROI tracked 200,000 active Airbnb listings in Florida over the 12 months to October 2026, across 478 markets. The largest ranked market is Kissimmee, with 11,000 listings, followed by Panama City Beach with 10,400.
Do Airbnb hosts need a permit in Florida?
Rules can come from the state as well as the city or county, and they change often, so check both for any address you consider. In the listing data, most listings display a registration number in 13 of the 213 ranked markets, including Delray Beach, Jupiter and West Palm Beach, though that shows what hosts display, not what the rules allow.
Directory
All 478 Airbnb Markets in Florida
Every Florida city with an AirROI Airbnb market report, A–Z, with its active listing count.
A
- Alachua 72 listings
- Alligator Point 62 listings
- Altamonte Springs 127 listings
- Alys Beach 451 listings
- Amelia Island 23 listings
- Anna Maria 127 listings
- Anna Maria Island 553 listings
- Apalachicola 93 listings
- Apollo Beach 155 listings
- Apopka 105 listings
- Arcadia 52 listings
- Astor 42 listings
- Atlantic Beach 24 listings
- Auburndale 67 listings
- Ave Maria 47 listings
- Aventura 249 listings
- Avon Park 55 listings
- Azalea Park 70 listings
B
- Babcock Ranch 21 listings
- Bal Harbour Village 37 listings
- Bartow 43 listings
- Bay Harbor Islands 94 listings
- Bayonet Point 23 listings
- Bell 18 listings
- Belleair Beach 109 listings
- Beverly Hills 21 listings
- Big Pine Key 118 listings
- Biscayne Park 40 listings
- Boca Grande 41 listings
- Boca Raton 303 listings
- Bokeelia 110 listings
- Bonita Springs 953 listings
- Boyette 18 listings
- Boynton Beach 329 listings
- Bradenton 1,923 listings
- Bradenton Beach 247 listings
- Brandenton Beach 471 listings
- Brandon 396 listings
- Branford 58 listings
- Brent 32 listings
- Brooksville 120 listings
- Buenaventura Lakes 110 listings
C
- Callaway 27 listings
- Campbell 21 listings
- Cantonment 20 listings
- Cape Canaveral 706 listings
- Cape Coral 4,260 listings
- Cape San Blas 71 listings
- Captiva 391 listings
- Carrabelle 191 listings
- Casselberry 57 listings
- Cedar Key 232 listings
- Celebration 543 listings
- Charlotte Harbor 30 listings
- Charlotte Park 19 listings
- Chiefland 20 listings
- Christmas 19 listings
- Citra 21 listings
- Citrus Park 75 listings
- Citrus Springs 27 listings
- Clair-Mel City 27 listings
- Clearwater 2,101 listings
- Clermont 800 listings
- Clewiston 79 listings
- Cocoa 163 listings
- Cocoa Beach 1,028 listings
- Coconut Creek 35 listings
- Conway 72 listings
- Cooper City 28 listings
- Coral Gables 150 listings
- Coral Springs 51 listings
- Cortez 30 listings
- Crawfordville 81 listings
- Crescent City 37 listings
- Crestview 60 listings
- Crystal River 358 listings
- Cudjoe Key 190 listings
- Cutler Bay 109 listings
- Cypress Lake 65 listings
D
- Dade City 69 listings
- Dania Beach 252 listings
- Davenport 4,001 listings
- Davie 79 listings
- Daytona Beach 1,688 listings
- Daytona Beach Shores 799 listings
- DeBary 29 listings
- Deep Creek 19 listings
- Deerfield Beach 637 listings
- DeFuniak Springs 31 listings
- DeLand 152 listings
- Delray Beach 749 listings
- Deltona 151 listings
- Destin 4,479 listings
- Doctor Phillips 46 listings
- Doral 450 listings
- Dr. Phillips 128 listings
- Duck Key 76 listings
- Dunedin 266 listings
- Dunnellon 247 listings
E
- East Lake-Orient Park 48 listings
- East Naples 298 listings
- Eastpoint 155 listings
- Edgewater 111 listings
- Edgewood 17 listings
- Egypt Lake-Leto 159 listings
- El Portal 44 listings
- Elfers 62 listings
- Ellenton 31 listings
- Englewood 697 listings
- Ensley 50 listings
- Escambia County 229 listings
- Estero 31 listings
- Eustis 53 listings
- Everglades City 56 listings
F
- Fairview Shores 41 listings
- Fernandina Beach 1,075 listings
- Ferry Pass 48 listings
- Flagler Beach 201 listings
- Floral City 38 listings
- Florida City 59 listings
- Florida Ridge 45 listings
- Fort Lauderdale 3,878 listings
- Fort McCoy 55 listings
- Fort Myers 885 listings
- Fort Myers Beach 1,401 listings
- Fort Myers Shores 25 listings
- Fort Pierce 524 listings
- Fort Walton Beach 2,589 listings
- Fort White 105 listings
- Four Corners 10,347 listings
- Freeport 42 listings
- Frostproof 23 listings
- Fruit Cove 22 listings
G
- Gainesville 1,030 listings
- Gateway 21 listings
- Georgetown 20 listings
- Gibsonton 22 listings
- Gifford 21 listings
- Glen Saint Mary 18 listings
- Goldenrod 25 listings
- Goodland 18 listings
- Goulds 18 listings
- Grant-Valkaria 24 listings
- Green Cove Springs 45 listings
- Greenacres 72 listings
- Grove City 26 listings
- Groveland 22 listings
- Gulf Breeze 565 listings
- Gulfport 82 listings
H
- Haile Plantation 22 listings
- Haines City 444 listings
- Hallandale Beach 1,028 listings
- Hallandale Beach City Center 336 listings
- Hammock Beach 186 listings
- Hawthorne 43 listings
- Hernando 58 listings
- Hernando Beach 130 listings
- Hialeah 432 listings
- High Springs 91 listings
- Hillsboro Beach 22 listings
- Hobe Sound 67 listings
- Holiday 134 listings
- Holly Hill 93 listings
- Hollywood 3,921 listings
- Holmes Beach 986 listings
- Homestead 206 listings
- Homosassa 162 listings
- Homosassa Springs 123 listings
- Hudson 236 listings
I
- Indialantic 63 listings
- Indian Harbour Beach 122 listings
- Indian Pass 33 listings
- Indian Rocks Beach 1,029 listings
- Indian Shores 743 listings
- Inglis 42 listings
- Inlet Beach 119 listings
- Interlachen 23 listings
- Inverness 156 listings
- Iona 213 listings
- Islamorada 373 listings
- Isles of Capri 26 listings
J
- Jacksonville 2,513 listings
- Jacksonville Beach 780 listings
- Jasmine Estates 81 listings
- Jensen Beach 418 listings
- Juno Beach 42 listings
- Jupiter 324 listings
K
- Keaton Beach 19 listings
- Kendall 60 listings
- Kenneth City 19 listings
- Key Biscayne 107 listings
- Key Colony Beach 282 listings
- Key Largo 874 listings
- Key West 1,261 listings
- Keystone Heights 36 listings
- Kissimmee 10,968 listings
L
- LaBelle 32 listings
- Lady Lake 47 listings
- Lake Alfred 22 listings
- Lake Buena Vista 176 listings
- Lake Butler 19 listings
- Lake City 69 listings
- Lake Clarke Shores 23 listings
- Lake Mary 46 listings
- Lake Panasoffkee 25 listings
- Lake Park 20 listings
- Lake Placid 211 listings
- Lake Wales 130 listings
- Lake Worth 94 listings
- Lake Worth Beach 414 listings
- Lakeland 625 listings
- Land O' Lakes 45 listings
- Lantana 113 listings
- Largo 875 listings
- Lauderdale Lakes 52 listings
- Lauderdale-by-the-Sea 414 listings
- Lauderhill 54 listings
- Laurel 135 listings
- Lecanto 20 listings
- Leesburg 107 listings
- Lehigh Acres 274 listings
- Lely 22 listings
- Lely Resort 94 listings
- Lighthouse Point 74 listings
- Little Torch Key 22 listings
- Live Oak 61 listings
- Longboat Key 311 listings
- Longwood 53 listings
- Loughman 291 listings
- Lower Grand Lagoon 20 listings
- Loxahatchee 35 listings
- Lutz 214 listings
- Lynn Haven 43 listings
M
- Madeira Beach 862 listings
- Maitland 18 listings
- Manasota Key 207 listings
- Marathon 1,099 listings
- Marco Island 1,584 listings
- Margate 72 listings
- Marianna 22 listings
- Mary Esther 103 listings
- Matlacha 86 listings
- Mayo 19 listings
- Meadow Woods 55 listings
- Melbourne 558 listings
- Melbourne Beach 289 listings
- Melrose 47 listings
- Merritt Island 285 listings
- Mexico Beach 376 listings
- Miami 9,434 listings
- Miami Beach 4,529 listings
- Miami Gardens 252 listings
- Miami Lakes 23 listings
- Miami Shores 83 listings
- Miami Springs 86 listings
- Micanopy 25 listings
- Middleburg 41 listings
- Milton 154 listings
- Minneola 22 listings
- Miramar 137 listings
- Miramar Beach 4,985 listings
- Monticello 39 listings
- Moore Haven 32 listings
- Morriston 29 listings
- Mount Dora 239 listings
- Mulberry 22 listings
- Mullis City 21 listings
N
- Naples 2,612 listings
- Naples Manor 18 listings
- Nassau County 36 listings
- Navarre 1,389 listings
- Neptune Beach 39 listings
- New Port Richey 188 listings
- New Smyrna Beach 1,733 listings
- Newberry 39 listings
- Niceville 74 listings
- Nokomis 122 listings
- North Bay Village 104 listings
- North Fort Myers 140 listings
- North Lauderdale 51 listings
- North Miami 288 listings
- North Miami Beach 192 listings
- North Palm Beach 81 listings
- North Port 461 listings
- North Redington Beach 81 listings
- North River Shores 19 listings
O
- O'Brien 18 listings
- Oak Hill 22 listings
- Oak Ridge 44 listings
- Oakland Park 341 listings
- Ocala 926 listings
- Ocklawaha 33 listings
- Ocoee 52 listings
- Odessa 53 listings
- Okaloosa Island 24 listings
- Okeechobee 136 listings
- Old Town 43 listings
- Oldsmar 53 listings
- Opa-locka 29 listings
- Orange City 38 listings
- Orange County 34 listings
- Orange Park 93 listings
- Orlando 4,752 listings
- Orlovista 26 listings
- Ormond Beach 554 listings
- Osceola County 129 listings
- Osprey 42 listings
- Oviedo 63 listings
- Ozona 24 listings
P
- Pace 33 listings
- Palatka 60 listings
- Palm Bay 310 listings
- Palm Beach 151 listings
- Palm Beach Gardens 311 listings
- Palm Beach Shores 87 listings
- Palm City 51 listings
- Palm Coast 753 listings
- Palm Harbor 308 listings
- Palm Springs 51 listings
- Palmetto 137 listings
- Palmetto Bay 28 listings
- Panacea 92 listings
- Panama City 1,026 listings
- Panama City Beach 10,441 listings
- Parker 23 listings
- Parkland 20 listings
- Pelican Bay 70 listings
- Pembroke Park 19 listings
- Pembroke Pines 167 listings
- Pensacola 2,588 listings
- Pensacola Beach 951 listings
- Perdido Key 164 listings
- Perry 31 listings
- Pinellas Park 188 listings
- Placida 87 listings
- Plant City 83 listings
- Plantation 128 listings
- Poinciana 56 listings
- Polk County 62 listings
- Pompano Beach 1,433 listings
- Ponce Inlet 84 listings
- Ponte Vedra Beach 188 listings
- Port Charlotte 833 listings
- Port Orange 244 listings
- Port Richey 104 listings
- Port Saint Joe 261 listings
- Port Saint Lucie 379 listings
- Port Salerno 53 listings
- Port St. Joe 930 listings
- Port St. Lucie 385 listings
- Princeton 40 listings
- Punta Gorda 513 listings
- Punta Rassa 68 listings
Q
- Quincy 24 listings
R
- Rainbow Springs 26 listings
- Reddick 40 listings
- Redington Beach 75 listings
- Redington Shores 225 listings
- Rio Pinar 66 listings
- River Ranch 38 listings
- Riverview 137 listings
- Riviera Beach 292 listings
- Rockledge 71 listings
- Rosemary Beach 555 listings
- Rotonda 244 listings
- Rotonda West 185 listings
- Royal Palm Beach 53 listings
- Ruskin 224 listings
S
- Safety Harbor 110 listings
- Sailfish Point 22 listings
- Saint Augustine 1,552 listings
- Saint Augustine Beach 742 listings
- Saint Augustine Shores 22 listings
- Saint Augustine South 40 listings
- Saint Cloud 64 listings
- Saint George Island 202 listings
- Saint James City 116 listings
- Saint Pete Beach 522 listings
- Saint Petersburg 1,359 listings
- Salt Springs 54 listings
- San Carlos Park 94 listings
- Sanford 238 listings
- Sanibel 639 listings
- Santa Rosa Beach 3,609 listings
- Sarasota 3,614 listings
- Satellite Beach 110 listings
- Satsuma 39 listings
- Seacrest 58 listings
- Seacrest Beach 341 listings
- Seaside 697 listings
- Sebastian 218 listings
- Sebring 262 listings
- Seffner 53 listings
- Seminole 572 listings
- Shalimar 25 listings
- Siesta Key 1,392 listings
- Silver Springs 22 listings
- Sky Lake 68 listings
- South Bradenton 113 listings
- South Daytona 79 listings
- South Miami 66 listings
- South Pasadena 18 listings
- South Patrick Shores 48 listings
- South Venice 263 listings
- Southchase 18 listings
- Southwest Ranches 34 listings
- Spring Hill 476 listings
- St Petersburg 248 listings
- St. Augustine 1,906 listings
- St. Augustine Beach 49 listings
- St. Cloud 59 listings
- St. James City 38 listings
- St. Johns County 34 listings
- St. Pete Beach 122 listings
- St. Petersburg 473 listings
- Steinhatchee 174 listings
- Stock Island 97 listings
- Stuart 318 listings
- Summerfield 35 listings
- Summerland Key 67 listings
- Sumterville 47 listings
- Sunny Isles Beach 1,067 listings
- Sunrise 168 listings
- Surfside 47 listings
- Sylvan Shores 19 listings
T
- Tallahassee 1,187 listings
- Tamarac 40 listings
- Tampa 4,601 listings
- Tangelo Park 440 listings
- Tarpon Springs 192 listings
- Tavares 64 listings
- Tavernier 308 listings
- Temple Terrace 83 listings
- Tequesta 51 listings
- The Colony Golf & Bay Club 20 listings
- The Villages 779 listings
- Thonotosassa 30 listings
- Tierra Verde 35 listings
- Titusville 163 listings
- Treasure Island 1,122 listings
U
- Umatilla 28 listings
- Union Park 76 listings
- University 19 listings
- Upper Grand Lagoon 168 listings
V
- Valrico 38 listings
- Venice 459 listings
- Venice Gardens 69 listings
- Vernon 18 listings
- Vero Beach 449 listings
- Vilano Beach 152 listings
- Villas 45 listings
- Virginia Gardens 18 listings
W
- Walton County 201 listings
- Watersound 142 listings
- Wedgefield 20 listings
- Weeki Wachee 51 listings
- Weirsdale 24 listings
- Welaka 41 listings
- Wellington 193 listings
- Wesley Chapel 147 listings
- West Melbourne 40 listings
- West Miami 17 listings
- West Palm Beach 1,435 listings
- West Park 66 listings
- Weston 32 listings
- Whiskey Creek 20 listings
- Wildwood 154 listings
- Williamsburg 36 listings
- Williston 60 listings
- Wilton Manors 467 listings
- Wimauma 29 listings
- Windermere 18 listings
- Winding Cypress 37 listings
- Winter Garden 147 listings
- Winter Haven 285 listings
- Winter Park 132 listings
Y
- Yulee 41 listings
Z
- Zephyrhills 168 listings