Miami Shores, Florida Airbnb Market Data 2026: STR Report & Statistics
How much can you earn on Airbnb in Miami Shores, Florida? Based on AirROI's 2026 dataset (July 2025 �– June 2026), the short answer is $58,026 per year — at a $421 nightly rate, 47.7% occupancy, and a $199 RevPAR that reflects moderate rate-to-revenue efficiency with room to optimize.
At 83 active listings, Miami Shores is a boutique market where moderate demand with room for well-positioned listings to outperform. Supply grew 5.1% over the past year, yet revenue and nightly rates both trended upward — a signal that traveler demand is outpacing new inventory rather than being diluted by it. For hosts, pricing power remains intact even as competition increases.
Regulation is high, and hosts should factor licensing costs and compliance timelines into their launch plan. In a market this size, differentiated listings with strong reviews can capture outsized returns relative to the competition.

Table of Contents [hide] [show]
What Are the Key Airbnb Metrics in Miami Shores?
In Miami Shores, the headline Airbnb metrics are $58,026 in average annual revenue,47.7% occupancy, $421 ADR, and $199 in RevPAR, and guests book about 46 days in advance.
How Much Do Airbnb Hosts Earn Monthly in Miami Shores?
Understanding the monthly revenue variations for Airbnb listings in Miami Shores is key to maximizing your short term rental income potential. Seasonality significantly impacts earnings. Our analysis, based on data from the past 12 months, shows that the peak revenue month for STRs in Miami Shores is typically March, while November often presents the lowest earnings, highlighting opportunities for strategic pricing adjustments during shoulder and low seasons. Explore the typical Airbnb income in Miami Shores across different performance tiers:
- Best-in-class properties (Top 10%) achieve $14,319+ monthly, often utilizing dynamic pricing and superior guest experiences.
- Strong performing properties (Top 25%) earn $7,293 or more, indicating effective management and desirable locations/amenities.
- Typical properties (Median) generate around $4,126 per month, representing the average market performance.
- Entry-level properties (Bottom 25%) see earnings around $2,057, often with potential for optimization.
Average Monthly Airbnb Earnings Trend in Miami Shores
What Is the Monthly Airbnb Occupancy Rate in Miami Shores?
Maximize your bookings by understanding the Miami Shores STR occupancy trends. Seasonal demand shifts significantly influence how often properties are booked. Typically, Marchsees the highest demand (peak season occupancy), while November experiences the lowest (low season). Effective strategies, like adjusting minimum stays or offering promotions, can boost occupancy during slower periods. Here's how different property tiers perform in Miami Shores:
- Best-in-class properties (Top 10%) achieve 82%+ occupancy, indicating high desirability and potentially optimized availability.
- Strong performing properties (Top 25%) maintain 70% or higher occupancy, suggesting good market fit and guest satisfaction.
- Typical properties (Median) have an occupancy rate around 52%.
- Entry-level properties (Bottom 25%) average 30% occupancy, potentially facing higher vacancy.
Average Monthly Occupancy Rate Trend in Miami Shores
What Is the Average Airbnb Nightly Rate in Miami Shores?
Effective short term rental pricing strategy in Miami Shores involves understanding monthly ADR fluctuations. The Average Daily Rate (ADR) for Airbnb in Miami Shores typically peaks in June and dips lowest during September. Leveraging Airbnb dynamic pricing tools or strategies based on this seasonality can significantly boost revenue. Here's a look at the typical nightly rates achieved:
- Best-in-class properties (Top 10%) command rates of $1,198+ per night, often due to premium features or locations.
- Strong performing properties (Top 25%) achieve nightly rates of $528 or more.
- Typical properties (Median) charge around $274 per night.
- Entry-level properties (Bottom 25%) earn around $155 per night.
Average Daily Rate (ADR) Trend by Month in Miami Shores
What Is the RevPAR for Airbnb in Miami Shores?
RevPAR in Miami Shores is currently $199. Because RevPAR combines nightly rates with realized occupancy, it is one of the cleanest ways to compare how efficiently listings turn demand into revenue across the market.
- Entry-level properties (Bottom 25%) see $66 RevPAR.
- Typical properties (Median) generate $129 RevPAR.
- Strong performers (Top 25%) earn $216 RevPAR.
- Best-in-class (Top 10%) achieve $437 RevPAR.
Average Monthly RevPAR Trend in Miami Shores
RevPAR Insights for Miami Shores
- The average RevPAR in Miami Shores is $199. This metric combines nightly rates with realized occupancy, making it one of the best single-number indicators of market efficiency.
- The gap between the top 10% ($437) and bottom 25% ($66) is $371, indicating significant performance disparity driven by property quality, pricing strategy, and location.
- RevPAR peaks in Mar and bottoms out in Nov, mirroring the broader seasonal demand pattern and suggesting opportunities for dynamic pricing.
Recommendations for Hosts
- Track your own RevPAR monthly against these Miami Shores benchmarks. If your RevPAR falls below the median of $129, examine whether low occupancy or low ADR is the primary drag.
- Top-quartile listings achieve $216+ RevPAR through a combination of competitive pricing, strong reviews, and strategic amenities. Target this tier through incremental improvements.
- Use RevPAR rather than revenue alone when comparing properties of different sizes — it normalizes for available nights and gives a more accurate picture of performance.
Get Live Miami Shores Market Intelligence 👇
Explore Real-time Analytics
When Is the Peak Season for Airbnb in Miami Shores?
Miami Shores's peak Airbnb season falls in March, April, June, while the softest stretch is August, September, November. Overall, the market shows highly seasonal trends requiring careful strategy, which should guide pricing, minimum stays, and cash-flow planning.
Peak Season (March, April, June)
- Revenue averages $8,707 per month
- Occupancy rates average 54.2%
- Daily rates average $555
Shoulder Season
- Revenue averages $6,713 per month
- Occupancy maintains around 51.1%
- Daily rates hold near $511
Low Season (August, September, November)
- Revenue drops to average $4,586 per month
- Occupancy decreases to average 43.1%
- Daily rates adjust to average $467
Seasonality Insights for Miami Shores
- Airbnb seasonality in Miami Shores is pronounced. Revenue swings sharply between peak and low months, which means pricing strategy, minimum-stay settings, and cash reserves all need to account for extended slower periods.
- During the high season, the absolute peak month showcases Miami Shores's highest earning potential, with monthly revenues climbing to $9,587, occupancy reaching 62.0%, and ADRs peaking at $604.
- Conversely, the slowest single month marks the market's lowest point — revenue may dip to $4,388, occupancy could drop to 41.5%, and ADRs may adjust to $454.
- Understanding both the seasonal averages and these monthly peaks and troughs in revenue, occupancy, and ADR is crucial for maximizing your Airbnb profit potential in Miami Shores.
Seasonal Strategies for Maximizing Profit
- Peak Season: Maximize revenue through premium pricing. In a high-regulation market like Miami Shores, ensure your permit covers the number of nights you plan to book — some jurisdictions cap annual rental days.
- Low Season: Offer competitive pricing, extended-stay discounts, and flexible cancellation policies. Target off-season travelers like remote workers, budget-conscious guests, and travelers with flexible schedules.
- Shoulder Seasons: Implement dynamic pricing that bridges peak and low rates. Target weekend travelers, local events, and business visitors. Slightly more flexible terms than peak season can help maintain occupancy without deep discounting.
- In a highly seasonal market like Miami Shores, building a cash reserve during the top months is essential for covering fixed costs during the slow period. Automated pricing tools can help capture demand shifts in real time.
Do You Need a License for Airbnb in Miami Shores?
Yes, Miami Shores, Florida, United States enforces high STR regulations and 60% of active listings show registration evidence — indicating that enforcement is active and compliance is a prerequisite for operating legally. Hosts entering this market should budget for permit fees, inspections, and potential occupancy tax obligations as part of their startup costs. Always verify the latest short-term rental regulations and Airbnb license requirements directly with local government authorities for Miami Shores to ensure full compliance before hosting.
(Source: AirROI data, 2026, based on 60% licensed listings)
What Are the Best Neighborhoods for Airbnb in Miami Shores?
Miami Shores is a smaller vacation rental market where a handful of neighborhoods drive most of the booking activity. Choosing the right area is especially important in boutique markets — there is less room for a mediocre location to succeed on volume alone. The areas below highlight where short-term rental demand is strongest and why.
| Neighborhood / Area | Why Host Here? (Target Guests & Appeal) | Key Attractions & Landmarks |
|---|---|---|
| Miami Shores | A charming suburban community known for its lush green landscapes and family-friendly atmosphere. This area is popular with both tourists and locals seeking a peaceful getaway while being close to Miami's vibrant attractions. | Miami Shores Country Club, Biscayne Bay, Arch Creek Park, MiMo Historic District, Shops at Bal Harbour |
| North Miami Beach | An up-and-coming area with a mix of cultures and a diverse dining scene. It attracts families and tourists looking for budget-friendly stays without compromising on access to beaches and city life. | Haulover Park, Oleta River State Park, Aventura Mall, Sunny Isles Beach, Greynolds Park |
| Aventura | A luxury neighborhood known for shopping and dining. Aventura Mall is one of the biggest shopping centers in the US, drawing visitors for high-end retail and entertainment. | Aventura Mall, Founders Park, Gulfstream Park Racing and Casino, Waterways Park, Biscayne Boulevard |
| Sunny Isles Beach | A beautiful beach destination with high-rise hotels and family-friendly resorts. Ideal for tourists looking to enjoy the sun and beach activities. | Sunny Isles Beach, Newport Fishing Pier, Oleta River State Park, Intracoastal Mall, Heritage Park |
| Downtown Miami | The bustling urban core of Miami with attractions, nightlife, and cultural venues. Great for urban explorers wanting to experience Miami's vibrant city life. | Bayside Marketplace, Frost Museum of Science, Pérez Art Museum Miami, Miami Heat games at FTX Arena, Donna E. Shalala Student Center |
| Coconut Grove | Known for its historic homes, lush greenery, and artsy vibe. Attracts tourists looking for a laid-back yet sophisticated atmosphere. | Vizcaya Museum and Gardens, CocoWalk, Coconut Grove Arts Festival, Barnacle Historic State Park, Bayshore Drive |
| Coral Gables | Renowned for its Mediterranean-style architecture and upscale shopping. Ideal for those looking for elegance and beauty in an urban setting. | Miracle Mile, Venetian Pool, Fairchild Tropical Botanic Garden, Coral Gables Museum, Biltmore Hotel |
| South Beach | Iconic Miami Beach neighborhood known for its Art Deco architecture and vibrant nightlife. Prime location for tourists seeking the quintessential Miami experience with direct beach access and endless entertainment options. | Art Deco Historic District, Ocean Drive, Lummus Park Beach, Lincoln Road Mall, Española Way, Miami Beach Boardwalk |
Because Miami Shores has a high regulation profile, confirming that short-term rental permits are available in your target neighborhood is a critical first step before committing to a property purchase. Regulation can vary at the neighborhood or district level even within the same city.
What Types of Properties Are on Airbnb in Miami Shores?
Room Type Distribution
Property Type Distribution
Market Composition Insights for Miami Shores
- The Miami Shores Airbnb market composition is heavily skewed towards Entire Home/Apt listings, which make up 85.5% of the 83 active rentals. This indicates strong guest preference for privacy and space.
- Looking at the property type distribution in Miami Shores, House properties are the most common (78.3%), reflecting the local real estate landscape.
- Houses represent a significant 78.3% portion, catering likely to families or larger groups.
- Smaller segments like hotel/boutique, others (combined 8.4%) offer potential for unique stay experiences.
Miami Shores Airbnb Room Capacity Analysis (2026): Bedroom Distribution
Distribution of Listings by Number of Bedrooms
Room Capacity Insights for Miami Shores
- The dominant room capacity in Miami Shores is 1 bedroom listings, making up 26.5% of the market. This suggests a strong demand for properties suitable for couples or solo travelers.
- Together, 1 bedroom and 3 bedrooms properties represent 45.8% of the active Airbnb listings in Miami Shores, indicating a high concentration in these sizes.
- A significant 43.4% of listings offer 3+ bedrooms, catering to larger groups and families seeking more space in Miami Shores.
Miami Shores Vacation Rental Guest Capacity Trends (2026)
Distribution of Listings by Guest Capacity
Guest Capacity Insights for Miami Shores
- The most common guest capacity trend in Miami Shores vacation rentals is listings accommodating 8+ guests (27.7%). This suggests the primary traveler segment is likely larger groups.
- Properties designed for 8+ guests and 6 guests dominate the Miami Shores STR market, accounting for 47.0% of listings.
- 48.2% of properties accommodate 6+ guests, serving the market segment for larger families or group travel in Miami Shores.
- On average, properties in Miami Shores are equipped to host 4.8 guests.
How Do Listings in Miami Shores Compare on Quality?
Listing quality in Miami Shores can be approximated through presentation depth, bedroom count, and how often hosts disclose exact locations. These signals show how professionally the local supply base is merchandised.
Listing Quality Insights for Miami Shores
- At 34.7 photos per listing on average, Miami Shores hosts invest well in visual presentation. Listings with 20+ photos consistently outperform in search ranking and conversion.
- 21.7% of listings show their exact location. Lower disclosure rates can increase booking hesitation — guests want to know exactly where they are staying.
Recommendations for Hosts
- Enable exact location if possible — it removes a common source of guest uncertainty and can improve your listing's position in map-based searches.
- Use these quality indicators as a self-audit checklist. Listings that exceed the Miami Shores averages across all three metrics are better positioned for premium pricing.
What Amenities Do Airbnb Guests Expect in Miami Shores?
Amenity Prevalence
Amenity Insights for Miami Shores
- Essential amenities in Miami Shores that guests expect include: Air conditioning, Wifi, Free parking on premises, TV. Lacking these (any) could significantly impact bookings.
- Popular amenities like Smoke alarm, Iron, Hot water are common but not universal. Offering these can provide a competitive edge.
Recommendations for Hosts
- Ensure your listing includes all essential amenities for Miami Shores: Air conditioning, Wifi, Free parking on premises, TV.
- Prioritize adding missing essentials: Air conditioning, Free parking on premises, TV.
- Consider adding popular differentiators like Smoke alarm or Iron to increase appeal.
- Highlight unique or less common amenities you offer (e.g., hot tub, dedicated workspace, EV charger) in your listing description and photos.
- Regularly check competitor amenities in Miami Shores to stay competitive.
Which Airbnb Amenities Boost Revenue in Miami Shores?
Not every amenity matters equally. This table focuses on the amenities most associated with higher revenue in Miami Shores, which makes it more useful for prioritizing upgrades than a simple popularity list alone.
| Amenity | Prevalence | Revenue With | Revenue Without | Revenue Uplift |
|---|---|---|---|---|
Dishes and silverware | 88.0% | $64,654 | $9,639 | 570.7% |
Cooking basics | 84.3% | $66,854 | $10,490 | 537.3% |
Washer | 73.5% | $73,569 | $14,928 | 392.8% |
Outdoor showerHigh opportunity | 8.4% | $212,064 | $43,838 | 383.7% |
Pool | 43.4% | $101,430 | $24,780 | 309.3% |
Dryer | 72.3% | $73,283 | $18,223 | 302.2% |
Pool viewHigh opportunity | 9.6% | $179,410 | $45,078 | 298.0% |
Hair dryer | 88.0% | $63,630 | $17,117 | 271.7% |
Hot water | 90.4% | $62,254 | $18,381 | 238.7% |
Refrigerator | 88.0% | $63,339 | $19,236 | 229.3% |
Revenue Impact Insights for Miami Shores
- Dishes and silverware tops the revenue impact list with a 570.7% uplift — listings with this amenity earn $64,654 vs. $9,639 without it.
- High-opportunity amenities — Outdoor shower, Pool view — combine revenue uplift above 100% with prevalence under 10%, meaning most competitors haven't adopted them yet.
- Dishes and silverware, Cooking basics, Hair dryer, Hot water, Refrigerator — while widespread — still correlate with meaningful revenue gains, making them table stakes rather than true differentiators.
Recommendations for Hosts
- Prioritize adding Outdoor shower — it has the best combination of high revenue impact and low market saturation in Miami Shores.
- Focus your upgrade budget on amenities in the top half of this table. Below-median amenities may improve guest experience but contribute less to revenue growth.
- Highlight revenue-impacting amenities prominently in your listing title, photos, and description — guests can't value what they don't notice.
Dive Deeper: Advanced Miami Shores STR Market Data (2026)
Ready to unlock more insights? AirROI provides access to advanced metrics and comprehensive Airbnb data for Miami Shores. Explore detailed analytics beyond this report to refine your investment strategy, optimize pricing, and maximize your vacation rental profits.
Explore Advanced MetricsMiami Shores Airbnb Guest Demographics & Profile Analysis (2026)
Guest Profile Summary for Miami Shores
- The typical guest profile for Airbnb in Miami Shores consists of primarily domestic travelers (80%), often arriving from nearby New York, typically belonging to the Post-2000s (Gen Z/Alpha) group (50%), primarily speaking English or Spanish.
- Domestic travelers account for 80.4% of guests.
- Key international markets include United States (80.4%) and Canada (2.3%).
- Top languages spoken are English (55.2%) followed by Spanish (22.9%).
- A significant demographic segment is the Post-2000s (Gen Z/Alpha) group, representing 50% of guests.
Recommendations for Hosts
- Target domestic marketing efforts towards travelers from New York and Miami.
- Tailor amenities and listing descriptions to appeal to the dominant Post-2000s (Gen Z/Alpha) demographic (e.g., highlight fast WiFi, smart home features, local guides).
- Highlight unique local experiences or amenities relevant to the primary guest profile.
- Consider seasonal promotions aligned with peak travel times for key origin markets.
What Are Airbnb Guest Ratings in Miami Shores?
Listings in Miami Shores average 4.79 out of 5 overall, with about 104.5 reviews per active listing and 33.7% of listings carrying the Guest Favorite badge.
Rating Breakdown by Category
Guest Rating Insights for Miami Shores
- An average rating of 4.79 places Miami Shores in solid territory. Most guests leave satisfied, though there is room for hosts to push toward the top tier.
- The strongest subcategory is Check-in (4.91), while Value (4.71) trails behind — a useful signal for hosts looking to prioritize upgrades.
- 33.7% of listings carry the Guest Favorite badge, a strong trust signal that can meaningfully lift click-through and booking rates.
Recommendations for Hosts
- Focus improvement efforts on Value — even small gains in the weakest subcategory can lift overall ratings and search ranking.
- Encourage guests to leave reviews after checkout. Listings with more reviews rank higher in search results and convert browsers into bookers more effectively.
Miami Shores Airbnb Booking Patterns (2026): Available vs. Booked Days
Available Days Distribution
Booked Days Distribution
Booking Pattern Insights for Miami Shores
- The most common availability pattern in Miami Shores falls within the 271-366 days range, representing 36.1% of listings. This suggests many properties have significant open periods on their calendars.
- Approximately 68.6% of listings show high availability (181+ days open annually), indicating potential for increased bookings or specific owner usage patterns.
- For booked days, the 91-180 days range is most frequent in Miami Shores (30.1%), reflecting common guest stay durations or potential owner blocking patterns.
- A notable 33.7% of properties secure long booking periods (181+ days booked per year), highlighting successful long-term rental strategies or significant owner usage.
How Far in Advance Do Guests Book Airbnb in Miami Shores?
Average Booking Lead Time by Month
Booking Lead Time Insights for Miami Shores
- The overall average booking lead time for vacation rentals in Miami Shores is 46 days.
- Guests book furthest in advance for stays during June (average 73 days), likely coinciding with peak travel demand or local events.
- The shortest booking windows occur for stays in September (average 28 days), indicating more last-minute travel plans during this time.
- Seasonally, Summer (49 days avg.) sees the longest lead times, while Fall (35 days avg.) has the shortest, reflecting typical travel planning cycles.
Recommendations for Hosts
- Use the overall average lead time (46 days) as a baseline for your pricing and availability strategy in Miami Shores.
- For June stays, consider implementing length-of-stay discounts or slightly higher rates for bookings made less than 73 days out to capitalize on advance planning.
- Target marketing efforts for the Summer season well in advance (at least 49 days) to capture early planners.
- Monitor your own booking lead times against these Miami Shores averages to identify opportunities for dynamic pricing adjustments.
What Is the Average Length of Stay for Airbnb in Miami Shores?
Guests in Miami Shores stay about 5.9 nights on average, generating roughly 2,165 reservations and 26.4 bookings per listing in the latest AirROI dataset. The most common check-in time is 4:00 PM and check-out is 11:00 AM.
Monthly Length of Stay in Miami Shores
Check-in Time Distribution
Check-out Time Distribution
Stay Pattern Insights for Miami Shores
- A mid-range stay length points to leisure-driven demand — weekend getaways and short vacations. Hosts should optimize for quick turnover efficiency while keeping the guest experience smooth.
- At 26.4 bookings per listing, the turnover rate is high. Hosts with streamlined operations (self-check-in, automated messaging, reliable cleaners) have a structural advantage.
- Stay lengths peak in Sep (6.3 nights) and shorten in May (3.6 nights). Adjust minimum-night requirements seasonally to match.
Recommendations for Hosts
- Leverage the longer-stay pattern by offering weekly discounts — even 5-10% off can convert browsing into bookings for guests considering an extended stay.
- Set your check-in time to match or beat the market standard of 4:00 PM. Offering early check-in flexibility can be a low-cost differentiator.
- Monitor length-of-stay seasonality to adjust minimum-night requirements — longer minimums during peak periods maximize revenue while shorter minimums fill gaps in shoulder seasons.
Miami Shores Airbnb Minimum Stay Requirements Analysis
Distribution of Listings by Minimum Night Requirement
1 Night
18 listings
21.7% of total
2 Nights
10 listings
12% of total
3 Nights
8 listings
9.6% of total
4-6 Nights
11 listings
13.3% of total
7-29 Nights
5 listings
6% of total
30+ Nights
31 listings
37.3% of total
Key Insights
- The most prevalent minimum stay requirement in Miami Shores is 30+ Nights, adopted by 37.3% of listings. This highlights the market's preference for longer commitments.
- A significant segment (37.3%) caters to monthly stays (30+ nights) in Miami Shores, pointing to opportunities in the extended-stay market.
Recommendations
- Align with the market by considering a 30+ Nights minimum stay, as 37.3% of Miami Shores hosts use this setting.
- If feasible, allowing 1-night stays, especially midweek or during low season, could capture last-minute bookings, as only 21.7% currently do.
- Explore offering discounts for stays of 30+ nights to attract the 37.3% of the market seeking extended stays.
- Adjust minimum nights based on seasonality – potentially shorter during low season and longer during peak demand periods in Miami Shores.
Miami Shores Airbnb Cancellation Policy Trends Analysis (2026)
Super Strict 30 Days
1 listings
1.2% of total
Limited
7 listings
8.4% of total
Flexible
6 listings
7.2% of total
Moderate
18 listings
21.7% of total
Firm
33 listings
39.8% of total
Strict
18 listings
21.7% of total
Cancellation Policy Insights for Miami Shores
- The prevailing Airbnb cancellation policy trend in Miami Shores is Firm, used by 39.8% of listings.
- A majority (61.5%) of hosts in Miami Shores utilize Firm or Strict policies, indicating a market where hosts prioritize booking security.
Recommendations for Hosts
- Consider adopting a Firm policy to align with the 39.8% market standard in Miami Shores.
- Regularly review your cancellation policy against competitors and market demand shifts in Miami Shores.
How Much Are Airbnb Cleaning Fees in Miami Shores?
Cleaning fees in Miami Shores are meaningful operating levers, not just pass-through charges. What matters most is how often hosts charge them, how high they run relative to market norms, and how large a share of gross revenue they consume.
Cleaning Fee Insights for Miami Shores
- 90.4% of listings charge a cleaning fee, making it standard practice in Miami Shores. Guests expect it and factor it into their booking decisions.
- The gap between the average ($413) and median ($175) cleaning fee indicates some high-end properties are pulling the average up considerably.
- Cleaning fees represent 9.6% of gross revenue on average — a modest component of the overall booking price.
Recommendations for Hosts
- Price your cleaning fee competitively against the Miami Shores median of $175. Fees significantly above market norms can deter bookings, especially for shorter stays.
- Monitor competitor cleaning fees regularly. Airbnb's search algorithm factors in total price, so a well-calibrated cleaning fee can improve your listing's ranking.
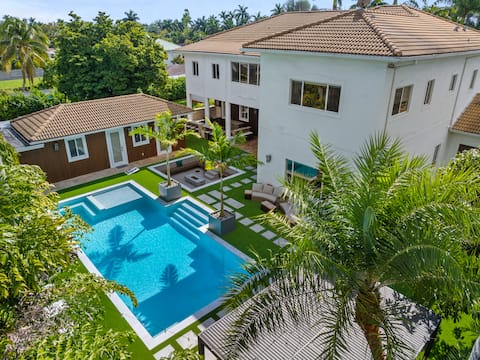
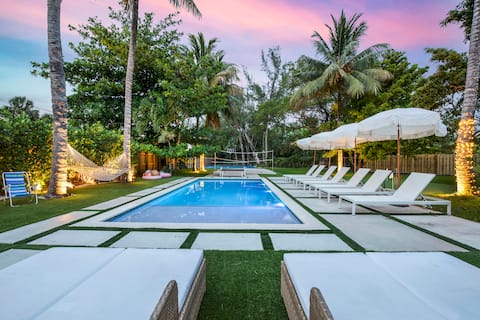
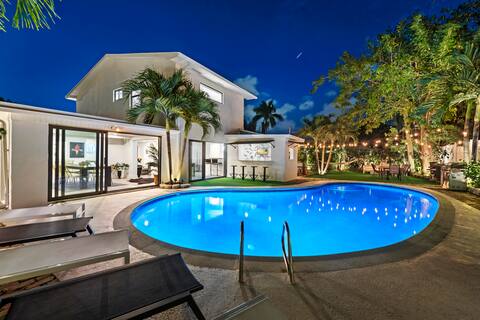
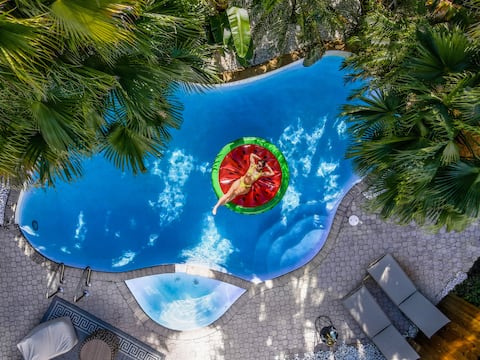
What Do the Top Airbnb Listings in Miami Shores Look Like?
Benchmark your potential! Explore examples of top-performing Airbnb properties in Miami Shoresbased on Trailing Twelve Month (TTM) revenue. Analyze their characteristics, revenue, occupancy rate, and ADR to understand what drives success in this market.
Villa Tortuga Miami | 10BR Pool, Gym & Theater
Entire Place • 10 bedrooms
Villa Parque*Pickleball/Volleyball/Basketball/MiniGolf*
Entire Place • 7 bedrooms
Villa Azur 8BR *Outdoor Oasis with Poolside Bar*
Entire Place • 8 bedrooms
Diamond Estates: 305 Miami
Entire Place • 4 bedrooms
Huge Miami Villa | Pool + HotTub + Game Room
Entire Place • 8 bedrooms

FIFA Perfect 13KM | Samadhi:Pool, Near Beach
Entire Place • 3 bedrooms
Note: Performance varies based on location, size, amenities, seasonality, and management quality. Data reflects the past 12 months.
Who Are the Top Airbnb Hosts in Miami Shores?
Learn from the best! This table showcases top-performing Airbnb hosts in Miami Shores based on the number of properties managed and estimated total revenue over the past year. Analyze their scale and performance metrics.
| Host Name | Properties | Grossing Revenue | Stay Reviews | Avg Rating |
|---|---|---|---|---|
| George Miami Villas | 2 | $664,035 | 210 | 4.88/5.0 |
| Anthony | 1 | $578,332 | 43 | 4.98/5.0 |
| Charlottes Home | 1 | $265,298 | 61 | 4.92/5.0 |
| Mimo Realty LLC | 1 | $229,528 | 150 | 4.83/5.0 |
| Laura | 2 | $167,597 | 1218 | 4.67/5.0 |
| Newman Hospitality | 1 | $159,039 | 53 | 4.77/5.0 |
| Dzyn Haus | 2 | $157,012 | 34 | 4.76/5.0 |
| Michelle | 4 | $113,881 | 356 | 4.80/5.0 |
| Lindsey | 1 | $104,429 | 81 | 4.91/5.0 |
| Rod | 1 | $103,516 | 83 | 4.98/5.0 |
Analyzing the strategies of top hosts, such as their property selection, pricing, and guest communication, can offer valuable lessons for optimizing your own Airbnb operations in Miami Shores.
Who Are the Airbnb Hosts in Miami Shores?
Miami Shores is a quality-focused market, with a high Superhost share and fairly mature operating standards.
Host Profile Insights for Miami Shores
- With 51.8% Superhosts, Miami Shores has an experienced host base that sets high guest expectations. New entrants should plan for competitive quality standards.
- 6.0% of listings are professionally managed, reflecting a market still dominated by individual hosts.
- 8.4% of listings have Instant Book enabled. Lower Instant Book adoption means many guests must request approval, which can slow conversions.
- 73.5% of listings use Airbnb's simplified pricing (host-only fee), where the host pays the entire platform service fee and the guest sees one all-in price with no separate Airbnb service charge. High adoption signals a professional, PMS-connected host base — Airbnb mandates simplified pricing for software-connected listings.
Recommendations for Hosts
- Consider enabling Instant Book — it reduces booking friction and Airbnb's algorithm tends to favor Instant Book listings in search results.
- With 47.0% cohosted listings, there may be a growing local market for property management services.
- Benchmark your host metrics against these Miami Shores averages regularly and adjust your hosting strategy based on what top performers do differently.
Top Professional Management Companies in Miami Shores
These are the highest-grossing professional property management operations in Miami Shores, ranked by total revenue across their portfolio. Their performance metrics offer a benchmark for what institutional-level hosting looks like in this market.
| Company | Listings | Revenue | ADR | Occ. | Rating |
|---|---|---|---|---|---|
| Laura | 2 | $167,597 | $267 | 81.8% | 4.67/5 |
| Newman Hospitality | 1 | $159,039 | $566 | 74.9% | 4.77/5 |
| Rod | 1 | $103,516 | $2,091 | 43.5% | 4.98/5 |
| Jacomina | 1 | $99,649 | $407 | 63.9% | 4.94/5 |
| Lucas And Martin | 1 | $61,833 | $226 | 74.3% | 4.92/5 |
Management Company Insights for Miami Shores
- The leading management company, Laura, operates 2 listings with $167,597 in gross revenue — a useful benchmark for what scale looks like in Miami Shores.
- Top managers average 1 properties each, suggesting professional management in Miami Shores still operates at a relatively boutique scale.
- Professionally managed listings in the top tier average 4.85/5 in guest ratings — demonstrating that scale and quality can coexist.
Recommendations
- With only 6.0% of listings professionally managed, there may be an opportunity to differentiate through more structured operations and consistent guest experiences.
- Study how top management companies price, position, and maintain their portfolios — their ADR and occupancy rates reflect strategies refined across dozens of listings.
- If you're considering hiring a property manager, compare their portfolio performance against these benchmarks before committing.
How Does Miami Shores's Airbnb Market Compare to Nearby Cities?
How does the Miami Shores Airbnb market stack up against its neighbors? Compare key performance metrics like average monthly revenue, ADR, and occupancy rates in surrounding areas to understand the broader regional STR landscape.
Compared with Stock Island, Miami Shores has 1 percentage points higher occupancy and about $438 lower ADR. That helps frame whether this market is winning more on demand, pricing, or both.
| Market | Active Properties | Monthly Revenue | Daily Rate | Avg. Occupancy |
|---|---|---|---|---|
| Stock Island | 100 | $11,603 | $858.51 | 47% |
| Bal Harbour Village | 37 | $9,713 | $894.23 | 35% |
| Key West | 1,217 | $7,588 | $682.11 | 45% |
| Lake Clarke Shores | 23 | $6,922 | $569.59 | 44% |
| Lighthouse Point | 71 | $6,242 | $572.25 | 46% |
| Juno Beach | 41 | $6,181 | $491.18 | 45% |
| North Bay Village | 112 | $6,073 | $590.52 | 40% |
| Little Torch Key | 22 | $5,445 | $728.02 | 31% |
| Summerland Key | 60 | $5,233 | $535.47 | 40% |
| Pinecrest | 11 | $5,059 | $924.86 | 39% |
Frequently Asked Questions About Airbnb in Miami Shores
These quick answers summarize the most common investor and operator questions using AirROI's latest market data for Miami Shores.
How much do Airbnb hosts make in Miami Shores?
Miami Shores hosts earn about $58,026 per year on average, with an average nightly rate of $421 and RevPAR of $199. Those figures describe the typical revenue environment for active listings in Miami Shores, Florida, not the ceiling for the best operators. Source: AirROI 2026 data, Miami Shores market, July 2025 to June 2026.
What is the average Airbnb occupancy rate in Miami Shores?
The average Airbnb occupancy rate in Miami Shores is 47.7%. March is the strongest month and November is the softest, so hosts should expect demand to move meaningfully throughout the year rather than stay flat.
What is the average Airbnb daily rate in Miami Shores?
Listings in Miami Shores average $421 per night. The broader pricing spread also matters: lower-performing listings cluster closer to the lower quartiles, while premium homes can price materially above the city average when demand spikes or listing quality stands out.
How many Airbnb listings are active in Miami Shores?
Miami Shores currently has about 83 active Airbnb listings in AirROI's market dataset. That supply count helps explain how competitive the market is, how much depth there is for benchmarking, and whether the market behaves like a niche destination or a scaled urban market.
How strict are short-term rental regulations in Miami Shores?
AirROI currently classifies the short-term rental regulation level in Miami Shores as High. The dataset also shows about 60.2% of listings with registration evidence. That is a market signal, not legal advice, so hosts should still confirm current licensing and compliance rules locally before listing.
What is the RevPAR for Airbnb in Miami Shores?
RevPAR in Miami Shores is about $199. That metric combines pricing and occupancy into one efficiency number, so it is often a better quick benchmark than ADR alone when investors want to compare how well listings convert nightly rates into realized revenue.
Is Airbnb profitable in Miami Shores?
At 47.7% occupancy, Miami Shores can be profitable — but margins depend heavily on operating costs, property acquisition price, and how well hosts optimize pricing across seasons. Average annual revenue is $58,026, but individual returns depend on property type, location within the city, and the host's operating efficiency.
How far in advance do guests book Airbnb in Miami Shores?
The average booking lead time in Miami Shores is about 46 days — a longer planning horizon typical of destination or vacation markets where travelers book well in advance. Hosts who understand their market's booking cadence can adjust minimum stays and pricing windows accordingly.
What are the best neighborhoods for Airbnb in Miami Shores?
Based on AirROI's analysis, some of the top neighborhoods for short-term rentals in Miami Shores include Miami Shores, North Miami Beach, Aventura. Each area attracts different guest profiles — from business travelers to leisure visitors — so the best location depends on the property type and target audience a host is aiming for. See the full neighborhood breakdown above.
What type of property performs best on Airbnb in Miami Shores?
entire_home listings make up 85.5% of the active supply in Miami Shores. The most common configuration does not always mean the most profitable — operators who identify underserved property types or bedroom counts can sometimes outperform the market average by filling a gap in local supply.
How does Miami Shores compare to nearby Airbnb markets?
Among neighboring markets, Stock Island posts $139,240 in average annual revenue with 47.4% occupancy, compared to Miami Shores's $58,026 and 47.7%. Comparing nearby markets helps investors understand whether a destination's performance reflects local demand or broader regional trends.
What is the average length of stay in Miami Shores?
The average Airbnb stay length in Miami Shores is about 5.9 nights. That matters for turnover, cleaning operations, and pricing strategy because shorter stays increase changeovers while longer stays can smooth occupancy and reduce operational friction.
What is the average Airbnb guest rating in Miami Shores?
Airbnb listings in Miami Shores average 4.79 out of 5 overall. About 33.7% of listings carry the guest favorite badge, which suggests a meaningful share of inventory is competing on review quality rather than price alone.
Which amenities boost Airbnb revenue in Miami Shores?
Dishes and silverware and Cooking basics are among the strongest revenue-linked amenities in Miami Shores. In AirROI's latest dataset, listings with these amenities outperform those without on average revenue, which makes amenities analysis useful for prioritizing investment and listing upgrades.
Do Airbnb hosts charge cleaning fees in Miami Shores?
Yes. About 90.4% of active Airbnb listings in Miami Shores charge a cleaning fee, and the average fee is $413. The more important operating benchmark is how much of gross revenue that fee consumes, not just the absolute dollar amount.
What percentage of Airbnb hosts are Superhosts in Miami Shores?
A 51.8% Superhost rate signals a highly competitive market where review quality and responsiveness are table stakes, not differentiators.
About AirROI Market Data
AirROI tracks over 20 million properties across 190+ countries and maintains 15+ years of historical performance data, making it one of the deepest Airbnb and STR intelligence platforms available. The analytics pipeline aggregates listing-level data monthly — revenue, occupancy, nightly rates, RevPAR, guest demographics, booking patterns, and competitive supply — so investors and operators can benchmark any market against its own history and against neighboring destinations.
Real estate investors, property managers, financial institutions, hedge funds, tourism boards, hospitality consultants, tech platforms, and academic researchers rely on AirROI data to underwrite acquisitions, optimize pricing, model macro trends, and conduct peer-reviewed research. Data is available through in-depth market reports like this one and the Airbnb API with 22 endpoints and an Airbnb MCP Server for AI agents.
AirROI proprietary analytics as of 2026-06-30. Metrics reflect trailing twelve-month aggregates from active listings. Revenue figures are market averages, not projections. Neighborhood descriptions are AI-generated and reviewed for accuracy. For full methodology, see the data methodology page.