Airbnb market data · 202612 months to October 2026
Opa-locka, FL Airbnb Market Data: Revenue, Occupancy & Trends
The average Airbnb in Opa-locka brought in $15,680 over the 12 months through October 2026, across just 29 active listings, so a single property can move that figure.
The short answer
Opa-locka Airbnb Market at a Glance
Opa-locka is priced below the Florida average. Listings averaged $144 a night, about 58% less than that average of $345, and were booked on 44% of available nights, close to its 43% occupancy.
March, usually the best month, brings in about 78% more per listing than October, usually the slowest. With only 29 active listings, a few bookings can reorder the months.
With 29 active listings, Opa-locka is the 391st-largest of 478 Florida markets AirROI tracks.
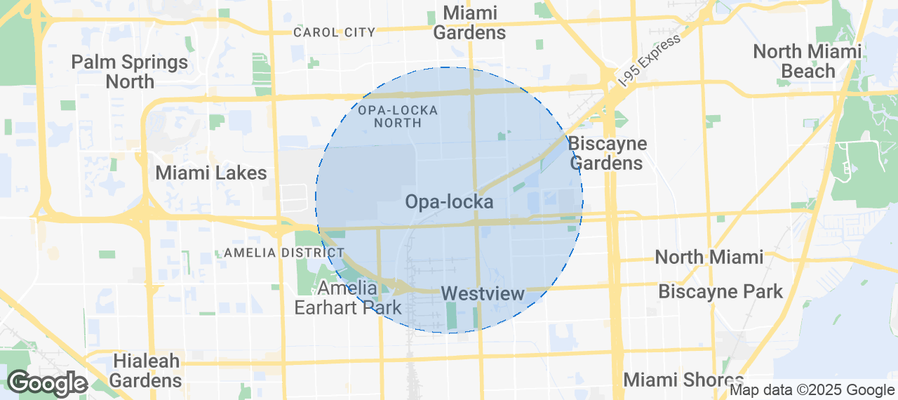 Browse the live Opa-locka Airbnb market See Every Opa-locka Listing
Revenue
How Much Do Airbnb Hosts Make in Opa-locka?
Gross bookings per Opa-locka listing averaged $15,680 over the 12 months to October 2026 (Florida average: $41,358), before cleaning, platform and management costs and taxes.
In a typical year, the average Opa-locka listing brings in $2,740 in March, its best month, and $1,540 in October, its slowest. The three strongest months bring in 31% of a full year's revenue, where an even calendar would give any three months 25%.
Across Opa-locka's 29 active listings, monthly revenue by tier:
- Best-in-class properties (top 10%) earn $5,160+ a month, about 3.2 times the typical property.
- Strong performers (top 25%) earn $2,780 or more, roughly $1,200 a month above the median.
- Typical properties (median) earn about $1,600 a month.
- Entry-level properties (bottom 25%) earn $795 or less, about half of the median.
These are monthly figures for listings active in each month. The annual average above also counts listings that operated for only part of the year, so it runs below twelve times these figures.
March earns about 1.8 times what October does
Average revenue per active listing, by month, October 2024 to September 2026
Each point is one month as recorded, averaged over the listings active in it. The best and slowest months in the text average each calendar month over the past two years, so they can differ from the highest and lowest points here.
Opa-locka Airbnb Data by Month
Latest 12 months in the October 2026 data. October's figures are still coming in, so the rows run to September.
March 2026 led on revenue and bookings; nightly rates peaked in February 2026.
| Month | Avg. Revenue | Occupancy | Avg. Nightly Rate | RevPAR | Booking Lead Time | Avg. Length of Stay |
|---|---|---|---|---|---|---|
| Oct 2025 | $1,731 | 41.3% | $167 | $56 | 17 days | 4.2 nights |
| Nov 2025 | $2,281 | 50.0% | $167 | $76 | 10 days | 9.7 nights |
| Dec 2025 | $2,402 | 53.1% | $170 | $77 | 29 days | 6.4 nights |
| Jan 2026 | $2,407 | 51.1% | $171 | $78 | 25 days | 5.6 nights |
| Feb 2026 | $2,515 | 58.5% | $174 | $90 | 27 days | 5.3 nights |
| Mar 2026 | $3,182 | 66.0% | $174 | $103 | 31 days | 6.5 nights |
| Apr 2026 | $2,113 | 41.1% | $171 | $70 | 39 days | 5.7 nights |
| May 2026 | $1,858 | 41.2% | $170 | $60 | 35 days | 3.9 nights |
| Jun 2026 | $2,005 | 41.5% | $153 | $67 | 48 days | 4 nights |
| Jul 2026 | $1,920 | 34.6% | $152 | $62 | 56 days | 3.8 nights |
| Aug 2026 | $2,802 | 51.3% | $137 | $90 | 39 days | 7.8 nights |
| Sep 2026 | $2,200 | 49.3% | $134 | $73 | 19 days | 5.6 nights |
Averages per active listing in each month. Highlighted: the highest-revenue month of the 12. RevPAR is the month's revenue spread over its nights, booked or not. Booking lead time is the days between booking and check-in, and length of stay the nights per booking, for stays in that month.
Location, size and how a home is run move its income far more than a city average shows. For a range on one Opa-locka address, run it through the Airbnb income calculator.
Profit
Is an Airbnb in Opa-locka Profitable?
Yes, when it's run well. The average Opa-locka Airbnb took in $15,680 in the 12 months to October 2026, and run by its owner at everyday costs, about $880 a month of that is left after running costs, so a home that costs less than that to own or rent makes money. A listing in the top quarter leaves about $1,540 a month.
Cleaning it yourself keeps the $1,260 a year guests pay in cleaning fees, for about $980 a month. Handing the listing to a co-host at about 10% of nightly bookings still leaves about $760 a month.
These amounts come before housing costs. Where the mortgage or rent is less each month, the difference is profit; a home owned outright keeps it all after property tax, home insurance and any HOA or condo fees.
Opa-locka Airbnb Income, Expenses and Profit per Year
| Line | Average listing | Top-quarter listing |
|---|---|---|
| Money in | ||
| Nightly bookings | $14,420 | $25,150 |
| Cleaning fees guests pay8% of Opa-locka bookings | $1,260 | $2,190 |
| Gross bookings | $15,680 | $27,340 |
| Running costs | ||
| Airbnb's feeAbout 13%: 15.5% for the 83% of Opa-locka listings on Simplified Pricing, 3% for the rest | −$2,090 | −$3,650 |
| Cleaning and laundryPaid for by the cleaning fee; $0 if you clean yourself | −$1,260 | −$2,190 |
| Utilities and internetAbout 5% of bookings | −$780 | −$1,370 |
| Guest suppliesToiletries, coffee, paper goods: about 2% | −$310 | −$550 |
| Repairs and upkeepIncluding linens and small replacements: about 3% | −$470 | −$820 |
| Short-term rental insuranceOne policy, on top of Airbnb's free AirCover | −$160 | −$160 |
| Permit and registrationWhere one is required | −$80 | −$80 |
| Management$0 when you run it; co-hosts charge from about 10% of nightly bookings | $0 | $0 |
| Pricing and messaging toolsOptional; Airbnb's own tools are free | $0 | $0 |
| Lodging taxesAdded to the guest's bill and passed on | $0 | $0 |
| Total running costsAbout 25% of bookings, plus cleaning paid for by the cleaning fee | −$5,150 | −$8,820 |
| Left for housing costs, then profit | $10,530about $880 a month | $18,520about $1,540 a month |
| Housing costs | ||
| Mortgage or rent, property tax, home insurance, HOA or condo fees | Depend on the home | |
Estimate Your Own Opa-locka Airbnb Profit
The estimate starts from Opa-locka's average listing, run by its owner. Change how the listing performs, who runs it and who cleans to see what is left for the mortgage or rent.
To work out the profit on one Opa-locka home, with its price, its mortgage or rent and your own costs, use the Airbnb profit calculator. It starts from the comparable listings around the address.
How Opa-locka's Top Earners Get There
- More nights booked. The busiest quarter of Opa-locka listings are booked on 70% or more of their nights, against 45% for the median listing. Ten more booked nights a year at the median rate of $105 adds about $1,050 in bookings.
- Prices that follow demand. Ranked by price, the top quarter charge $160 a night or more, against a median of $105. That is a separate ranking from the busiest quarter, so the two marks don't multiply into one listing's takings. For the average listing, a 10% higher rate on the nights it already books adds about $1,440 a year.
- Open for the busy months. In a typical year, March brings the average listing about $2,740, against $1,540 in October, so a calendar that is open and full in the busy months carries the year.
- Reviews that stand out. Opa-locka listings average 4.81 stars, and 14% carry Airbnb's Guest Favorite badge, which guests can filter for.
What a listing keeps comes down to the figures this page measures: nightly rate, nights booked and the months it's open. A listing at the top-quarter mark takes in about $2,280 a month, against $1,310 for the average one.
Occupancy
What Is the Airbnb Occupancy Rate in Opa-locka?
Opa-locka listings were booked on 44% of the nights they were open over the past year, in line with the Florida average and 3 percentage points above the U.S. average (41%). In a typical year, occupancy swings from 42% in April to 67% in March.
Across Opa-locka's 29 active listings, the share of open nights booked by tier:
- Best-in-class properties (top 10%) are booked 84%+ of open nights, 39 points above the median.
- Strong performers (top 25%) fill 70% or more, roughly five nights a week.
- Typical properties (median) fill about 45% of open nights.
- Entry-level properties (bottom 25%) fill 24% or less, under two nights a week.
March is usually the busiest month in Opa-locka, April the quietest
Share of open nights booked, by month, October 2024 to September 2026
The 12-month rate of 44% averages each listing's whole year, slow months included; each month here counts only the listings booked in it.
Nightly rates
How Much Does an Airbnb Cost per Night in Opa-locka?
The average nightly rate in Opa-locka, known as ADR (average daily rate), was $144 over the past year, about 58% below the Florida and U.S. averages ($345 and $335). Averaged month by month over the past two years, rates peak in January and May at about $175 and bottom out in August and September at about $150.
Across Opa-locka's 29 active listings, nightly rates by tier:
- Best-in-class properties (top 10%) charge $325+ a night, about three times the median.
- Strong performers (top 25%) charge $160 or more, about $55 above the median.
- Typical properties (median) charge about $105 a night.
- Entry-level properties (bottom 25%) charge $70 or less, about two-thirds of the median.
January rates run 16% above September's
Average nightly rate (ADR), by month, October 2024 to September 2026
The 12-month ADR of $144 averages each listing's own rate across its whole year; the monthly points average listings month by month, so the two differ.
What Is the RevPAR for Airbnb in Opa-locka?
RevPAR, or revenue per available night, divides a listing's income by every night it was open to book, so it rises with both price and bookings. In Opa-locka it averaged $67 over the past year, from about $50 in a typical October to about $88 in a typical March.
Across Opa-locka's 29 active listings, RevPAR by tier:
- Best-in-class properties (top 10%) earn $155+ per open night, about 3.2 times the median.
- Strong performers (top 25%) earn $83 or more, about $35 a night above the median.
- Typical properties (median) earn about $49 per open night.
- Entry-level properties (bottom 25%) earn $27 or less, about 56% of the median.
March RevPAR is about 1.8 times October's
Revenue per open night (RevPAR), by month, October 2024 to September 2026
Seasonality
Best and Worst Months for Airbnb in Opa-locka
With only 29 active listings, the monthly pattern in Opa-locka is noisy, since a few long or pricey stays can lift a month; revenue has tended to peak in March and bottom out in October.
Average revenue by month in Opa-locka
Average revenue per active listing, each calendar month averaged over the past two years
Revenue by month in Opa-locka in numbers
| Month | Revenue per listing |
|---|---|
| January | $2,390 |
| February | $2,440 |
| March | $2,740 |
| April | $1,840 |
| May | $1,850 |
| June | $1,800 |
| July | $1,950 |
| August | $1,990 |
| September | $1,840 |
| October | $1,540 |
| November | $2,000 |
| December | $2,380 |
How Far in Advance Do Guests Book Airbnb in Opa-locka?
Guests book Opa-locka stays 38 days ahead on average (about five weeks). October stays are booked furthest out, about 39 days ahead, and November stays closest to arrival, about 10 days. A typical October booking is made in early September.
October stays are booked furthest ahead
Average days between booking and check-in, by month of stay, October 2024 to September 2026
The 12-month figure of 38 days averages each listing's year as a whole; each month here averages only the listings with stays in it.
Permits
Airbnb Permits and Registration in Opa-locka
3% of the 29 active listings in Opa-locka display a registration, permit or license number. A low share doesn't mean no rules apply: some places don't ask hosts to show a number on the listing, and listing data doesn't capture every scheme.
Registration, permit, zoning and occupancy-tax rules vary by address and change often, so confirm them with the city or county before buying or listing in Opa-locka.
Neighborhoods
Best Neighborhoods for Airbnb in Opa-locka
AirROI's area guide picks eight Opa-locka neighborhoods that draw short-term rental guests, led by Opa-locka North, Downtown Opa-locka and Opa-locka West. The picks reflect guest appeal, not earnings data or permit eligibility, so check local permit rules for a specific address before buying.
| Area | Who it suits | Landmarks nearby |
|---|---|---|
| Opa-locka North | A family-friendly neighborhood with parks and a close-knit community feel. It appeals to families and groups looking for a suburban experience while being close to Miami attractions. | Opa-locka Executive Airport, A.M. Smith Park, Aventura Mall nearby, South Florida's Ecological parks, Nearby cultural venues |
| Downtown Opa-locka | The vibrant heart of Opa-locka featuring a mix of historical buildings and modern developments. Attractive for short-term stays due to the rich culture and history. | Opa-locka City Hall, Historic buildings and landmarks, Mary B. McCloud Park, Shopping and dining options |
| Opa-locka West | Known for its quiet streets and residential appeal. Good for longer stays and attracting local families visiting. | Historic Opa-locka city buildings, Nearby parks, Community festivals, Local eateries |
| Carol City | Adjacent to Opa-locka, offering good rental opportunities with its proximity to public transport and amenities, catering to budget-conscious travelers. | Carol City Park, Shopping centers, Public transport accessibility, Local art and culture spots |
| Andover | A suburban neighborhood with a variety of housing options, making it ideal for families or larger groups traveling together. | Nearby schools and parks, Community events, Local markets, Proximity to Miami |
| Golden Glades | Good transit access via I-95 and close to major shopping areas. Favored by those enjoying a mix of access to both city life and suburban comfort. | Golden Glades Shopping Plaza, Public transportation hubs, Cultural events at local venues, Nearby recreational areas |
| Lakes of the Meadows | A gated community emphasizing safety and comfort. Attracts those looking for a peaceful stay in the Opa-locka vicinity. | Community amenities, Local lakes, Parks and recreation areas, Community centers |
| West Little River | An affordable area with great proximity to both Miami and the beaches, ideal for budget travelers and those visiting Florida attractions. | Nearby beaches, Public parks, Local dining options, Cultural attractions in Miami |
Area descriptions are AI-assisted from public sources and are not checked against zoning.
Nearby markets
Opa-locka vs. Nearby Airbnb Markets
Of the eight nearby markets in the table, all within 10 km, Miami Shores (6 km away, 83 listings) earned the most per listing, about 4.2 times as much as Opa-locka. Biscayne Park was the busiest, booked on 48% of nights against 44% in Opa-locka.
| Market | Listings | Avg. annual revenue | Avg. nightly rate | Occupancy |
|---|---|---|---|---|
| Hialeah 5 km | 432 | $42,592 | $294 | 46% |
| Miami Gardens 5 km | 252 | $37,927 | $299 | 40% |
| North Miami 6 km | 288 | $52,752 | $389 | 45% |
| Biscayne Park 6 km | 40 | $56,339 | $418 | 48% |
| Miami Shores 6 km | 83 | $66,302 | $467 | 47% |
| El Portal 7 km | 44 | $39,113 | $362 | 44% |
| North Miami Beach 8 km | 192 | $43,170 | $338 | 45% |
| West Park 10 km | 66 | $17,595 | $153 | 43% |
Other Airbnb Markets in Florida
- Kissimmee Airbnb data 10,968 listings
- Panama City Beach Airbnb data 10,441 listings
- Four Corners Airbnb data 10,347 listings
- Miami Airbnb data 9,434 listings
- Miramar Beach Airbnb data 4,985 listings
- Orlando Airbnb data 4,752 listings
- Tampa Airbnb data 4,601 listings
- Miami Beach Airbnb data 4,529 listings
See all 478 Florida Airbnb markets
Markets Similar to Opa-locka
Markets elsewhere in the United States with a similar nightly rate and occupancy to Opa-locka:
- Baldwin Park Airbnb data CA · $147/night · 44.1%
- West Valley City Airbnb data UT · $145/night · 43.4%
- Huntington Airbnb data WV · $143/night · 45.7%
- Lawton Airbnb data OK · $145/night · 42.2%
- City of Troy Airbnb data NY · $136/night · 44.5%
- Rockville Airbnb data MD · $147/night · 42.5%
FAQ
Opa-locka Airbnb FAQ
How much do Airbnb hosts make in Opa-locka?
An active Opa-locka Airbnb grossed $15,680 on average in the 12 months to October 2026, according to AirROI's tracking of 29 active listings. That is before cleaning, management, taxes and financing. Busier, better-run listings do far better: the top quarter took in $2,780 or more in a typical month.
How much can I make on Airbnb in Opa-locka?
It depends most on the home's size, location and how it's run. The middle half of Opa-locka listings earn between $795 and $2,780 in a typical month, and the top tenth $5,160 or more. For one home, enter its address and bedroom count in the Airbnb calculator: it compares the home with similar listings nearby.
What is the average Airbnb occupancy rate in Opa-locka?
Listings in Opa-locka were booked on 44% of available nights over the past year. That compares with 43% for the Florida average. March is usually the busiest month.
How much does an Airbnb cost per night in Opa-locka?
The average booked night in Opa-locka cost $144 before fees. Half of listings charge between $70 and $160, so bedroom count and location move the price more than the average suggests.
Do you need a permit for an Airbnb in Opa-locka?
In Opa-locka, 3% of active listings display a registration, permit or license number. A low share doesn't mean no rules apply, so confirm registration, permit and occupancy-tax rules with the city or county before buying.
Is Airbnb profitable in Opa-locka?
Yes, when it's run well. The average Opa-locka Airbnb grossed $15,680 in the 12 months to October 2026, 62% below the Florida average of $41,358, though with only 29 active listings a single property can move that figure. Run by its owner, with the cleaning fee covering the cleaner and everyday costs for Airbnb's fee, utilities, supplies, upkeep and insurance, $10,530 a year (about $880 a month) is left before the mortgage or rent. A home that costs less than that to own or rent makes a profit, and a listing at the top-quarter mark leaves about $1,540 a month. Check a specific home in the Airbnb estimator.
When is Airbnb peak season in Opa-locka?
March usually pays best, averaging $2,740 per active listing over the past two years, and October usually pays least. The month-by-month table above shows how the latest 12 months played out.
What is the Airbnb RevPAR in Opa-locka?
Each night a Opa-locka listing was open to book earned $67 on average over the past year, booked or not. That figure, revenue per available night (RevPAR), folds price and occupancy into one number; the top 10% of listings made $155 or more.
How far in advance do guests book Airbnbs in Opa-locka?
Opa-locka stays were booked 38 days (about five weeks) before arrival on average over the past year, so most of a month is booked well before it starts.
How long do guests stay at Airbnbs in Opa-locka?
The average Opa-locka Airbnb stay lasted 6.6 nights over the past year. A listing took 20 reservations over the year on average.
How are Airbnbs in Opa-locka rated?
Guests rate Opa-locka Airbnbs 4.81 out of 5 on average. Guests score check-in highest and location lowest.
What are the best neighborhoods for Airbnb in Opa-locka?
Opa-locka North, Downtown Opa-locka and Opa-locka West draw the most short-term rental interest in Opa-locka. The neighborhood guide explains what brings guests to each.
How many Airbnbs are there in Opa-locka?
AirROI counted 29 active Airbnb listings in Opa-locka as of October 2026. The closest tracked market is Hialeah, 5 km away.
How much are Airbnb cleaning fees in Opa-locka?
In Opa-locka, about seven in ten listings add a cleaning fee. The median fee is $98, and some higher fees lift the average to $128.
How many tourists visit Opa-locka, FL?
All of Florida had 143.3 million visitors in 2025, a preliminary estimate from the State of Florida. AirROI estimates 574 Airbnb stays in Opa-locka, FL in the 12 months to October 2026, which counts bookings and not tourists. See Florida tourism statistics.
Method
About This Data
Figures on this page cover 29 active Airbnb listings in Opa-locka from November 2025 to October 2026 (trailing twelve months). AirROI refreshes them monthly from listing-level booking and calendar data covering 20+ million properties worldwide. Money figures are in U.S. dollars. Annual revenue averages every listing active during the period, including those listed for only part of it; monthly figures average the listings active in each month; the tier lists show the spread. Neighborhood descriptions are AI-assisted. See the methodology for definitions.
Need this programmatically? The same metrics are available through the AirROI Airbnb Data API and bulk downloads in the data portal.