Baldwin, Michigan Airbnb Market Data 2026: STR Report & Statistics
How much can you earn on Airbnb in Baldwin, Michigan? Based on AirROI's 2026 dataset (June 2025 – May 2026), the short answer is $11,307 per year — at a $208 nightly rate, 25.8% occupancy, and a $58 RevPAR that reflects a wider gap between nightly rates and realized revenue that rewards occupancy-focused strategies.
With just 20 active listings, Baldwin is a micro-market where selective demand that rewards strong listing quality and pricing strategy. Supply grew 566.7% and nightly rates have risen, creating an environment where the most bookable listings stand to capture outsized share. Hosts who pair competitive pricing with strong guest experience are well-positioned to convert the growing traveler base into consistent bookings.
Regulation is low with minimal registration requirements, pointing to an operator-friendly environment. In a market this size, differentiated listings with strong reviews can capture outsized returns relative to the competition.
Table of Contents [hide] [show]
What Are the Key Airbnb Metrics in Baldwin?
In Baldwin, the headline Airbnb metrics are $11,307 in average annual revenue,25.8% occupancy, $208 ADR, and $58 in RevPAR, and guests book about 34 days in advance.
How Much Do Airbnb Hosts Earn Monthly in Baldwin?
Understanding the monthly revenue variations for Airbnb listings in Baldwin is key to maximizing your short term rental income potential. Seasonality significantly impacts earnings. Our analysis, based on data from the past 12 months, shows that the peak revenue month for STRs in Baldwin is typically September, while April often presents the lowest earnings, highlighting opportunities for strategic pricing adjustments during shoulder and low seasons. Explore the typical Airbnb income in Baldwin across different performance tiers:
- Best-in-class properties (Top 10%) achieve $5,060+ monthly, often utilizing dynamic pricing and superior guest experiences.
- Strong performing properties (Top 25%) earn $2,963 or more, indicating effective management and desirable locations/amenities.
- Typical properties (Median) generate around $1,440 per month, representing the average market performance.
- Entry-level properties (Bottom 25%) see earnings around $803, often with potential for optimization.
Average Monthly Airbnb Earnings Trend in Baldwin
What Is the Monthly Airbnb Occupancy Rate in Baldwin?
Maximize your bookings by understanding the Baldwin STR occupancy trends. Seasonal demand shifts significantly influence how often properties are booked. Typically, Septembersees the highest demand (peak season occupancy), while January experiences the lowest (low season). Effective strategies, like adjusting minimum stays or offering promotions, can boost occupancy during slower periods. Here's how different property tiers perform in Baldwin:
- Best-in-class properties (Top 10%) achieve 62%+ occupancy, indicating high desirability and potentially optimized availability.
- Strong performing properties (Top 25%) maintain 46% or higher occupancy, suggesting good market fit and guest satisfaction.
- Typical properties (Median) have an occupancy rate around 27%.
- Entry-level properties (Bottom 25%) average 18% occupancy, potentially facing higher vacancy.
Average Monthly Occupancy Rate Trend in Baldwin
What Is the Average Airbnb Nightly Rate in Baldwin?
Effective short term rental pricing strategy in Baldwin involves understanding monthly ADR fluctuations. The Average Daily Rate (ADR) for Airbnb in Baldwin typically peaks in May and dips lowest during December. Leveraging Airbnb dynamic pricing tools or strategies based on this seasonality can significantly boost revenue. Here's a look at the typical nightly rates achieved:
- Best-in-class properties (Top 10%) command rates of $314+ per night, often due to premium features or locations.
- Strong performing properties (Top 25%) achieve nightly rates of $248 or more.
- Typical properties (Median) charge around $176 per night.
- Entry-level properties (Bottom 25%) earn around $143 per night.
Average Daily Rate (ADR) Trend by Month in Baldwin
What Is the RevPAR for Airbnb in Baldwin?
RevPAR in Baldwin is currently $58. Because RevPAR combines nightly rates with realized occupancy, it is one of the cleanest ways to compare how efficiently listings turn demand into revenue across the market.
- Entry-level properties (Bottom 25%) see $27 RevPAR.
- Typical properties (Median) generate $53 RevPAR.
- Strong performers (Top 25%) earn $61 RevPAR.
- Best-in-class (Top 10%) achieve $104 RevPAR.
Average Monthly RevPAR Trend in Baldwin
RevPAR Insights for Baldwin
- The average RevPAR in Baldwin is $58. This metric combines nightly rates with realized occupancy, making it one of the best single-number indicators of market efficiency.
- The gap between the top 10% ($104) and bottom 25% ($27) is $77, suggesting a relatively compressed market where operational differences yield moderate returns.
- RevPAR peaks in Sep and bottoms out in Apr, mirroring the broader seasonal demand pattern and suggesting opportunities for dynamic pricing.
Recommendations for Hosts
- Track your own RevPAR monthly against these Baldwin benchmarks. If your RevPAR falls below the median of $53, examine whether low occupancy or low ADR is the primary drag.
- Top-quartile listings achieve $61+ RevPAR through a combination of competitive pricing, strong reviews, and strategic amenities. Target this tier through incremental improvements.
- Use RevPAR rather than revenue alone when comparing properties of different sizes — it normalizes for available nights and gives a more accurate picture of performance.
Get Live Baldwin Market Intelligence 👇
Explore Real-time Analytics
When Is the Peak Season for Airbnb in Baldwin?
Baldwin's peak Airbnb season falls in September, July, November, while the softest stretch is January, March, April. Overall, the market shows highly seasonal trends requiring careful strategy, which should guide pricing, minimum stays, and cash-flow planning.
Peak Season (September, July, November)
- Revenue averages $2,906 per month
- Occupancy rates average 43.1%
- Daily rates average $196
Shoulder Season
- Revenue averages $2,234 per month
- Occupancy maintains around 35.4%
- Daily rates hold near $206
Low Season (January, March, April)
- Revenue drops to average $1,447 per month
- Occupancy decreases to average 21.2%
- Daily rates adjust to average $222
Seasonality Insights for Baldwin
- Airbnb seasonality in Baldwin is pronounced. Revenue swings sharply between peak and low months, which means pricing strategy, minimum-stay settings, and cash reserves all need to account for extended slower periods.
- During the high season, the absolute peak month showcases Baldwin's highest earning potential, with monthly revenues climbing to $3,100, occupancy reaching 51.7%, and ADRs peaking at $232.
- Conversely, the slowest single month marks the market's lowest point — revenue may dip to $1,279, occupancy could drop to 19.4%, and ADRs may adjust to $191.
- Lower occupancy paired with meaningful seasonality means hosts in Baldwin need to maximize every peak-season booking and seriously consider whether off-season pricing adjustments or minimum-stay changes can capture incremental revenue.
Seasonal Strategies for Maximizing Profit
- Peak Season: Maximize revenue through premium pricing and potentially longer minimum stays. Ensure high availability and consider tightening cancellation policies to reduce last-minute gaps.
- Low Season: Offer competitive pricing, extended-stay discounts, and flexible cancellation policies. Target off-season travelers like remote workers, budget-conscious guests, and travelers with flexible schedules.
- Shoulder Seasons: Implement dynamic pricing that bridges peak and low rates. Target weekend travelers, local events, and business visitors. Slightly more flexible terms than peak season can help maintain occupancy without deep discounting.
- In a highly seasonal market like Baldwin, building a cash reserve during the top months is essential for covering fixed costs during the slow period. Automated pricing tools can help capture demand shifts in real time.
Do You Need a License for Airbnb in Baldwin?
Low regulation and minimal registration activity in Baldwin, Michigan, United States point to an operator-friendly environment. That said, even low-regulation markets may have tax collection requirements, safety standards, or HOA rules that affect short-term rental operations. Always verify the latest short-term rental regulations and Airbnb license requirements directly with local government authorities for Baldwin to ensure full compliance before hosting.
(Source: AirROI data, 2026, finding no licensed listings among those analyzed)
What Are the Best Neighborhoods for Airbnb in Baldwin?
With a compact short-term rental market, Baldwin gives early-mover hosts an advantage in the right neighborhoods. The areas listed below are where guest demand and local attractions converge — a useful lens for investors evaluating whether to enter this market and where to position their listing.
| Neighborhood / Area | Why Host Here? (Target Guests & Appeal) | Key Attractions & Landmarks |
|---|---|---|
| Baldwin Lake | A serene getaway destination known for its beautiful lake and outdoor recreational opportunities. Perfect for families and nature enthusiasts looking for a peaceful retreat with fishing, swimming, and picnicking. | Baldwin Lake, Baldwin River, Baldwin State Forest, camping sites, fishing opportunities, hiking trails |
| Waldo Lake | A picturesque location that boasts stunning natural beauty, targeting travelers who want to escape city life and engage in outdoor activities such as kayaking and hiking. | Waldo Lake, nature trails, fishing spots, picnic areas, wildlife viewing, scenic overlooks |
| Big Star Lake | Popular among summer vacationers seeking a relaxing lakeside experience. Features a sandy beach and warm water, making it a great spot for swimming and sunbathing. | Big Star Lake, beach access, water sports, boating opportunities, nature preserves, local eateries |
| Kaleva | A quaint town that serves as a gateway to northern Michigan's outdoor adventures, appealing to those wanting to explore nearby forests and lakes. | Kaleva Historical Museum, local parks, hiking and biking trails, community events, nature exploration, nearby lakes |
| Irons | Known for its close proximity to several lakes and nature reserves, Irons attracts nature lovers and outdoor enthusiasts keen on fishing, hiking, and camping. | Pine River, Hoffmaster State Park, local trails, campgrounds, ATV trails, fishing lakes |
| Mason County | A larger region that incorporates various towns and outdoor attractions, ideal for travelers seeking a diverse range of activities and natural beauty. | Lake Michigan beaches, Ludington State Park, fishing opportunities, scenic drives, local wineries, art festivals |
| Newaygo State Park | A popular hiking and camping destination situated near rivers and lakes, making it appealing for those who enjoy active outdoor vacations. | Newaygo State Park, Manistee River, camping areas, fishing locations, hiking trails, nature events |
| Manistee National Forest | Offering extensive wooded areas and wildlife, this national forest attracts those interested in camping, hiking, and nature photography, providing a rustic backdrop for travelers. | Manistee River, campgrounds, scenic hiking trails, wildlife watching, local fishing spots, natural beauty sights |
With 8 distinct neighborhoods showing meaningful short-term rental activity, Baldwin offers diversification within a single market. Investors can tailor their strategy — from high-turnover tourist zones to quieter residential areas that attract longer stays and remote workers.
What Types of Properties Are on Airbnb in Baldwin?
Room Type Distribution
Property Type Distribution
Market Composition Insights for Baldwin
- The Baldwin Airbnb market composition is heavily skewed towards Entire Home/Apt listings, which make up 95% of the 20 active rentals. This indicates strong guest preference for privacy and space.
- Looking at the property type distribution in Baldwin, House properties are the most common (60%), reflecting the local real estate landscape.
- Houses represent a significant 60% portion, catering likely to families or larger groups.
Baldwin Airbnb Room Capacity Analysis (2026): Bedroom Distribution
Distribution of Listings by Number of Bedrooms
Room Capacity Insights for Baldwin
- The dominant room capacity in Baldwin is 2 bedrooms listings, making up 55% of the market. This suggests a strong demand for properties suitable for couples or solo travelers.
- Together, 2 bedrooms and 3 bedrooms properties represent 80.0% of the active Airbnb listings in Baldwin, indicating a high concentration in these sizes.
- A significant 35.0% of listings offer 3+ bedrooms, catering to larger groups and families seeking more space in Baldwin.
Baldwin Vacation Rental Guest Capacity Trends (2026)
Distribution of Listings by Guest Capacity
Guest Capacity Insights for Baldwin
- The most common guest capacity trend in Baldwin vacation rentals is listings accommodating 6 guests (35%). This suggests the primary traveler segment is likely larger groups.
- Properties designed for 6 guests and 8+ guests dominate the Baldwin STR market, accounting for 60.0% of listings.
- 60.0% of properties accommodate 6+ guests, serving the market segment for larger families or group travel in Baldwin.
- On average, properties in Baldwin are equipped to host 5.8 guests.
How Do Listings in Baldwin Compare on Quality?
Listing quality in Baldwin can be approximated through presentation depth, bedroom count, and how often hosts disclose exact locations. These signals show how professionally the local supply base is merchandised.
Listing Quality Insights for Baldwin
- At 38 photos per listing on average, Baldwin hosts invest well in visual presentation. Listings with 20+ photos consistently outperform in search ranking and conversion.
- 45.0% of listings show their exact location. Lower disclosure rates can increase booking hesitation — guests want to know exactly where they are staying.
Recommendations for Hosts
- Enable exact location if possible — it removes a common source of guest uncertainty and can improve your listing's position in map-based searches.
- Use these quality indicators as a self-audit checklist. Listings that exceed the Baldwin averages across all three metrics are better positioned for premium pricing.
What Amenities Do Airbnb Guests Expect in Baldwin?
Amenity Prevalence
Amenity Insights for Baldwin
- Essential amenities in Baldwin that guests expect include: Free parking on premises, Kitchen, Heating, BBQ grill, TV, Smoke alarm. Lacking these (any) could significantly impact bookings.
- Popular amenities like Fire extinguisher, Fire pit, Bed linens are common but not universal. Offering these can provide a competitive edge.
Recommendations for Hosts
- Ensure your listing includes all essential amenities for Baldwin: Free parking on premises, Kitchen, Heating, BBQ grill, TV, Smoke alarm.
- Prioritize adding missing essentials: Kitchen, Heating, BBQ grill, TV, Smoke alarm.
- Consider adding popular differentiators like Fire extinguisher or Fire pit to increase appeal.
- Highlight unique or less common amenities you offer (e.g., hot tub, dedicated workspace, EV charger) in your listing description and photos.
- Regularly check competitor amenities in Baldwin to stay competitive.
Which Airbnb Amenities Boost Revenue in Baldwin?
Not every amenity matters equally. This table focuses on the amenities most associated with higher revenue in Baldwin, which makes it more useful for prioritizing upgrades than a simple popularity list alone.
| Amenity | Prevalence | Revenue With | Revenue Without | Revenue Uplift |
|---|---|---|---|---|
Bathtub | 30.0% | $23,191 | $6,214 | 273.2% |
Outdoor furniture | 60.0% | $15,609 | $4,854 | 221.6% |
Dining table | 75.0% | $13,544 | $4,598 | 194.5% |
Refrigerator | 75.0% | $13,544 | $4,598 | 194.5% |
Barbecue utensils | 55.0% | $15,890 | $5,706 | 178.5% |
Freezer | 70.0% | $13,908 | $5,238 | 165.5% |
Backyard | 65.0% | $14,325 | $5,703 | 151.2% |
Dryer | 35.0% | $18,137 | $7,630 | 137.7% |
Microwave | 75.0% | $12,898 | $6,536 | 97.3% |
Exterior security cameras on property | 45.0% | $15,466 | $7,905 | 95.7% |
Revenue Impact Insights for Baldwin
- Bathtub tops the revenue impact list with a 273.2% uplift — listings with this amenity earn $23,191 vs. $6,214 without it.
Recommendations for Hosts
- Focus your upgrade budget on amenities in the top half of this table. Below-median amenities may improve guest experience but contribute less to revenue growth.
- Highlight revenue-impacting amenities prominently in your listing title, photos, and description — guests can't value what they don't notice.
Dive Deeper: Advanced Baldwin STR Market Data (2026)
Ready to unlock more insights? AirROI provides access to advanced metrics and comprehensive Airbnb data for Baldwin. Explore detailed analytics beyond this report to refine your investment strategy, optimize pricing, and maximize your vacation rental profits.
Explore Advanced MetricsBaldwin Airbnb Guest Demographics & Profile Analysis (2026)
Guest Profile Summary for Baldwin
- The typical guest profile for Airbnb in Baldwin consists of primarily domestic travelers (97%), often arriving from nearby Chicago, typically belonging to the Post-2000s (Gen Z/Alpha) group (50%), primarily speaking English or Spanish.
- Domestic travelers account for 96.7% of guests.
- Key international markets include United States (96.7%) and DC (1.6%).
- Top languages spoken are English (81.6%) followed by Spanish (6.1%).
- A significant demographic segment is the Post-2000s (Gen Z/Alpha) group, representing 50% of guests.
Recommendations for Hosts
- Target domestic marketing efforts towards travelers from Chicago and Grand Rapids.
- Tailor amenities and listing descriptions to appeal to the dominant Post-2000s (Gen Z/Alpha) demographic (e.g., highlight fast WiFi, smart home features, local guides).
- Highlight unique local experiences or amenities relevant to the primary guest profile.
- Consider seasonal promotions aligned with peak travel times for key origin markets.
What Are Airbnb Guest Ratings in Baldwin?
Listings in Baldwin average 4.88 out of 5 overall, with about 34.5 reviews per active listing and 45.0% of listings carrying the Guest Favorite badge.
Rating Breakdown by Category
Guest Rating Insights for Baldwin
- With an overall rating of 4.88, Baldwin listings meet an exceptionally high bar. Guests consistently report strong satisfaction, which drives repeat bookings and referral traffic.
- The strongest subcategory is Communication (4.92), while Cleanliness (4.81) trails behind — a useful signal for hosts looking to prioritize upgrades.
- 45.0% of listings carry the Guest Favorite badge, a strong trust signal that can meaningfully lift click-through and booking rates.
Recommendations for Hosts
- Focus improvement efforts on Cleanliness — even small gains in the weakest subcategory can lift overall ratings and search ranking.
- Encourage guests to leave reviews after checkout. Listings with more reviews rank higher in search results and convert browsers into bookers more effectively.
Baldwin Airbnb Booking Patterns (2026): Available vs. Booked Days
Available Days Distribution
Booked Days Distribution
Booking Pattern Insights for Baldwin
- The most common availability pattern in Baldwin falls within the 271-366 days range, representing 80% of listings. This suggests many properties have significant open periods on their calendars.
- Approximately 95.0% of listings show high availability (181+ days open annually), indicating potential for increased bookings or specific owner usage patterns.
- For booked days, the 1-30 days range is most frequent in Baldwin (45%), reflecting common guest stay durations or potential owner blocking patterns.
- A notable 5.0% of properties secure long booking periods (181+ days booked per year), highlighting successful long-term rental strategies or significant owner usage.
How Far in Advance Do Guests Book Airbnb in Baldwin?
Average Booking Lead Time by Month
Booking Lead Time Insights for Baldwin
- The overall average booking lead time for vacation rentals in Baldwin is 34 days.
- Guests book furthest in advance for stays during May (average 65 days), likely coinciding with peak travel demand or local events.
- The shortest booking windows occur for stays in December (average 8 days), indicating more last-minute travel plans during this time.
- Seasonally, Fall (45 days avg.) sees the longest lead times, while Winter (22 days avg.) has the shortest, reflecting typical travel planning cycles.
Recommendations for Hosts
- Use the overall average lead time (34 days) as a baseline for your pricing and availability strategy in Baldwin.
- For May stays, consider implementing length-of-stay discounts or slightly higher rates for bookings made less than 65 days out to capitalize on advance planning.
- During December, focus on last-minute booking availability and promotions, as guests book with very short notice (8 days avg.).
- Target marketing efforts for the Fall season well in advance (at least 45 days) to capture early planners.
- Monitor your own booking lead times against these Baldwin averages to identify opportunities for dynamic pricing adjustments.
What Is the Average Length of Stay for Airbnb in Baldwin?
Guests in Baldwin stay about 3.4 nights on average, generating roughly 243 reservations and 12.2 bookings per listing in the latest AirROI dataset. The most common check-in time is 3:00 PM and check-out is 11:00 AM.
Monthly Length of Stay in Baldwin
Check-in Time Distribution
Check-out Time Distribution
Stay Pattern Insights for Baldwin
- A mid-range stay length points to leisure-driven demand — weekend getaways and short vacations. Hosts should optimize for quick turnover efficiency while keeping the guest experience smooth.
- 12.2 bookings per listing is a manageable pace that balances revenue with operational overhead.
- Stay lengths peak in Oct (5.5 nights) and shorten in Jan (2.1 nights). Adjust minimum-night requirements seasonally to match.
Recommendations for Hosts
- With shorter average stays, focus on streamlining turnover. Self-check-in, reliable cleaning crews, and pre-staged amenities can reduce per-booking operational costs.
- Set your check-in time to match or beat the market standard of 3:00 PM. Offering early check-in flexibility can be a low-cost differentiator.
- Monitor length-of-stay seasonality to adjust minimum-night requirements — longer minimums during peak periods maximize revenue while shorter minimums fill gaps in shoulder seasons.
Baldwin Airbnb Minimum Stay Requirements Analysis
Distribution of Listings by Minimum Night Requirement
1 Night
6 listings
30% of total
2 Nights
10 listings
50% of total
3 Nights
2 listings
10% of total
30+ Nights
2 listings
10% of total
Key Insights
- The most prevalent minimum stay requirement in Baldwin is 2 Nights, adopted by 50% of listings. This highlights the market's preference for shorter, flexible bookings.
- A strong majority (80.0%) of the Baldwin Airbnb data shows acceptance of very short stays (1-2 nights), indicating a dynamic, high-turnover market.
Recommendations
- Align with the market by considering a 2 Nights minimum stay, as 50% of Baldwin hosts use this setting.
- Explore offering discounts for stays of 30+ nights to attract the 10% of the market seeking extended stays.
- Adjust minimum nights based on seasonality – potentially shorter during low season and longer during peak demand periods in Baldwin.
Baldwin Airbnb Cancellation Policy Trends Analysis (2026)
Limited
2 listings
10% of total
Flexible
3 listings
15% of total
Moderate
8 listings
40% of total
Firm
5 listings
25% of total
Strict
2 listings
10% of total
Cancellation Policy Insights for Baldwin
- The prevailing Airbnb cancellation policy trend in Baldwin is Moderate, used by 40% of listings.
- There's a relatively balanced mix between guest-friendly (55.0%) and stricter (35.0%) policies, offering choices for different guest needs.
Recommendations for Hosts
- Consider adopting a Moderate policy to align with the 40% market standard in Baldwin.
- Using a Strict policy might deter some guests, as only 10% of listings use it. Evaluate if potential revenue protection outweighs possible lower booking rates.
- Regularly review your cancellation policy against competitors and market demand shifts in Baldwin.
How Much Are Airbnb Cleaning Fees in Baldwin?
Cleaning fees in Baldwin are meaningful operating levers, not just pass-through charges. What matters most is how often hosts charge them, how high they run relative to market norms, and how large a share of gross revenue they consume.
Cleaning Fee Insights for Baldwin
- 100.0% of listings charge a cleaning fee, making it standard practice in Baldwin. Guests expect it and factor it into their booking decisions.
- The average cleaning fee of $109 is close to the median ($101), suggesting a relatively consistent fee structure across the market.
- Cleaning fees represent 12.7% of gross revenue on average — a significant line item that impacts total guest cost and competitiveness.
Recommendations for Hosts
- Price your cleaning fee competitively against the Baldwin median of $101. Fees significantly above market norms can deter bookings, especially for shorter stays.
- Consider whether bundling the cleaning fee into a slightly higher nightly rate might improve conversion, since many guests filter by total price and separate fees can feel punitive.
- Monitor competitor cleaning fees regularly. Airbnb's search algorithm factors in total price, so a well-calibrated cleaning fee can improve your listing's ranking.
What Do the Top Airbnb Listings in Baldwin Look Like?
Benchmark your potential! Explore examples of top-performing Airbnb properties in Baldwinbased on Trailing Twelve Month (TTM) revenue. Analyze their characteristics, revenue, occupancy rate, and ADR to understand what drives success in this market.

PM Trailhead Lodge
Entire Place • 3 bedrooms
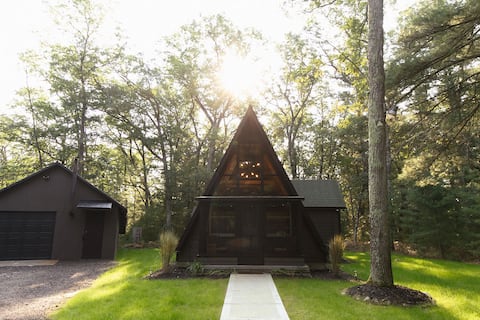
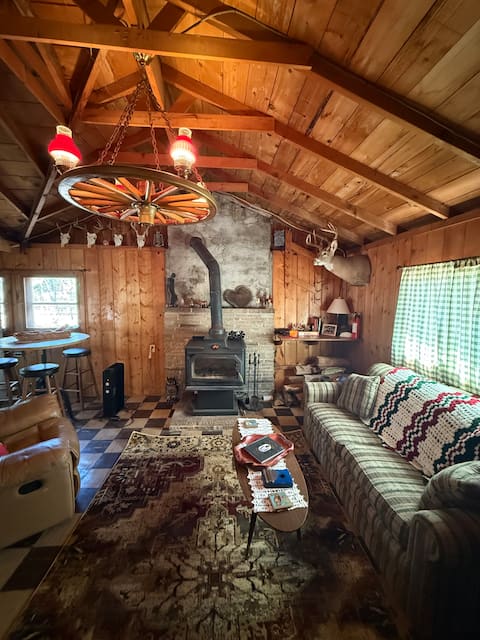
Tranquil A-Frame Cabin in the Woods w/ Sauna
Entire Place • 2 bedrooms
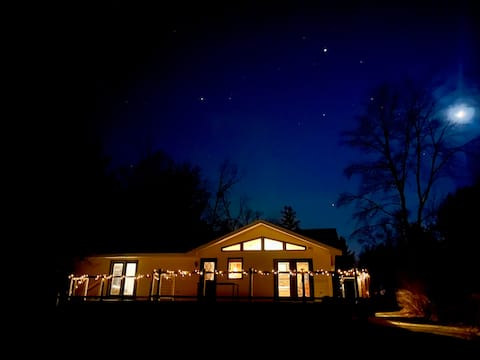
The River House
Entire Place • 3 bedrooms
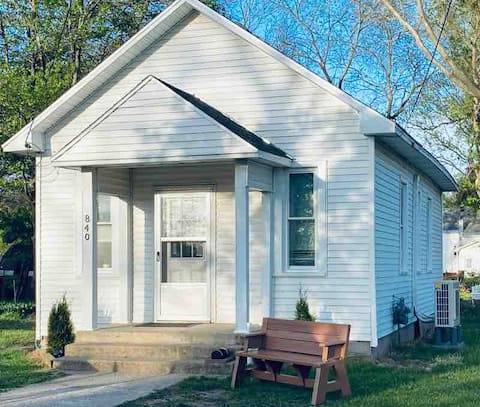
Little Chapel on the PM
Entire Place • 1 bedroom
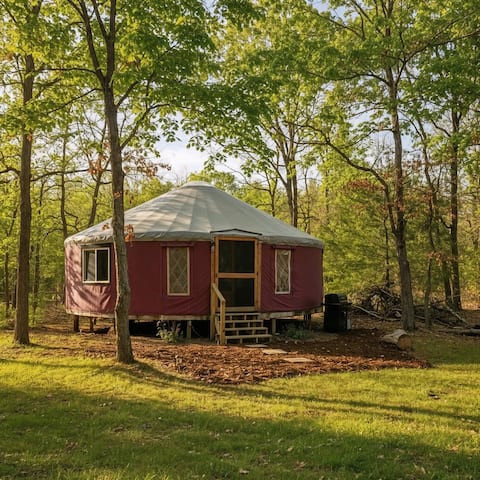
Private Luxury Yurt 20 Wooded Acres Pet-Friendly
Entire Place • 2 bedrooms
The Hidden Owl Cabin + onsite rustic campsites
Entire Place • 2 bedrooms
Note: Performance varies based on location, size, amenities, seasonality, and management quality. Data reflects the past 12 months.
Who Are the Top Airbnb Hosts in Baldwin?
Learn from the best! This table showcases top-performing Airbnb hosts in Baldwin based on the number of properties managed and estimated total revenue over the past year. Analyze their scale and performance metrics.
| Host Name | Properties | Grossing Revenue | Stay Reviews | Avg Rating |
|---|---|---|---|---|
| Christopher | 1 | $47,098 | 4 | 5.00/5.0 |
| Heather | 1 | $31,364 | 34 | 5.00/5.0 |
| Andi | 1 | $25,560 | 34 | 4.82/5.0 |
| Jacob George | 1 | $20,488 | 87 | 4.89/5.0 |
| Holly | 2 | $16,543 | 64 | 4.96/5.0 |
| Michael | 1 | $11,908 | 250 | 4.92/5.0 |
| Jonathan | 1 | $11,216 | 9 | 4.44/5.0 |
| Kurt | 1 | $10,679 | 50 | 5.00/5.0 |
| Evolve | 1 | $8,437 | 8 | 4.75/5.0 |
| Ryan | 1 | $7,711 | 6 | 4.83/5.0 |
Analyzing the strategies of top hosts, such as their property selection, pricing, and guest communication, can offer valuable lessons for optimizing your own Airbnb operations in Baldwin.
Who Are the Airbnb Hosts in Baldwin?
Baldwin is a quality-focused market, with a high Superhost share and fairly mature operating standards.
Host Profile Insights for Baldwin
- With 60.0% Superhosts, Baldwin has an experienced host base that sets high guest expectations. New entrants should plan for competitive quality standards.
- 10.0% of listings are professionally managed, reflecting a market still dominated by individual hosts.
- 5.0% of listings have Instant Book enabled. Lower Instant Book adoption means many guests must request approval, which can slow conversions.
- 65.0% of listings use Airbnb's simplified pricing (host-only fee), where the host pays the entire platform service fee and the guest sees one all-in price with no separate Airbnb service charge. High adoption signals a professional, PMS-connected host base — Airbnb mandates simplified pricing for software-connected listings.
Recommendations for Hosts
- Consider enabling Instant Book — it reduces booking friction and Airbnb's algorithm tends to favor Instant Book listings in search results.
- With 20.0% cohosted listings, there may be a growing local market for property management services.
- Benchmark your host metrics against these Baldwin averages regularly and adjust your hosting strategy based on what top performers do differently.
Top Professional Management Companies in Baldwin
These are the highest-grossing professional property management operations in Baldwin, ranked by total revenue across their portfolio. Their performance metrics offer a benchmark for what institutional-level hosting looks like in this market.
| Company | Listings | Revenue | ADR | Occ. | Rating |
|---|---|---|---|---|---|
| Michael | 1 | $11,908 | $164 | 33.4% | 4.92/5 |
| Evolve | 1 | $8,437 | $309 | 19.5% | 4.75/5 |
Management Company Insights for Baldwin
- The leading management company, Michael, operates 1 listings with $11,908 in gross revenue — a useful benchmark for what scale looks like in Baldwin.
- Top managers average 1 properties each, suggesting professional management in Baldwin still operates at a relatively boutique scale.
- Professionally managed listings in the top tier average 4.84/5 in guest ratings — demonstrating that scale and quality can coexist.
Recommendations
- With only 10.0% of listings professionally managed, there may be an opportunity to differentiate through more structured operations and consistent guest experiences.
- Study how top management companies price, position, and maintain their portfolios — their ADR and occupancy rates reflect strategies refined across dozens of listings.
- If you're considering hiring a property manager, compare their portfolio performance against these benchmarks before committing.
How Does Baldwin's Airbnb Market Compare to Nearby Cities?
How does the Baldwin Airbnb market stack up against its neighbors? Compare key performance metrics like average monthly revenue, ADR, and occupancy rates in surrounding areas to understand the broader regional STR landscape.
Compared with Grattan Township, Baldwin has 28 percentage points lower occupancy and about $182 lower ADR. That helps frame whether this market is winning more on demand, pricing, or both.
| Market | Active Properties | Monthly Revenue | Daily Rate | Avg. Occupancy |
|---|---|---|---|---|
| Ganges Township | 68 | $5,991 | $662.46 | 38% |
| Greilickville | 37 | $5,696 | $522.49 | 49% |
| Saugatuck Township | 139 | $5,681 | $554.92 | 42% |
| Port Sheldon Township | 25 | $5,670 | $628.01 | 45% |
| Laketown Township | 60 | $5,588 | $571.18 | 44% |
| Blair Township | 50 | $5,309 | $533.74 | 45% |
| Grass Lake Charter Township | 12 | $5,165 | $420.92 | 43% |
| Ganges | 22 | $4,724 | $527.17 | 38% |
| Grattan Township | 16 | $4,628 | $390.00 | 54% |
| Hagar Township | 27 | $4,608 | $584.57 | 42% |
Frequently Asked Questions About Airbnb in Baldwin
These quick answers summarize the most common investor and operator questions using AirROI's latest market data for Baldwin.
How much do Airbnb hosts make in Baldwin?
Baldwin hosts earn about $11,307 per year on average, with an average nightly rate of $208 and RevPAR of $58. Those figures describe the typical revenue environment for active listings in Baldwin, Michigan, not the ceiling for the best operators. Source: AirROI 2026 data, Baldwin market, June 2025 to May 2026.
What is the average Airbnb occupancy rate in Baldwin?
The average Airbnb occupancy rate in Baldwin is 25.8%. September is the strongest month and April is the softest, so hosts should expect demand to move meaningfully throughout the year rather than stay flat.
What is the average Airbnb daily rate in Baldwin?
Listings in Baldwin average $208 per night. The broader pricing spread also matters: lower-performing listings cluster closer to the lower quartiles, while premium homes can price materially above the city average when demand spikes or listing quality stands out.
How many Airbnb listings are active in Baldwin?
Baldwin currently has about 20 active Airbnb listings in AirROI's market dataset. That supply count helps explain how competitive the market is, how much depth there is for benchmarking, and whether the market behaves like a niche destination or a scaled urban market.
How strict are short-term rental regulations in Baldwin?
AirROI currently classifies the short-term rental regulation level in Baldwin as Low. The dataset also shows about 0.0% of listings with registration evidence. That is a market signal, not legal advice, so hosts should still confirm current licensing and compliance rules locally before listing.
What is the RevPAR for Airbnb in Baldwin?
RevPAR in Baldwin is about $58. That metric combines pricing and occupancy into one efficiency number, so it is often a better quick benchmark than ADR alone when investors want to compare how well listings convert nightly rates into realized revenue.
Is Airbnb profitable in Baldwin?
Occupancy of 25.8% means Baldwin is a more selective market. Profitability is achievable but requires careful cost management, premium positioning, or targeting longer stays to reduce turnover. Average annual revenue is $11,307, but individual returns depend on property type, location within the city, and the host's operating efficiency.
How far in advance do guests book Airbnb in Baldwin?
The average booking lead time in Baldwin is about 34 days — a moderate lead time that gives hosts planning visibility while still benefiting from last-minute bookings. Hosts who understand their market's booking cadence can adjust minimum stays and pricing windows accordingly.
What are the best neighborhoods for Airbnb in Baldwin?
Based on AirROI's analysis, some of the top neighborhoods for short-term rentals in Baldwin include Baldwin Lake, Waldo Lake, Big Star Lake. Each area attracts different guest profiles — from business travelers to leisure visitors — so the best location depends on the property type and target audience a host is aiming for. See the full neighborhood breakdown above.
What type of property performs best on Airbnb in Baldwin?
entire_home listings make up 95.0% of the active supply in Baldwin. The most common configuration does not always mean the most profitable — operators who identify underserved property types or bedroom counts can sometimes outperform the market average by filling a gap in local supply.
How does Baldwin compare to nearby Airbnb markets?
Among neighboring markets, Ganges Township posts $71,893 in average annual revenue with 37.5% occupancy, compared to Baldwin's $11,307 and 25.8%. Comparing nearby markets helps investors understand whether a destination's performance reflects local demand or broader regional trends.
What is the average length of stay in Baldwin?
The average Airbnb stay length in Baldwin is about 3.4 nights. That matters for turnover, cleaning operations, and pricing strategy because shorter stays increase changeovers while longer stays can smooth occupancy and reduce operational friction.
What is the average Airbnb guest rating in Baldwin?
Airbnb listings in Baldwin average 4.88 out of 5 overall. About 45.0% of listings carry the guest favorite badge, which suggests a meaningful share of inventory is competing on review quality rather than price alone.
Which amenities boost Airbnb revenue in Baldwin?
Bathtub and Outdoor furniture are among the strongest revenue-linked amenities in Baldwin. In AirROI's latest dataset, listings with these amenities outperform those without on average revenue, which makes amenities analysis useful for prioritizing investment and listing upgrades.
Do Airbnb hosts charge cleaning fees in Baldwin?
Yes. About 100.0% of active Airbnb listings in Baldwin charge a cleaning fee, and the average fee is $109. The more important operating benchmark is how much of gross revenue that fee consumes, not just the absolute dollar amount.
What percentage of Airbnb hosts are Superhosts in Baldwin?
A 60.0% Superhost rate signals a highly competitive market where review quality and responsiveness are table stakes, not differentiators.
About AirROI Market Data
AirROI tracks over 20 million properties across 190+ countries and maintains 15+ years of historical performance data, making it one of the deepest Airbnb and STR intelligence platforms available. The analytics pipeline aggregates listing-level data monthly — revenue, occupancy, nightly rates, RevPAR, guest demographics, booking patterns, and competitive supply — so investors and operators can benchmark any market against its own history and against neighboring destinations.
Real estate investors, property managers, financial institutions, hedge funds, tourism boards, hospitality consultants, tech platforms, and academic researchers rely on AirROI data to underwrite acquisitions, optimize pricing, model macro trends, and conduct peer-reviewed research. Data is available through in-depth market reports like this one and the Airbnb API with 22 endpoints and an Airbnb MCP Server for AI agents.
AirROI proprietary analytics as of 2026-05-31. Metrics reflect trailing twelve-month aggregates from active listings. Revenue figures are market averages, not projections. Neighborhood descriptions are AI-generated and reviewed for accuracy. For full methodology, see the data methodology page.