Horry County, South Carolina Airbnb Market Data 2026: STR Report & Statistics
How much can you earn on Airbnb in Horry County, South Carolina? Based on AirROI's 2026 dataset (May 2025 – April 2026), the short answer is $31,369 per year — at a $333 nightly rate, 37.6% occupancy, and a $138 RevPAR that reflects moderate rate-to-revenue efficiency with room to optimize.
At 55 active listings, Horry County is a boutique market where moderate demand with room for well-positioned listings to outperform. Supply grew 1000.0% over the past year, yet revenue and nightly rates both trended upward — a signal that traveler demand is outpacing new inventory rather than being diluted by it. For hosts, pricing power remains intact even as competition increases.
Regulation is low with minimal registration requirements, pointing to an operator-friendly environment. In a market this size, differentiated listings with strong reviews can capture outsized returns relative to the competition.

Table of Contents [hide] [show]
What Are the Key Airbnb Metrics in Horry County?
In Horry County, the headline Airbnb metrics are $31,369 in average annual revenue,37.6% occupancy, $333 ADR, and $138 in RevPAR, and guests book about 62 days in advance.
How Much Do Airbnb Hosts Earn Monthly in Horry County?
Understanding the monthly revenue variations for Airbnb listings in Horry County is key to maximizing your short term rental income potential. Seasonality significantly impacts earnings. Our analysis, based on data from the past 12 months, shows that the peak revenue month for STRs in Horry County is typically July, while January often presents the lowest earnings, highlighting opportunities for strategic pricing adjustments during shoulder and low seasons. Explore the typical Airbnb income in Horry County across different performance tiers:
- Best-in-class properties (Top 10%) achieve $8,013+ monthly, often utilizing dynamic pricing and superior guest experiences.
- Strong performing properties (Top 25%) earn $5,527 or more, indicating effective management and desirable locations/amenities.
- Typical properties (Median) generate around $3,303 per month, representing the average market performance.
- Entry-level properties (Bottom 25%) see earnings around $1,830, often with potential for optimization.
Average Monthly Airbnb Earnings Trend in Horry County
What Is the Monthly Airbnb Occupancy Rate in Horry County?
Maximize your bookings by understanding the Horry County STR occupancy trends. Seasonal demand shifts significantly influence how often properties are booked. Typically, Julysees the highest demand (peak season occupancy), while January experiences the lowest (low season). Effective strategies, like adjusting minimum stays or offering promotions, can boost occupancy during slower periods. Here's how different property tiers perform in Horry County:
- Best-in-class properties (Top 10%) achieve 68%+ occupancy, indicating high desirability and potentially optimized availability.
- Strong performing properties (Top 25%) maintain 48% or higher occupancy, suggesting good market fit and guest satisfaction.
- Typical properties (Median) have an occupancy rate around 32%.
- Entry-level properties (Bottom 25%) average 17% occupancy, potentially facing higher vacancy.
Average Monthly Occupancy Rate Trend in Horry County
What Is the Average Airbnb Nightly Rate in Horry County?
Effective short term rental pricing strategy in Horry County involves understanding monthly ADR fluctuations. The Average Daily Rate (ADR) for Airbnb in Horry County typically peaks in June and dips lowest during November. Leveraging Airbnb dynamic pricing tools or strategies based on this seasonality can significantly boost revenue. Here's a look at the typical nightly rates achieved:
- Best-in-class properties (Top 10%) command rates of $460+ per night, often due to premium features or locations.
- Strong performing properties (Top 25%) achieve nightly rates of $373 or more.
- Typical properties (Median) charge around $310 per night.
- Entry-level properties (Bottom 25%) earn around $243 per night.
Average Daily Rate (ADR) Trend by Month in Horry County
What Is the RevPAR for Airbnb in Horry County?
RevPAR in Horry County is currently $138. Because RevPAR combines nightly rates with realized occupancy, it is one of the cleanest ways to compare how efficiently listings turn demand into revenue across the market.
- Entry-level properties (Bottom 25%) see $91 RevPAR.
- Typical properties (Median) generate $136 RevPAR.
- Strong performers (Top 25%) earn $173 RevPAR.
- Best-in-class (Top 10%) achieve $216 RevPAR.
Average Monthly RevPAR Trend in Horry County
RevPAR Insights for Horry County
- The average RevPAR in Horry County is $138. This metric combines nightly rates with realized occupancy, making it one of the best single-number indicators of market efficiency.
- The gap between the top 10% ($216) and bottom 25% ($91) is $125, indicating significant performance disparity driven by property quality, pricing strategy, and location.
- RevPAR peaks in Jul and bottoms out in Jan, mirroring the broader seasonal demand pattern and suggesting opportunities for dynamic pricing.
Recommendations for Hosts
- Track your own RevPAR monthly against these Horry County benchmarks. If your RevPAR falls below the median of $136, examine whether low occupancy or low ADR is the primary drag.
- Top-quartile listings achieve $173+ RevPAR through a combination of competitive pricing, strong reviews, and strategic amenities. Target this tier through incremental improvements.
- Use RevPAR rather than revenue alone when comparing properties of different sizes — it normalizes for available nights and gives a more accurate picture of performance.
Get Live Horry County Market Intelligence 👇
Explore Real-time Analytics
When Is the Peak Season for Airbnb in Horry County?
Horry County's peak Airbnb season falls in July, June, August, while the softest stretch is January, November, December. Overall, the market shows highly seasonal trends requiring careful strategy, which should guide pricing, minimum stays, and cash-flow planning.
Peak Season (July, June, August)
- Revenue averages $6,866 per month
- Occupancy rates average 52.3%
- Daily rates average $393
Shoulder Season
- Revenue averages $3,295 per month
- Occupancy maintains around 32.4%
- Daily rates hold near $302
Low Season (January, November, December)
- Revenue drops to average $2,574 per month
- Occupancy decreases to average 26.9%
- Daily rates adjust to average $288
Seasonality Insights for Horry County
- Airbnb seasonality in Horry County is pronounced. Revenue swings sharply between peak and low months, which means pricing strategy, minimum-stay settings, and cash reserves all need to account for extended slower periods.
- During the high season, the absolute peak month showcases Horry County's highest earning potential, with monthly revenues climbing to $7,951, occupancy reaching 56.9%, and ADRs peaking at $411.
- Conversely, the slowest single month marks the market's lowest point — revenue may dip to $2,322, occupancy could drop to 23.6%, and ADRs may adjust to $268.
- Lower occupancy paired with meaningful seasonality means hosts in Horry County need to maximize every peak-season booking and seriously consider whether off-season pricing adjustments or minimum-stay changes can capture incremental revenue.
Seasonal Strategies for Maximizing Profit
- Peak Season: Maximize revenue through premium pricing and potentially longer minimum stays. Ensure high availability and consider tightening cancellation policies to reduce last-minute gaps.
- Low Season: Offer competitive pricing, extended-stay discounts, and flexible cancellation policies. Target off-season travelers like remote workers, budget-conscious guests, and travelers with flexible schedules.
- Shoulder Seasons: Implement dynamic pricing that bridges peak and low rates. Target weekend travelers, local events, and business visitors. Slightly more flexible terms than peak season can help maintain occupancy without deep discounting.
- In a highly seasonal market like Horry County, building a cash reserve during the top months is essential for covering fixed costs during the slow period. Automated pricing tools can help capture demand shifts in real time.
Do You Need a License for Airbnb in Horry County?
Low regulation and minimal registration activity in Horry County, South Carolina, United States point to an operator-friendly environment. That said, even low-regulation markets may have tax collection requirements, safety standards, or HOA rules that affect short-term rental operations. Always verify the latest short-term rental regulations and Airbnb license requirements directly with local government authorities for Horry County to ensure full compliance before hosting.
(Source: AirROI data, 2026, finding no licensed listings among those analyzed)
What Are the Best Neighborhoods for Airbnb in Horry County?
Horry County is a smaller vacation rental market where a handful of neighborhoods drive most of the booking activity. Choosing the right area is especially important in boutique markets — there is less room for a mediocre location to succeed on volume alone. The areas below highlight where short-term rental demand is strongest and why.
| Neighborhood / Area | Why Host Here? (Target Guests & Appeal) | Key Attractions & Landmarks |
|---|---|---|
| Myrtle Beach | A popular tourist destination known for its beautiful beaches, boardwalk, and numerous entertainment options. Ideal for families and vacationers looking for a beach getaway. | Myrtle Beach Boardwalk, SkyWheel, Family Kingdom Amusement Park, Broadway at the Beach, Myrtle Beach State Park |
| North Myrtle Beach | Family-friendly area with less crowded beaches and many golf courses. Great for vacation rentals appealing to families and golfers alike. | Cherry Grove Beach, North Myrtle Beach Fishing Pier, Ocean Drive Beach, McLean Park, Barefoot Landing |
| Surfside Beach | A quieter beach town with a relaxed atmosphere. Attracts those looking for a peaceful seaside experience away from the busier Myrtle Beach. | Surfside Beach Pier, Huntington Beach State Park, Garden City Beach, Surfside Beach Central Park |
| Conway | A charming historic town inland from Myrtle Beach. Attracts those looking for a more authentic South Carolina experience away from the hustle of the coast. | Conway Riverwalk, Horenbush Park, Historic Downtown Conway, Rivertown Artists Guild |
| Litchfield Beach | An upscale community with beautiful homes, access to pristine beaches, and a more serene location. Ideal for luxury vacation rentals. | Litchfield Beach, Pawleys Island, Huntington Beach State Park, Brookgreen Gardens |
| Garden City Beach | A family-friendly beach community with a variety of rental options and local dining. Known for its relaxed vibe and accessibility to the beach. | Garden City Pier, Marsh Walk, Atalaya Castle, Huntington Beach State Park |
| Pawleys Island | Famous for its picturesque beaches and historic charm. Attracts those looking for a laid-back vacation spot with a rich history. | Pawleys Island Beach, Pawleys Island Nature Trail, Georgetown County Museum, Huntington Beach State Park |
| Little River | Known for its fishing and close proximity to the beach. Attracts visitors looking for fishing trips and nearby coastal activities. | Little River Waterfront, North Myrtle Beach Casino Boat, La Belle Amie Vineyard, Dinosaur Adventure Golf |
With 8 distinct neighborhoods showing meaningful short-term rental activity, Horry County offers diversification within a single market. Investors can tailor their strategy — from high-turnover tourist zones to quieter residential areas that attract longer stays and remote workers.
What Types of Properties Are on Airbnb in Horry County?
Room Type Distribution
Property Type Distribution
Market Composition Insights for Horry County
- The Horry County Airbnb market composition is heavily skewed towards Entire Home/Apt listings, which make up 100% of the 55 active rentals. This indicates strong guest preference for privacy and space.
- Looking at the property type distribution in Horry County, Apartment/Condo properties are the most common (63.6%), reflecting the local real estate landscape.
- Houses represent a significant 34.5% portion, catering likely to families or larger groups.
- Smaller segments like hotel/boutique (combined 1.8%) offer potential for unique stay experiences.
Horry County Airbnb Room Capacity Analysis (2026): Bedroom Distribution
Distribution of Listings by Number of Bedrooms
Room Capacity Insights for Horry County
- The dominant room capacity in Horry County is 2 bedrooms listings, making up 60% of the market. This suggests a strong demand for properties suitable for couples or solo travelers.
- Together, 2 bedrooms and 3 bedrooms properties represent 83.6% of the active Airbnb listings in Horry County, indicating a high concentration in these sizes.
- A significant 36.3% of listings offer 3+ bedrooms, catering to larger groups and families seeking more space in Horry County.
Horry County Vacation Rental Guest Capacity Trends (2026)
Distribution of Listings by Guest Capacity
Guest Capacity Insights for Horry County
- The most common guest capacity trend in Horry County vacation rentals is listings accommodating 6 guests (45.5%). This suggests the primary traveler segment is likely larger groups.
- Properties designed for 6 guests and 8+ guests dominate the Horry County STR market, accounting for 81.9% of listings.
- 85.5% of properties accommodate 6+ guests, serving the market segment for larger families or group travel in Horry County.
- On average, properties in Horry County are equipped to host 6.5 guests.
How Do Listings in Horry County Compare on Quality?
Listing quality in Horry County can be approximated through presentation depth, bedroom count, and how often hosts disclose exact locations. These signals show how professionally the local supply base is merchandised.
Listing Quality Insights for Horry County
- At 31 photos per listing on average, Horry County hosts invest well in visual presentation. Listings with 20+ photos consistently outperform in search ranking and conversion.
- 78.2% of listings show their exact location. High transparency here builds guest trust and reduces inquiry-to-booking friction.
Recommendations for Hosts
- Use these quality indicators as a self-audit checklist. Listings that exceed the Horry County averages across all three metrics are better positioned for premium pricing.
What Amenities Do Airbnb Guests Expect in Horry County?
Amenity Prevalence
No amenities with partial availability (less than 100%) were found to display in the chart. All essential amenities might be present in all listings. Check insights below.
Amenity Insights for Horry County
- Essential amenities in Horry County that guests expect include: Refrigerator, Air conditioning, Coffee maker, Kitchen, Oven, Wifi, TV, Heating, Dishes and silverware, Microwave. Lacking these (any) could significantly impact bookings.
Recommendations for Hosts
- Ensure your listing includes all essential amenities for Horry County: Refrigerator, Air conditioning, Coffee maker, Kitchen, Oven, Wifi, TV, Heating, Dishes and silverware, Microwave.
- Highlight unique or less common amenities you offer (e.g., hot tub, dedicated workspace, EV charger) in your listing description and photos.
- Regularly check competitor amenities in Horry County to stay competitive.
Which Airbnb Amenities Boost Revenue in Horry County?
Not every amenity matters equally. This table focuses on the amenities most associated with higher revenue in Horry County, which makes it more useful for prioritizing upgrades than a simple popularity list alone.
| Amenity | Prevalence | Revenue With | Revenue Without | Revenue Uplift |
|---|---|---|---|---|
EV charger | 12.7% | $49,676 | $28,699 | 73.1% |
Waterfront | 36.4% | $41,926 | $25,336 | 65.5% |
Outdoor furniture | 29.1% | $43,368 | $26,446 | 64.0% |
Baking sheet | 30.9% | $42,693 | $26,303 | 62.3% |
Pets allowed | 10.9% | $47,420 | $29,403 | 61.3% |
Pool table | 14.5% | $45,655 | $28,937 | 57.8% |
Ethernet connection | 14.5% | $45,583 | $28,949 | 57.5% |
Wine glasses | 27.3% | $42,005 | $27,380 | 53.4% |
Freezer | 30.9% | $39,316 | $27,814 | 41.4% |
Game console | 10.9% | $41,484 | $30,130 | 37.7% |
Revenue Impact Insights for Horry County
- EV charger tops the revenue impact list with a 73.1% uplift — listings with this amenity earn $49,676 vs. $28,699 without it.
Recommendations for Hosts
- Focus your upgrade budget on amenities in the top half of this table. Below-median amenities may improve guest experience but contribute less to revenue growth.
- Highlight revenue-impacting amenities prominently in your listing title, photos, and description — guests can't value what they don't notice.
Dive Deeper: Advanced Horry County STR Market Data (2026)
Ready to unlock more insights? AirROI provides access to advanced metrics and comprehensive Airbnb data for Horry County. Explore detailed analytics beyond this report to refine your investment strategy, optimize pricing, and maximize your vacation rental profits.
Explore Advanced MetricsHorry County Airbnb Guest Demographics & Profile Analysis (2026)
Guest Profile Summary for Horry County
- The typical guest profile for Airbnb in Horry County consists of primarily domestic travelers (95%), often arriving from nearby Charlotte, typically belonging to the Post-2000s (Gen Z/Alpha) group (50%), primarily speaking English or Portuguese.
- Domestic travelers account for 95.2% of guests.
- Key international markets include United States (95.2%) and DC (1.9%).
- Top languages spoken are English (75.5%) followed by Portuguese (5.7%).
- A significant demographic segment is the Post-2000s (Gen Z/Alpha) group, representing 50% of guests.
Recommendations for Hosts
- Target domestic marketing efforts towards travelers from Charlotte and Johnson City.
- Tailor amenities and listing descriptions to appeal to the dominant Post-2000s (Gen Z/Alpha) demographic (e.g., highlight fast WiFi, smart home features, local guides).
- Highlight unique local experiences or amenities relevant to the primary guest profile.
- Consider seasonal promotions aligned with peak travel times for key origin markets.
What Are Airbnb Guest Ratings in Horry County?
Listings in Horry County average 4.77 out of 5 overall, with about 7.1 reviews per active listing and 14.5% of listings carrying the Guest Favorite badge.
Rating Breakdown by Category
Guest Rating Insights for Horry County
- An average rating of 4.77 places Horry County in solid territory. Most guests leave satisfied, though there is room for hosts to push toward the top tier.
- The strongest subcategory is Location (4.92), while Value (4.65) trails behind — a useful signal for hosts looking to prioritize upgrades.
- 14.5% of listings carry the Guest Favorite badge, a strong trust signal that can meaningfully lift click-through and booking rates.
Recommendations for Hosts
- Focus improvement efforts on Value — even small gains in the weakest subcategory can lift overall ratings and search ranking.
- Encourage guests to leave reviews after checkout. Listings with more reviews rank higher in search results and convert browsers into bookers more effectively.
- With only 14.5% of listings earning Guest Favorite status, hosts who consistently exceed expectations have a clear competitive advantage.
Horry County Airbnb Booking Patterns (2026): Available vs. Booked Days
Available Days Distribution
Booked Days Distribution
Booking Pattern Insights for Horry County
- The most common availability pattern in Horry County falls within the 271-366 days range, representing 65.5% of listings. This suggests many properties have significant open periods on their calendars.
- Approximately 94.6% of listings show high availability (181+ days open annually), indicating potential for increased bookings or specific owner usage patterns.
- For booked days, the 31-90 days range is most frequent in Horry County (49.1%), reflecting common guest stay durations or potential owner blocking patterns.
- A notable 5.4% of properties secure long booking periods (181+ days booked per year), highlighting successful long-term rental strategies or significant owner usage.
How Far in Advance Do Guests Book Airbnb in Horry County?
Average Booking Lead Time by Month
Booking Lead Time Insights for Horry County
- The overall average booking lead time for vacation rentals in Horry County is 62 days.
- Guests book furthest in advance for stays during June (average 79 days), likely coinciding with peak travel demand or local events.
- The shortest booking windows occur for stays in January (average 22 days), indicating more last-minute travel plans during this time.
- Seasonally, Summer (72 days avg.) sees the longest lead times, while Winter (36 days avg.) has the shortest, reflecting typical travel planning cycles.
Recommendations for Hosts
- Use the overall average lead time (62 days) as a baseline for your pricing and availability strategy in Horry County.
- For June stays, consider implementing length-of-stay discounts or slightly higher rates for bookings made less than 79 days out to capitalize on advance planning.
- Target marketing efforts for the Summer season well in advance (at least 72 days) to capture early planners.
- Monitor your own booking lead times against these Horry County averages to identify opportunities for dynamic pricing adjustments.
What Is the Average Length of Stay for Airbnb in Horry County?
Guests in Horry County stay about 5.1 nights on average, generating roughly 860 reservations and 15.6 bookings per listing in the latest AirROI dataset. The most common check-in time is 4:00 PM and check-out is 10:00 AM.
Monthly Length of Stay in Horry County
Check-in Time Distribution
Check-out Time Distribution
Stay Pattern Insights for Horry County
- A mid-range stay length points to leisure-driven demand — weekend getaways and short vacations. Hosts should optimize for quick turnover efficiency while keeping the guest experience smooth.
- 15.6 bookings per listing is a manageable pace that balances revenue with operational overhead.
- Stay lengths peak in Nov (7.1 nights) and shorten in Mar (4.1 nights). Adjust minimum-night requirements seasonally to match.
Recommendations for Hosts
- Leverage the longer-stay pattern by offering weekly discounts — even 5-10% off can convert browsing into bookings for guests considering an extended stay.
- Set your check-in time to match or beat the market standard of 4:00 PM. Offering early check-in flexibility can be a low-cost differentiator.
- Monitor length-of-stay seasonality to adjust minimum-night requirements — longer minimums during peak periods maximize revenue while shorter minimums fill gaps in shoulder seasons.
Horry County Airbnb Minimum Stay Requirements Analysis
Distribution of Listings by Minimum Night Requirement
2 Nights
7 listings
12.7% of total
3 Nights
2 listings
3.6% of total
30+ Nights
46 listings
83.6% of total
Key Insights
- The most prevalent minimum stay requirement in Horry County is 30+ Nights, adopted by 83.6% of listings. This highlights the market's preference for longer commitments.
- Very short stays (1-2 nights) are less common (12.7%), suggesting hosts prefer slightly longer bookings to optimize turnover.
- A significant segment (83.6%) caters to monthly stays (30+ nights) in Horry County, pointing to opportunities in the extended-stay market.
Recommendations
- Align with the market by considering a 30+ Nights minimum stay, as 83.6% of Horry County hosts use this setting.
- Explore offering discounts for stays of 30+ nights to attract the 83.6% of the market seeking extended stays.
- Adjust minimum nights based on seasonality – potentially shorter during low season and longer during peak demand periods in Horry County.
Horry County Airbnb Cancellation Policy Trends Analysis (2026)
Super Strict 30 Days
2 listings
3.6% of total
Flexible
2 listings
3.6% of total
Moderate
4 listings
7.3% of total
Firm
43 listings
78.2% of total
Strict
4 listings
7.3% of total
Cancellation Policy Insights for Horry County
- The prevailing Airbnb cancellation policy trend in Horry County is Firm, used by 78.2% of listings.
- A majority (85.5%) of hosts in Horry County utilize Firm or Strict policies, indicating a market where hosts prioritize booking security.
- Strict cancellation policies are quite rare (7.3%), potentially making listings with this policy less competitive unless justified by high demand or property type.
Recommendations for Hosts
- Consider adopting a Firm policy to align with the 78.2% market standard in Horry County.
- Using a Strict policy might deter some guests, as only 7.3% of listings use it. Evaluate if potential revenue protection outweighs possible lower booking rates.
- Regularly review your cancellation policy against competitors and market demand shifts in Horry County.
How Much Are Airbnb Cleaning Fees in Horry County?
Cleaning fees in Horry County are meaningful operating levers, not just pass-through charges. What matters most is how often hosts charge them, how high they run relative to market norms, and how large a share of gross revenue they consume.
Cleaning Fee Insights for Horry County
- 100.0% of listings charge a cleaning fee, making it standard practice in Horry County. Guests expect it and factor it into their booking decisions.
- The average cleaning fee of $406 is close to the median ($475), suggesting a relatively consistent fee structure across the market.
- Cleaning fees represent 19.7% of gross revenue on average — a significant line item that impacts total guest cost and competitiveness.
Recommendations for Hosts
- Price your cleaning fee competitively against the Horry County median of $475. Fees significantly above market norms can deter bookings, especially for shorter stays.
- Consider whether bundling the cleaning fee into a slightly higher nightly rate might improve conversion, since many guests filter by total price and separate fees can feel punitive.
- Monitor competitor cleaning fees regularly. Airbnb's search algorithm factors in total price, so a well-calibrated cleaning fee can improve your listing's ranking.
What Do the Top Airbnb Listings in Horry County Look Like?
Benchmark your potential! Explore examples of top-performing Airbnb properties in Horry Countybased on Trailing Twelve Month (TTM) revenue. Analyze their characteristics, revenue, occupancy rate, and ADR to understand what drives success in this market.

Luxury Waterfront Home in Ocean Lakes
Entire Place • 4 bedrooms

Serene waterfron retreat-Near golf Beach Barefoot
Entire Place • 5 bedrooms
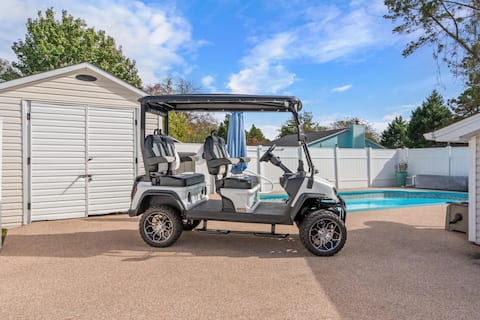
Private Pool Luxe Golf Cart (By Beach Star)
Entire Place • 2 bedrooms

Luxury waterfron retreat-Near golf Beach Barefoot
Entire Place • 4 bedrooms
Family fun with amazing amenities + Free Attractio
Entire Place • 3 bedrooms

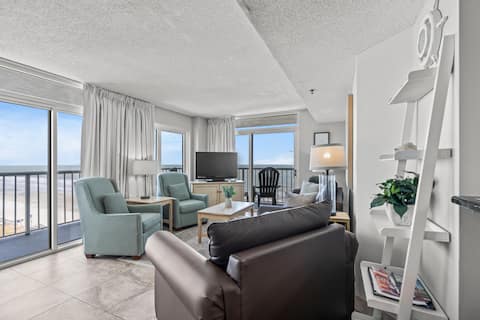
Completely Renovated Ocean View Unit + Free Attrac
Entire Place • 2 bedrooms
Note: Performance varies based on location, size, amenities, seasonality, and management quality. Data reflects the past 12 months.
Who Are the Top Airbnb Hosts in Horry County?
Learn from the best! This table showcases top-performing Airbnb hosts in Horry County based on the number of properties managed and estimated total revenue over the past year. Analyze their scale and performance metrics.
| Host Name | Properties | Grossing Revenue | Stay Reviews | Avg Rating |
|---|---|---|---|---|
| North Beach Vacations | 31 | $895,237 | 75 | 4.64/5.0 |
| Michelle And Jason | 5 | $278,839 | 52 | 4.97/5.0 |
| Fried Fish Vacation Rentals | 3 | $198,881 | 91 | 4.86/5.0 |
| Tawnya | 2 | $94,194 | 9 | 5.00/5.0 |
| Barrett | 1 | $72,905 | 51 | 4.94/5.0 |
| RedAwning | 2 | $46,634 | 3 | Not Rated |
| Amy | 2 | $43,787 | 7 | 4.80/5.0 |
| Steven With Myrtle Beach Desti | 1 | $24,894 | 10 | 5.00/5.0 |
| Anita | 1 | $15,057 | 20 | 4.75/5.0 |
| B2 Vacations | 1 | $12,400 | 15 | 4.60/5.0 |
Analyzing the strategies of top hosts, such as their property selection, pricing, and guest communication, can offer valuable lessons for optimizing your own Airbnb operations in Horry County.
Who Are the Airbnb Hosts in Horry County?
Horry County leans more toward professional operations than casual hosting, which usually raises the competitive bar for new entrants.
Host Profile Insights for Horry County
- Only 25.5% of hosts hold Superhost status, suggesting a relatively young or casual market where quality improvements can pay outsized dividends.
- 89.1% of listings are professionally managed, indicating a mature, competitive market with institutional players.
- 9.1% of listings have Instant Book enabled. Lower Instant Book adoption means many guests must request approval, which can slow conversions.
- 90.9% of listings use Airbnb's simplified pricing (host-only fee), where the host pays the entire platform service fee and the guest sees one all-in price with no separate Airbnb service charge. High adoption signals a professional, PMS-connected host base — Airbnb mandates simplified pricing for software-connected listings.
Recommendations for Hosts
- Earning Superhost status can significantly improve search ranking and guest trust. Focus on maintaining high response rates, low cancellations, and strong reviews.
- Consider enabling Instant Book — it reduces booking friction and Airbnb's algorithm tends to favor Instant Book listings in search results.
- Benchmark your host metrics against these Horry County averages regularly and adjust your hosting strategy based on what top performers do differently.
Top Professional Management Companies in Horry County
These are the highest-grossing professional property management operations in Horry County, ranked by total revenue across their portfolio. Their performance metrics offer a benchmark for what institutional-level hosting looks like in this market.
| Company | Listings | Revenue | ADR | Occ. | Rating |
|---|---|---|---|---|---|
| North Beach Vacations | 31 | $895,237 | $308 | 37.7% | 4.64/5 |
| Michelle And Jason | 5 | $278,839 | $361 | 52.8% | 4.97/5 |
| Fried Fish Vacation Rentals | 3 | $198,881 | $497 | 41.3% | 4.86/5 |
| Tawnya | 2 | $94,194 | $553 | 35.5% | 5.00/5 |
| Barrett | 1 | $72,905 | $301 | 63.4% | 4.94/5 |
| RedAwning | 2 | $46,634 | $457 | 21.6% | N/A |
| Amy | 2 | $43,787 | $327 | 39.3% | 4.80/5 |
| Steven With Myrtle Beach Desti | 1 | $24,894 | $286 | 53.8% | 5.00/5 |
| B2 Vacations | 1 | $12,400 | $348 | 20.2% | 4.60/5 |
| Evolve | 2 | $8,368 | $262 | 10.9% | 4.69/5 |
Management Company Insights for Horry County
- The leading management company, North Beach Vacations, operates 31 listings with $895,237 in gross revenue — a useful benchmark for what scale looks like in Horry County.
- Top managers average 5 properties each, suggesting professional management in Horry County still operates at a relatively boutique scale.
- Professionally managed listings in the top tier average 4.83/5 in guest ratings — demonstrating that scale and quality can coexist.
Recommendations
- Study how top management companies price, position, and maintain their portfolios — their ADR and occupancy rates reflect strategies refined across dozens of listings.
- If you're considering hiring a property manager, compare their portfolio performance against these benchmarks before committing.
How Does Horry County's Airbnb Market Compare to Nearby Cities?
How does the Horry County Airbnb market stack up against its neighbors? Compare key performance metrics like average monthly revenue, ADR, and occupancy rates in surrounding areas to understand the broader regional STR landscape.
Compared with Mount Pleasant, Horry County has 15 percentage points lower occupancy and about $21 higher ADR. That helps frame whether this market is winning more on demand, pricing, or both.
| Market | Active Properties | Monthly Revenue | Daily Rate | Avg. Occupancy |
|---|---|---|---|---|
| Isle of Palms | 1,004 | $7,121 | $765.33 | 41% |
| Sullivan's Island | 21 | $7,072 | $919.55 | 40% |
| Folly Beach | 896 | $7,014 | $603.49 | 45% |
| Charleston | 1,802 | $5,555 | $409.38 | 51% |
| Ocean Isle Beach | 500 | $4,844 | $607.76 | 37% |
| Wrightsville Beach | 496 | $4,595 | $544.95 | 38% |
| Mount Pleasant | 448 | $4,417 | $312.48 | 53% |
| Bald Head Island | 205 | $4,300 | $647.62 | 32% |
| Kure Beach | 495 | $3,850 | $452.76 | 41% |
| Cedar Point | 30 | $3,685 | $337.53 | 45% |
Frequently Asked Questions About Airbnb in Horry County
These quick answers summarize the most common investor and operator questions using AirROI's latest market data for Horry County.
How much do Airbnb hosts make in Horry County?
Horry County hosts earn about $31,369 per year on average, with an average nightly rate of $333 and RevPAR of $138. Those figures describe the typical revenue environment for active listings in Horry County, South Carolina, not the ceiling for the best operators. Source: AirROI 2026 data, Horry County market, May 2025 to April 2026.
What is the average Airbnb occupancy rate in Horry County?
The average Airbnb occupancy rate in Horry County is 37.6%. July is the strongest month and January is the softest, so hosts should expect demand to move meaningfully throughout the year rather than stay flat.
What is the average Airbnb daily rate in Horry County?
Listings in Horry County average $333 per night. The broader pricing spread also matters: lower-performing listings cluster closer to the lower quartiles, while premium homes can price materially above the city average when demand spikes or listing quality stands out.
How many Airbnb listings are active in Horry County?
Horry County currently has about 55 active Airbnb listings in AirROI's market dataset. That supply count helps explain how competitive the market is, how much depth there is for benchmarking, and whether the market behaves like a niche destination or a scaled urban market.
How strict are short-term rental regulations in Horry County?
AirROI currently classifies the short-term rental regulation level in Horry County as Low. The dataset also shows about 0.0% of listings with registration evidence. That is a market signal, not legal advice, so hosts should still confirm current licensing and compliance rules locally before listing.
What is the RevPAR for Airbnb in Horry County?
RevPAR in Horry County is about $138. That metric combines pricing and occupancy into one efficiency number, so it is often a better quick benchmark than ADR alone when investors want to compare how well listings convert nightly rates into realized revenue.
Is Airbnb profitable in Horry County?
Occupancy of 37.6% means Horry County is a more selective market. Profitability is achievable but requires careful cost management, premium positioning, or targeting longer stays to reduce turnover. Average annual revenue is $31,369, but individual returns depend on property type, location within the city, and the host's operating efficiency.
How far in advance do guests book Airbnb in Horry County?
The average booking lead time in Horry County is about 62 days — a longer planning horizon typical of destination or vacation markets where travelers book well in advance. Hosts who understand their market's booking cadence can adjust minimum stays and pricing windows accordingly.
What are the best neighborhoods for Airbnb in Horry County?
Based on AirROI's analysis, some of the top neighborhoods for short-term rentals in Horry County include Myrtle Beach, North Myrtle Beach, Surfside Beach. Each area attracts different guest profiles — from business travelers to leisure visitors — so the best location depends on the property type and target audience a host is aiming for. See the full neighborhood breakdown above.
What type of property performs best on Airbnb in Horry County?
entire_home listings make up 100.0% of the active supply in Horry County. The most common configuration does not always mean the most profitable — operators who identify underserved property types or bedroom counts can sometimes outperform the market average by filling a gap in local supply.
How does Horry County compare to nearby Airbnb markets?
Among neighboring markets, Isle of Palms posts $85,457 in average annual revenue with 40.9% occupancy, compared to Horry County's $31,369 and 37.6%. Comparing nearby markets helps investors understand whether a destination's performance reflects local demand or broader regional trends.
What is the average length of stay in Horry County?
The average Airbnb stay length in Horry County is about 5.1 nights. That matters for turnover, cleaning operations, and pricing strategy because shorter stays increase changeovers while longer stays can smooth occupancy and reduce operational friction.
What is the average Airbnb guest rating in Horry County?
Airbnb listings in Horry County average 4.77 out of 5 overall. About 14.5% of listings carry the guest favorite badge, which suggests a meaningful share of inventory is competing on review quality rather than price alone.
Which amenities boost Airbnb revenue in Horry County?
EV charger and Waterfront are among the strongest revenue-linked amenities in Horry County. In AirROI's latest dataset, listings with these amenities outperform those without on average revenue, which makes amenities analysis useful for prioritizing investment and listing upgrades.
Do Airbnb hosts charge cleaning fees in Horry County?
Yes. About 100.0% of active Airbnb listings in Horry County charge a cleaning fee, and the average fee is $406. The more important operating benchmark is how much of gross revenue that fee consumes, not just the absolute dollar amount.
What percentage of Airbnb hosts are Superhosts in Horry County?
At 25.5%, there is a healthy mix of experienced and newer hosts — earning Superhost status can still provide a meaningful visibility boost.
About AirROI Market Data
AirROI tracks over 20 million properties across 190+ countries and maintains 15+ years of historical performance data, making it one of the deepest Airbnb and STR intelligence platforms available. The analytics pipeline aggregates listing-level data monthly — revenue, occupancy, nightly rates, RevPAR, guest demographics, booking patterns, and competitive supply — so investors and operators can benchmark any market against its own history and against neighboring destinations.
Real estate investors, property managers, financial institutions, hedge funds, tourism boards, hospitality consultants, tech platforms, and academic researchers rely on AirROI data to underwrite acquisitions, optimize pricing, model macro trends, and conduct peer-reviewed research. Data is available through in-depth market reports like this one and the Airbnb API with 22 endpoints and an Airbnb MCP Server for AI agents.
AirROI proprietary analytics as of 2026-04-30. Metrics reflect trailing twelve-month aggregates from active listings. Revenue figures are market averages, not projections. Neighborhood descriptions are AI-generated and reviewed for accuracy. For full methodology, see the data methodology page.