Quebrada Bonita, Antioquia Airbnb Market Data 2025: STR Report & Statistics
How much can you earn on Airbnb in Quebrada Bonita, Antioquia? Based on AirROI's 2025 dataset (October 2024 – September 2025), the short answer is $4,644 per year — at a $81 nightly rate, 19.6% occupancy, and a N/A RevPAR.
With just 17 active listings, Quebrada Bonita is a micro-market where selective demand that rewards strong listing quality and pricing strategy. Supply grew 6.3% and nightly rates have risen, creating an environment where the most bookable listings stand to capture outsized share. Hosts who pair competitive pricing with strong guest experience are well-positioned to convert the growing traveler base into consistent bookings.
Regulation is high, and hosts should factor licensing costs and compliance timelines into their launch plan. In a market this size, differentiated listings with strong reviews can capture outsized returns relative to the competition.
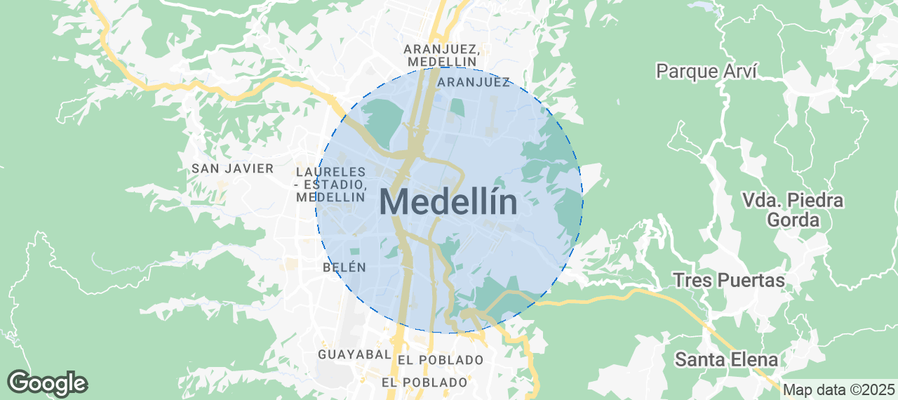
Table of Contents [hide] [show]
What Are the Key Airbnb Metrics in Quebrada Bonita?
In Quebrada Bonita, the headline Airbnb metrics are $4,644 in average annual revenue,19.6% occupancy, $81 ADR, and $0 in RevPAR, and guests book about 58 days in advance.
How Much Do Airbnb Hosts Earn Monthly in Quebrada Bonita?
Understanding the monthly revenue variations for Airbnb listings in Quebrada Bonita is key to maximizing your short term rental income potential. Seasonality significantly impacts earnings. Our analysis, based on data from the past 12 months, shows that the peak revenue month for STRs in Quebrada Bonita is typically December, while September often presents the lowest earnings, highlighting opportunities for strategic pricing adjustments during shoulder and low seasons. Explore the typical Airbnb income in Quebrada Bonita across different performance tiers:
- Best-in-class properties (Top 10%) achieve $1,676+ monthly, often utilizing dynamic pricing and superior guest experiences.
- Strong performing properties (Top 25%) earn $1,136 or more, indicating effective management and desirable locations/amenities.
- Typical properties (Median) generate around $548 per month, representing the average market performance.
- Entry-level properties (Bottom 25%) see earnings around $278, often with potential for optimization.
Average Monthly Airbnb Earnings Trend in Quebrada Bonita
What Is the Monthly Airbnb Occupancy Rate in Quebrada Bonita?
Maximize your bookings by understanding the Quebrada Bonita STR occupancy trends. Seasonal demand shifts significantly influence how often properties are booked. Typically, Decembersees the highest demand (peak season occupancy), while September experiences the lowest (low season). Effective strategies, like adjusting minimum stays or offering promotions, can boost occupancy during slower periods. Here's how different property tiers perform in Quebrada Bonita:
- Best-in-class properties (Top 10%) achieve 43%+ occupancy, indicating high desirability and potentially optimized availability.
- Strong performing properties (Top 25%) maintain 33% or higher occupancy, suggesting good market fit and guest satisfaction.
- Typical properties (Median) have an occupancy rate around 20%.
- Entry-level properties (Bottom 25%) average 14% occupancy, potentially facing higher vacancy.
Average Monthly Occupancy Rate Trend in Quebrada Bonita
What Is the Average Airbnb Nightly Rate in Quebrada Bonita?
Effective short term rental pricing strategy in Quebrada Bonita involves understanding monthly ADR fluctuations. The Average Daily Rate (ADR) for Airbnb in Quebrada Bonita typically peaks in June and dips lowest during February. Leveraging Airbnb dynamic pricing tools or strategies based on this seasonality can significantly boost revenue. Here's a look at the typical nightly rates achieved:
- Best-in-class properties (Top 10%) command rates of $147+ per night, often due to premium features or locations.
- Strong performing properties (Top 25%) achieve nightly rates of $101 or more.
- Typical properties (Median) charge around $76 per night.
- Entry-level properties (Bottom 25%) earn around $44 per night.
Average Daily Rate (ADR) Trend by Month in Quebrada Bonita
What Is the RevPAR for Airbnb in Quebrada Bonita?
RevPAR in Quebrada Bonita is currently N/A. Because RevPAR combines nightly rates with realized occupancy, it is one of the cleanest ways to compare how efficiently listings turn demand into revenue across the market.
- Entry-level properties (Bottom 25%) see N/A RevPAR.
- Typical properties (Median) generate N/A RevPAR.
- Strong performers (Top 25%) earn N/A RevPAR.
- Best-in-class (Top 10%) achieve N/A RevPAR.
Average Monthly RevPAR Trend in Quebrada Bonita
RevPAR Insights for Quebrada Bonita
- RevPAR peaks in Jan and bottoms out in Jan, mirroring the broader seasonal demand pattern and suggesting opportunities for dynamic pricing.
Recommendations for Hosts
- Track your own RevPAR monthly against these Quebrada Bonita benchmarks. If your RevPAR falls below the median of N/A, examine whether low occupancy or low ADR is the primary drag.
- Use RevPAR rather than revenue alone when comparing properties of different sizes — it normalizes for available nights and gives a more accurate picture of performance.
Get Live Quebrada Bonita Market Intelligence 👇
Explore Real-time Analytics
When Is the Peak Season for Airbnb in Quebrada Bonita?
Quebrada Bonita's peak Airbnb season falls in December, April, January, while the softest stretch is August, September, October. Overall, the market shows highly seasonal trends requiring careful strategy, which should guide pricing, minimum stays, and cash-flow planning.
Peak Season (December, April, January)
- Revenue averages $1,183 per month
- Occupancy rates average 34.4%
- Daily rates average $78
Shoulder Season
- Revenue averages $729 per month
- Occupancy maintains around 23.2%
- Daily rates hold near $80
Low Season (August, September, October)
- Revenue drops to average $446 per month
- Occupancy decreases to average 16.9%
- Daily rates adjust to average $81
Seasonality Insights for Quebrada Bonita
- Airbnb seasonality in Quebrada Bonita is pronounced. Revenue swings sharply between peak and low months, which means pricing strategy, minimum-stay settings, and cash reserves all need to account for extended slower periods.
- During the high season, the absolute peak month showcases Quebrada Bonita's highest earning potential, with monthly revenues climbing to $1,377, occupancy reaching 39.1%, and ADRs peaking at $89.
- Conversely, the slowest single month marks the market's lowest point — revenue may dip to $335, occupancy could drop to 12.4%, and ADRs may adjust to $75.
- Lower occupancy paired with meaningful seasonality means hosts in Quebrada Bonita need to maximize every peak-season booking and seriously consider whether off-season pricing adjustments or minimum-stay changes can capture incremental revenue.
Seasonal Strategies for Maximizing Profit
- Peak Season: Maximize revenue through premium pricing. In a high-regulation market like Quebrada Bonita, ensure your permit covers the number of nights you plan to book — some jurisdictions cap annual rental days.
- Low Season: Offer competitive pricing, extended-stay discounts, and flexible cancellation policies. Target off-season travelers like remote workers, budget-conscious guests, and travelers with flexible schedules.
- Shoulder Seasons: Implement dynamic pricing that bridges peak and low rates. Target weekend travelers, local events, and business visitors. Slightly more flexible terms than peak season can help maintain occupancy without deep discounting.
- In a highly seasonal market like Quebrada Bonita, building a cash reserve during the top months is essential for covering fixed costs during the slow period. Automated pricing tools can help capture demand shifts in real time.
Do You Need a License for Airbnb in Quebrada Bonita?
Quebrada Bonita, Antioquia, Colombia has a high regulation classification, yet only 41% of listings show registration evidence. That gap between regulation on the books and compliance on the ground can shift quickly — municipalities often tighten enforcement in waves, putting unregistered operators at risk of fines or delisting. Always verify the latest short-term rental regulations and Airbnb license requirements directly with local government authorities for Quebrada Bonita to ensure full compliance before hosting.
(Source: AirROI data, 2026, based on 41% licensed listings)
What Are the Best Neighborhoods for Airbnb in Quebrada Bonita?
With a compact short-term rental market, Quebrada Bonita gives early-mover hosts an advantage in the right neighborhoods. The areas listed below are where guest demand and local attractions converge — a useful lens for investors evaluating whether to enter this market and where to position their listing.
| Neighborhood / Area | Why Host Here? (Target Guests & Appeal) | Key Attractions & Landmarks |
|---|---|---|
| Parque Arví | A natural park famous for its rich biodiversity, offering scenic hikes and outdoor activities. Attracts eco-tourists and nature lovers seeking a peaceful retreat close to the city. | Cable Car to the park, Eco-tourism trails, Local flora and fauna, Bird watching, Picnic areas |
| Guatapé | A picturesque lakeside town known for its colorful zócalos (decorative panels) and the El Peñol rock. Popular for families and outdoor enthusiasts looking for adventure and relaxation. | El Peñol rock, Guatapé Lake, Water sports, Zócalos tours, Boat rides |
| La Ceja | A charming town that combines urban convenience with rural tranquility. Draws visitors seeking an authentic Colombian experience and those interested in local agriculture and culture. | Local coffee farms, Cultural festivals, Charming town square, Nearby trails |
| Medellín - El Poblado | The most upscale neighborhood in Medellín, known for its nightlife, dining, and shopping. Ideal for urban tourists and high-end travelers. | Lleras Park, Shopping malls, Fine dining, Nightclubs, Art galleries |
| San Carlos | A tranquil town known for its beautiful landscapes and proximity to nature reserves. Appeals to tourists looking for a peaceful retreat and outdoor activities. | Natural reserves, Hiking, Birdwatching, Cultural sites |
| Sonsón | A quaint town famous for its coffee production and stunning vistas. Perfect for travelers looking to explore rural Colombia and enjoy local culture. | Coffee farms, Beautiful viewpoints, Traditional markets, Local festivals |
| Jardín | A colorful town known for its charming downtown and beautiful mountain scenery. Attracts visitors looking to experience authentic Colombian small-town life. | Central plaza, Coffee tours, Breathtaking landscapes, Hiking trails |
| Cocorná | This small town is known for its nature and adventure activities, including paragliding and exploring the lush surroundings. It's perfect for thrill-seekers and nature lovers. | Paragliding, Natural parks, Rivers and waterfalls, Local cuisine |
Because Quebrada Bonita has a high regulation profile, confirming that short-term rental permits are available in your target neighborhood is a critical first step before committing to a property purchase. Regulation can vary at the neighborhood or district level even within the same city.
What Types of Properties Are on Airbnb in Quebrada Bonita?
Room Type Distribution
Property Type Distribution
Market Composition Insights for Quebrada Bonita
- The Quebrada Bonita Airbnb market composition is heavily skewed towards Private Room listings, which make up 70.6% of the 17 active rentals. This indicates strong guest preference for privacy and space.
- Looking at the property type distribution in Quebrada Bonita, Hotel/Boutique properties are the most common (64.7%), reflecting the local real estate landscape.
- Houses represent a significant 17.6% portion, catering likely to families or larger groups.
- The presence of 64.7% Hotel/Boutique listings indicates integration with traditional hospitality.
Quebrada Bonita Airbnb Room Capacity Analysis (2026): Bedroom Distribution
Distribution of Listings by Number of Bedrooms
Room Capacity Insights for Quebrada Bonita
- The dominant room capacity in Quebrada Bonita is 1 bedroom listings, making up 58.8% of the market. This suggests a strong demand for properties suitable for couples or solo travelers.
- Together, 1 bedroom and 2 bedrooms properties represent 76.4% of the active Airbnb listings in Quebrada Bonita, indicating a high concentration in these sizes.
- With over half the market (58.8%) consisting of studios or 1-bedroom units, Quebrada Bonita is particularly well-suited for individuals or couples.
Quebrada Bonita Vacation Rental Guest Capacity Trends (2026)
Distribution of Listings by Guest Capacity
Guest Capacity Insights for Quebrada Bonita
- The most common guest capacity trend in Quebrada Bonita vacation rentals is listings accommodating 2 guests (47.1%). This suggests the primary traveler segment is likely couples or solo travelers.
- Properties designed for 2 guests and 8+ guests dominate the Quebrada Bonita STR market, accounting for 70.6% of listings.
- A significant 47.1% of listings cater specifically to 1-2 guests, highlighting strong demand from couples and solo travelers in Quebrada Bonita.
- 23.5% of properties accommodate 6+ guests, serving the market segment for larger families or group travel in Quebrada Bonita.
- On average, properties in Quebrada Bonita are equipped to host 3.8 guests.
What Amenities Do Airbnb Guests Expect in Quebrada Bonita?
Amenity Prevalence
Amenity Insights for Quebrada Bonita
- Essential amenities in Quebrada Bonita that guests expect include: Free parking on premises. Lacking these (this) could significantly impact bookings.
- Popular amenities like Wifi, Essentials, TV are common but not universal. Offering these can provide a competitive edge.
- Warning: Wifi is not universally provided but is considered essential globally. Ensure reliable Wifi is offered.
Recommendations for Hosts
- Ensure your listing includes all essential amenities for Quebrada Bonita: Free parking on premises.
- Consider adding popular differentiators like Wifi or Essentials to increase appeal.
- Highlight unique or less common amenities you offer (e.g., hot tub, dedicated workspace, EV charger) in your listing description and photos.
- Regularly check competitor amenities in Quebrada Bonita to stay competitive.
Dive Deeper: Advanced Quebrada Bonita STR Market Data (2026)
Ready to unlock more insights? AirROI provides access to advanced metrics and comprehensive Airbnb data for Quebrada Bonita. Explore detailed analytics beyond this report to refine your investment strategy, optimize pricing, and maximize your vacation rental profits.
Explore Advanced MetricsQuebrada Bonita Airbnb Guest Demographics & Profile Analysis (2026)
Guest Profile Summary for Quebrada Bonita
- The typical guest profile for Airbnb in Quebrada Bonita consists of a mix of domestic (47%) and international guests, with top international origins including United States, typically belonging to the Post-2000s (Gen Z/Alpha) group (50%), primarily speaking Spanish or English.
- Domestic travelers account for 46.7% of guests.
- Key international markets include Colombia (46.7%) and United States (21.5%).
- Top languages spoken are Spanish (47.6%) followed by English (39.5%).
- A significant demographic segment is the Post-2000s (Gen Z/Alpha) group, representing 50% of guests.
Recommendations for Hosts
- Balance marketing efforts between domestic and international channels based on the guest mix.
- Tailor amenities and listing descriptions to appeal to the dominant Post-2000s (Gen Z/Alpha) demographic (e.g., highlight fast WiFi, smart home features, local guides).
- Highlight unique local experiences or amenities relevant to the primary guest profile.
- Consider seasonal promotions aligned with peak travel times for key origin markets.
Quebrada Bonita Airbnb Booking Patterns (2026): Available vs. Booked Days
Available Days Distribution
Booked Days Distribution
Booking Pattern Insights for Quebrada Bonita
- The most common availability pattern in Quebrada Bonita falls within the 271-366 days range, representing 82.4% of listings. This suggests many properties have significant open periods on their calendars.
- Approximately 100.0% of listings show high availability (181+ days open annually), indicating potential for increased bookings or specific owner usage patterns.
- For booked days, the 1-30 days range is most frequent in Quebrada Bonita (47.1%), reflecting common guest stay durations or potential owner blocking patterns.
How Far in Advance Do Guests Book Airbnb in Quebrada Bonita?
Average Booking Lead Time by Month
Booking Lead Time Insights for Quebrada Bonita
- The overall average booking lead time for vacation rentals in Quebrada Bonita is 58 days.
- Guests book furthest in advance for stays during November (average 101 days), likely coinciding with peak travel demand or local events.
- The shortest booking windows occur for stays in June (average 10 days), indicating more last-minute travel plans during this time.
- Seasonally, Fall (69 days avg.) sees the longest lead times, while Spring (19 days avg.) has the shortest, reflecting typical travel planning cycles.
Recommendations for Hosts
- Use the overall average lead time (58 days) as a baseline for your pricing and availability strategy in Quebrada Bonita.
- For November stays, consider implementing length-of-stay discounts or slightly higher rates for bookings made less than 101 days out to capitalize on advance planning.
- During June, focus on last-minute booking availability and promotions, as guests book with very short notice (10 days avg.).
- Target marketing efforts for the Fall season well in advance (at least 69 days) to capture early planners.
- Monitor your own booking lead times against these Quebrada Bonita averages to identify opportunities for dynamic pricing adjustments.
Quebrada Bonita Airbnb Minimum Stay Requirements Analysis
Distribution of Listings by Minimum Night Requirement
1 Night
17 listings
100% of total
Key Insights
- The most prevalent minimum stay requirement in Quebrada Bonita is 1 Night, adopted by 100% of listings. This highlights the market's preference for shorter, flexible bookings.
- A strong majority (100.0%) of the Quebrada Bonita Airbnb data shows acceptance of very short stays (1-2 nights), indicating a dynamic, high-turnover market.
Recommendations
- Align with the market by considering a 1 Night minimum stay, as 100% of Quebrada Bonita hosts use this setting.
- Adjust minimum nights based on seasonality – potentially shorter during low season and longer during peak demand periods in Quebrada Bonita.
Quebrada Bonita Airbnb Cancellation Policy Trends Analysis (2026)
Flexible
3 listings
17.6% of total
Moderate
4 listings
23.5% of total
Firm
10 listings
58.8% of total
Cancellation Policy Insights for Quebrada Bonita
- The prevailing Airbnb cancellation policy trend in Quebrada Bonita is Firm, used by 58.8% of listings.
- A majority (58.8%) of hosts in Quebrada Bonita utilize Firm or Strict policies, indicating a market where hosts prioritize booking security.
Recommendations for Hosts
- Consider adopting a Firm policy to align with the 58.8% market standard in Quebrada Bonita.
- Regularly review your cancellation policy against competitors and market demand shifts in Quebrada Bonita.
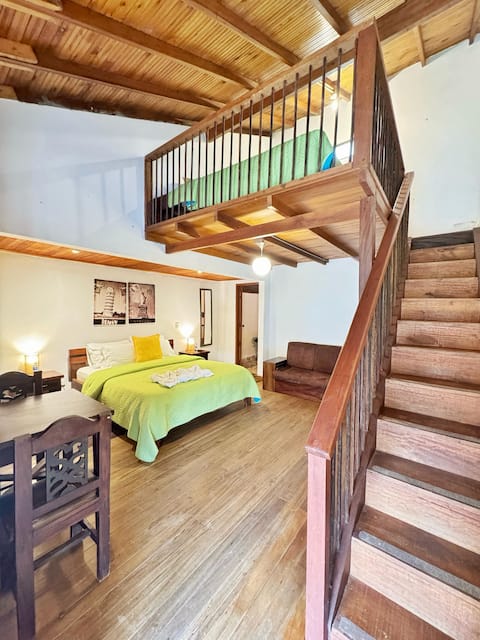
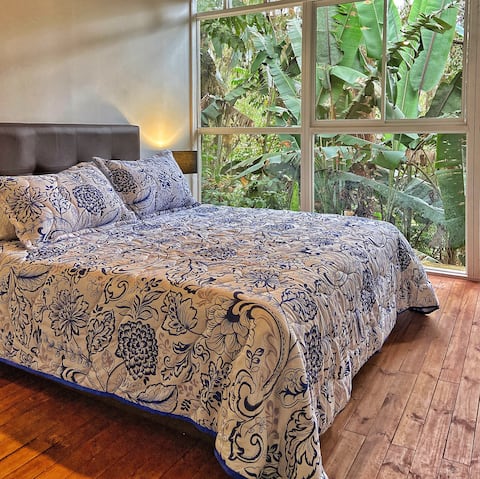
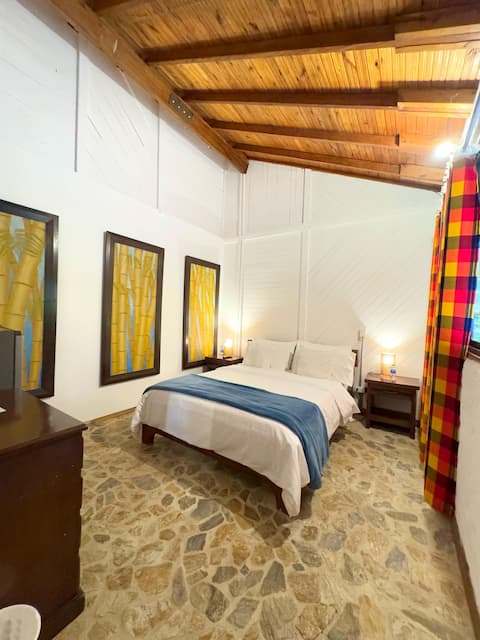
What Do the Top Airbnb Listings in Quebrada Bonita Look Like?
Benchmark your potential! Explore examples of top-performing Airbnb properties in Quebrada Bonitabased on Trailing Twelve Month (TTM) revenue. Analyze their characteristics, revenue, occupancy rate, and ADR to understand what drives success in this market.
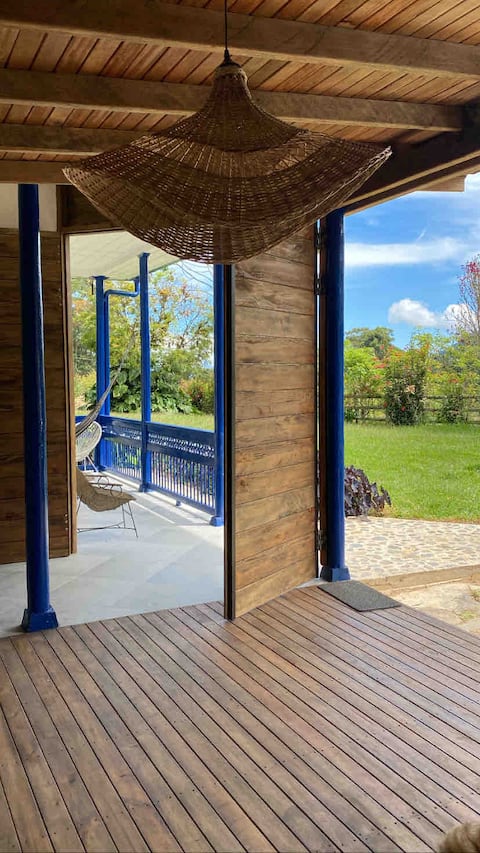
Hacienda la Serrania - Jacuzzi and nature!!
Entire Place • 4 bedrooms
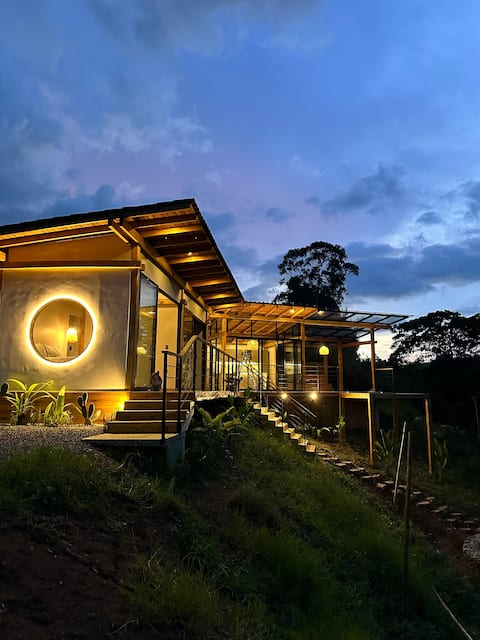
Garden of Eden Jacuzzi & Nature
Entire Place • 2 bedrooms
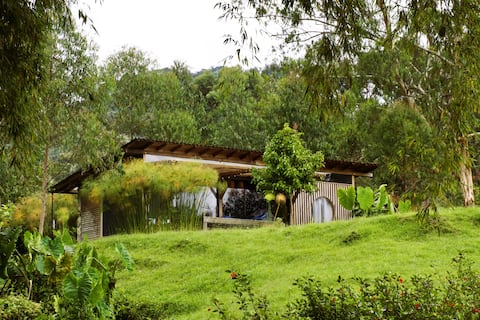
La Serranía Chalet, birds, and nature
Entire Place • 2 bedrooms
Beautiful Junior Lancelot Suite - Jacuzzi
Private Room • 1 bedroom
SPECTACULAR COUNTRY CABIN JACUZZI/LIVING ROOM/DECK
Private Room • 2 bedrooms
Standard Room with Jacuzzi - Diosa Morgana
Private Room • 1 bedroom
Note: Performance varies based on location, size, amenities, seasonality, and management quality. Data reflects the past 12 months.
Who Are the Top Airbnb Hosts in Quebrada Bonita?
Learn from the best! This table showcases top-performing Airbnb hosts in Quebrada Bonita based on the number of properties managed and estimated total revenue over the past year. Analyze their scale and performance metrics.
| Host Name | Properties | Grossing Revenue | Stay Reviews | Avg Rating |
|---|---|---|---|---|
| Camilo | 2 | $26,489 | 330 | 4.83/5.0 |
| Avalon Hotel En Jardin | 7 | $21,009 | 48 | 4.51/5.0 |
| Valentina | 1 | $19,031 | 95 | 4.94/5.0 |
| Avalon | 2 | $9,773 | 24 | 4.77/5.0 |
| Daniel | 1 | $1,572 | 3 | 5.00/5.0 |
| Luz Marina | 2 | $785 | 12 | 5.00/5.0 |
| José Miguel | 2 | $292 | 179 | 4.62/5.0 |
Analyzing the strategies of top hosts, such as their property selection, pricing, and guest communication, can offer valuable lessons for optimizing your own Airbnb operations in Quebrada Bonita.
How Does Quebrada Bonita's Airbnb Market Compare to Nearby Cities?
How does the Quebrada Bonita Airbnb market stack up against its neighbors? Compare key performance metrics like average monthly revenue, ADR, and occupancy rates in surrounding areas to understand the broader regional STR landscape.
Compared with San Nicolás, Quebrada Bonita has 13 percentage points lower occupancy and about $262 lower ADR. That helps frame whether this market is winning more on demand, pricing, or both.
| Market | Active Properties | Monthly Revenue | Daily Rate | Avg. Occupancy |
|---|---|---|---|---|
| San Nicolás | 19 | $3,150 | $342.96 | 33% |
| Cauca Viejo | 28 | $2,229 | $285.73 | 28% |
| Apulo | 97 | $1,709 | $276.95 | 24% |
| Antioquia | 14 | $1,698 | $303.27 | 27% |
| Anapoima | 300 | $1,686 | $269.04 | 26% |
| Córdoba | 25 | $1,672 | $264.80 | 22% |
| Cundinamarca | 11 | $1,421 | $193.39 | 25% |
| Sopetrán | 160 | $1,175 | $218.99 | 22% |
| Popalito | 11 | $1,111 | $221.69 | 22% |
| El Peñol | 284 | $1,030 | $169.51 | 25% |
Frequently Asked Questions About Airbnb in Quebrada Bonita
These quick answers summarize the most common investor and operator questions using AirROI's latest market data for Quebrada Bonita.
How much do Airbnb hosts make in Quebrada Bonita?
Quebrada Bonita hosts earn about $4,644 per year on average, with an average nightly rate of $81 and RevPAR of N/A. Those figures describe the typical revenue environment for active listings in Quebrada Bonita, Antioquia, not the ceiling for the best operators. Source: AirROI 2025 data, Quebrada Bonita market, October 2024 to September 2025.
What is the average Airbnb occupancy rate in Quebrada Bonita?
The average Airbnb occupancy rate in Quebrada Bonita is 19.6%. December is the strongest month and September is the softest, so hosts should expect demand to move meaningfully throughout the year rather than stay flat.
What is the average Airbnb daily rate in Quebrada Bonita?
Listings in Quebrada Bonita average $81 per night. The broader pricing spread also matters: lower-performing listings cluster closer to the lower quartiles, while premium homes can price materially above the city average when demand spikes or listing quality stands out.
How many Airbnb listings are active in Quebrada Bonita?
Quebrada Bonita currently has about 17 active Airbnb listings in AirROI's market dataset. That supply count helps explain how competitive the market is, how much depth there is for benchmarking, and whether the market behaves like a niche destination or a scaled urban market.
How strict are short-term rental regulations in Quebrada Bonita?
AirROI currently classifies the short-term rental regulation level in Quebrada Bonita as High. The dataset also shows about 41.2% of listings with registration evidence. That is a market signal, not legal advice, so hosts should still confirm current licensing and compliance rules locally before listing.
What is the RevPAR for Airbnb in Quebrada Bonita?
RevPAR in Quebrada Bonita is about N/A. That metric combines pricing and occupancy into one efficiency number, so it is often a better quick benchmark than ADR alone when investors want to compare how well listings convert nightly rates into realized revenue.
Is Airbnb profitable in Quebrada Bonita?
Occupancy of 19.6% means Quebrada Bonita is a more selective market. Profitability is achievable but requires careful cost management, premium positioning, or targeting longer stays to reduce turnover. Average annual revenue is $4,644, but individual returns depend on property type, location within the city, and the host's operating efficiency.
How far in advance do guests book Airbnb in Quebrada Bonita?
The average booking lead time in Quebrada Bonita is about 58 days — a longer planning horizon typical of destination or vacation markets where travelers book well in advance. Hosts who understand their market's booking cadence can adjust minimum stays and pricing windows accordingly.
What are the best neighborhoods for Airbnb in Quebrada Bonita?
Based on AirROI's analysis, some of the top neighborhoods for short-term rentals in Quebrada Bonita include Parque Arví, Guatapé, La Ceja. Each area attracts different guest profiles — from business travelers to leisure visitors — so the best location depends on the property type and target audience a host is aiming for. See the full neighborhood breakdown above.
What type of property performs best on Airbnb in Quebrada Bonita?
private_room listings make up 70.6% of the active supply in Quebrada Bonita. The most common configuration does not always mean the most profitable — operators who identify underserved property types or bedroom counts can sometimes outperform the market average by filling a gap in local supply.
How does Quebrada Bonita compare to nearby Airbnb markets?
Among neighboring markets, San Nicolás posts $37,794 in average annual revenue with 33.5% occupancy, compared to Quebrada Bonita's $4,644 and 19.6%. Comparing nearby markets helps investors understand whether a destination's performance reflects local demand or broader regional trends.
When is the peak season for Airbnb in Quebrada Bonita?
December is the highest-revenue month in Quebrada Bonita, while September is the softest. The revenue spread between them indicates a highly seasonal market — revenue in the peak month is more than double the low month, so cash-flow planning and pricing automation are critical.
About AirROI Market Data
AirROI tracks over 20 million properties across 190+ countries and maintains 15+ years of historical performance data, making it one of the deepest Airbnb and STR intelligence platforms available. The analytics pipeline aggregates listing-level data monthly — revenue, occupancy, nightly rates, RevPAR, guest demographics, booking patterns, and competitive supply — so investors and operators can benchmark any market against its own history and against neighboring destinations.
Real estate investors, property managers, financial institutions, hedge funds, tourism boards, hospitality consultants, tech platforms, and academic researchers rely on AirROI data to underwrite acquisitions, optimize pricing, model macro trends, and conduct peer-reviewed research. Data is available through in-depth market reports like this one and the Airbnb API with 22 endpoints and an Airbnb MCP Server for AI agents.
AirROI proprietary analytics as of 2025-09-30. Metrics reflect trailing twelve-month aggregates from active listings. Revenue figures are market averages, not projections. Neighborhood descriptions are AI-generated and reviewed for accuracy. For full methodology, see the data methodology page.