Nacascolo, Provincia Guanacaste Airbnb Market Data 2025: STR Report & Statistics
How much can you earn on Airbnb in Nacascolo, Provincia Guanacaste? Based on AirROI's 2025 dataset (June 2024 – May 2025), the short answer is $70,494 per year — at a $1,306 nightly rate, 32.0% occupancy, and a N/A RevPAR.
With just 37 active listings, Nacascolo is a micro-market where selective demand that rewards strong listing quality and pricing strategy. Supply has held steady as the market finds a new equilibrium. For hosts in Nacascolo, this is the ideal moment to sharpen guest experience, refresh listing photos, and implement dynamic pricing — incremental improvements compound quickly when competition is stable.
Regulation is low, reducing the compliance barrier — though local ordinances should still be verified. In a market this size, differentiated listings with strong reviews can capture outsized returns relative to the competition.

Table of Contents [hide] [show]
What Are the Key Airbnb Metrics in Nacascolo?
In Nacascolo, the headline Airbnb metrics are $70,494 in average annual revenue,32.0% occupancy, $1,306 ADR, and $0 in RevPAR, and guests book about 69 days in advance.
How Much Do Airbnb Hosts Earn Monthly in Nacascolo?
Understanding the monthly revenue variations for Airbnb listings in Nacascolo is key to maximizing your short term rental income potential. Seasonality significantly impacts earnings. Our analysis, based on data from the past 12 months, shows that the peak revenue month for STRs in Nacascolo is typically March, while September often presents the lowest earnings, highlighting opportunities for strategic pricing adjustments during shoulder and low seasons. Explore the typical Airbnb income in Nacascolo across different performance tiers:
- Best-in-class properties (Top 10%) achieve $31,841+ monthly, often utilizing dynamic pricing and superior guest experiences.
- Strong performing properties (Top 25%) earn $18,906 or more, indicating effective management and desirable locations/amenities.
- Typical properties (Median) generate around $3,651 per month, representing the average market performance.
- Entry-level properties (Bottom 25%) see earnings around $856, often with potential for optimization.
Average Monthly Airbnb Earnings Trend in Nacascolo
What Is the Monthly Airbnb Occupancy Rate in Nacascolo?
Maximize your bookings by understanding the Nacascolo STR occupancy trends. Seasonal demand shifts significantly influence how often properties are booked. Typically, Marchsees the highest demand (peak season occupancy), while November experiences the lowest (low season). Effective strategies, like adjusting minimum stays or offering promotions, can boost occupancy during slower periods. Here's how different property tiers perform in Nacascolo:
- Best-in-class properties (Top 10%) achieve 69%+ occupancy, indicating high desirability and potentially optimized availability.
- Strong performing properties (Top 25%) maintain 49% or higher occupancy, suggesting good market fit and guest satisfaction.
- Typical properties (Median) have an occupancy rate around 32%.
- Entry-level properties (Bottom 25%) average 17% occupancy, potentially facing higher vacancy.
Average Monthly Occupancy Rate Trend in Nacascolo
What Is the Average Airbnb Nightly Rate in Nacascolo?
Effective short term rental pricing strategy in Nacascolo involves understanding monthly ADR fluctuations. The Average Daily Rate (ADR) for Airbnb in Nacascolo typically peaks in December and dips lowest during January. Leveraging Airbnb dynamic pricing tools or strategies based on this seasonality can significantly boost revenue. Here's a look at the typical nightly rates achieved:
- Best-in-class properties (Top 10%) command rates of $3,983+ per night, often due to premium features or locations.
- Strong performing properties (Top 25%) achieve nightly rates of $3,208 or more.
- Typical properties (Median) charge around $1,508 per night.
- Entry-level properties (Bottom 25%) earn around $88 per night.
Average Daily Rate (ADR) Trend by Month in Nacascolo
What Is the RevPAR for Airbnb in Nacascolo?
RevPAR in Nacascolo is currently N/A. Because RevPAR combines nightly rates with realized occupancy, it is one of the cleanest ways to compare how efficiently listings turn demand into revenue across the market.
- Entry-level properties (Bottom 25%) see N/A RevPAR.
- Typical properties (Median) generate N/A RevPAR.
- Strong performers (Top 25%) earn N/A RevPAR.
- Best-in-class (Top 10%) achieve N/A RevPAR.
Average Monthly RevPAR Trend in Nacascolo
RevPAR Insights for Nacascolo
- RevPAR peaks in Jan and bottoms out in Jan, mirroring the broader seasonal demand pattern and suggesting opportunities for dynamic pricing.
Recommendations for Hosts
- Track your own RevPAR monthly against these Nacascolo benchmarks. If your RevPAR falls below the median of N/A, examine whether low occupancy or low ADR is the primary drag.
- Use RevPAR rather than revenue alone when comparing properties of different sizes — it normalizes for available nights and gives a more accurate picture of performance.
Get Live Nacascolo Market Intelligence 👇
Explore Real-time Analytics
When Is the Peak Season for Airbnb in Nacascolo?
Nacascolo's peak Airbnb season falls in March, July, April, while the softest stretch is August, September, October. Overall, the market shows highly seasonal trends requiring careful strategy, which should guide pricing, minimum stays, and cash-flow planning.
Peak Season (March, July, April)
- Revenue averages $16,405 per month
- Occupancy rates average 42.4%
- Daily rates average $1,683
Shoulder Season
- Revenue averages $10,765 per month
- Occupancy maintains around 34.8%
- Daily rates hold near $1,677
Low Season (August, September, October)
- Revenue drops to average $6,177 per month
- Occupancy decreases to average 30.3%
- Daily rates adjust to average $1,707
Seasonality Insights for Nacascolo
- Airbnb seasonality in Nacascolo is pronounced. Revenue swings sharply between peak and low months, which means pricing strategy, minimum-stay settings, and cash reserves all need to account for extended slower periods.
- During the high season, the absolute peak month showcases Nacascolo's highest earning potential, with monthly revenues climbing to $19,033, occupancy reaching 49.4%, and ADRs peaking at $1,827.
- Conversely, the slowest single month marks the market's lowest point — revenue may dip to $4,119, occupancy could drop to 24.8%, and ADRs may adjust to $1,465.
- Lower occupancy paired with meaningful seasonality means hosts in Nacascolo need to maximize every peak-season booking and seriously consider whether off-season pricing adjustments or minimum-stay changes can capture incremental revenue.
Seasonal Strategies for Maximizing Profit
- Peak Season: Maximize revenue through premium pricing and potentially longer minimum stays. Ensure high availability and consider tightening cancellation policies to reduce last-minute gaps.
- Low Season: Offer competitive pricing, extended-stay discounts, and flexible cancellation policies. Target off-season travelers like remote workers, budget-conscious guests, and travelers with flexible schedules.
- Shoulder Seasons: Implement dynamic pricing that bridges peak and low rates. Target weekend travelers, local events, and business visitors. Slightly more flexible terms than peak season can help maintain occupancy without deep discounting.
- In a highly seasonal market like Nacascolo, building a cash reserve during the top months is essential for covering fixed costs during the slow period. Automated pricing tools can help capture demand shifts in real time.
Do You Need a License for Airbnb in Nacascolo?
While Nacascolo, Provincia Guanacaste, Costa Rica currently shows low STR regulations, 5% of listings carry registration evidence — suggesting some hosts proactively register or that certain neighborhoods have their own rules. Checking local zoning and tax obligations before listing is still wise. Always verify the latest short-term rental regulations and Airbnb license requirements directly with local government authorities for Nacascolo to ensure full compliance before hosting.
(Source: AirROI data, 2026, based on 5% licensed listings)
What Are the Best Neighborhoods for Airbnb in Nacascolo?
With a compact short-term rental market, Nacascolo gives early-mover hosts an advantage in the right neighborhoods. The areas listed below are where guest demand and local attractions converge — a useful lens for investors evaluating whether to enter this market and where to position their listing.
| Neighborhood / Area | Why Host Here? (Target Guests & Appeal) | Key Attractions & Landmarks |
|---|---|---|
| Nacascolo Beach | A beautiful and secluded beach area perfect for relaxation, watersports, and enjoying nature. Ideal for tourists looking to escape the crowds and enjoy a peaceful vacation. | Nacascolo Beach, Playa Hermosa, Hacienda del Mar, Tempisque River, Rincón de la Vieja National Park |
| Conchal | Known for its stunning white sand beach made up of millions of crushed shells. Popular with tourists for swimming, snorkeling, and beach activities. | Playa Conchal, Reserva Conchal, Guanacaste National Park, Tamarindo Beach, Luis Pato Fishing Tours |
| Papagayo | An exclusive area with upscale resorts and beautiful beaches. Attracts affluent visitors looking for luxury accommodations and amenities. | Papagayo Marina, Papagayo National Park, Four Seasons Resort, Secrets Papagayo Resort, Golfo de Papagayo |
| Playa Hermosa | A tranquil beach destination ideal for families and couples. It offers beautiful sunsets and various outdoor activities. | Playa Hermosa, Hermosa Beach Club, Diving and snorkeling excursions, Guanacaste Conservation Area, Kayaking opportunities |
| Liberia | The nearest major city with access to multiple beaches and attractions. A good base for exploring Guanacaste. | Daniel Oduber Quiros International Airport, Museo de Guanacaste, Plaza de la Cultura, Parque Central, City shopping areas |
| Tamarindo | A vibrant beach town renowned for surfing, nightlife, and diverse dining options. Very popular among tourists, making it a prime location for Airbnb. | Tamarindo Beach, Surfing lessons, Nightlife scene, Las Baulas National Marine Park, Cabo Velas |
| Santa Rosa National Park | A national park known for its biodiversity and nature trails. Ideal for eco-tourists and nature enthusiasts. | Santa Rosa National Park, Wildlife viewing, Hiking trails, Playa Naranjo, Historical sites |
| Nicoya Peninsula | Famous for its stunning beaches, wellness retreats, and surfing spots. Attracts tourists seeking a laid-back and health-conscious experience. | Nosara, Santa Teresa, Montezuma, Mal País, Wellness retreats |
With 8 distinct neighborhoods showing meaningful short-term rental activity, Nacascolo offers diversification within a single market. Investors can tailor their strategy — from high-turnover tourist zones to quieter residential areas that attract longer stays and remote workers.
What Types of Properties Are on Airbnb in Nacascolo?
Room Type Distribution
Property Type Distribution
Market Composition Insights for Nacascolo
- The Nacascolo Airbnb market composition is heavily skewed towards Entire Home/Apt listings, which make up 89.2% of the 37 active rentals. This indicates strong guest preference for privacy and space.
- Looking at the property type distribution in Nacascolo, House properties are the most common (70.3%), reflecting the local real estate landscape.
- Houses represent a significant 70.3% portion, catering likely to families or larger groups.
Nacascolo Airbnb Room Capacity Analysis (2026): Bedroom Distribution
Distribution of Listings by Number of Bedrooms
Room Capacity Insights for Nacascolo
- The dominant room capacity in Nacascolo is 3 bedrooms listings, making up 27% of the market. This suggests a strong demand for properties suitable for families or small groups.
- Together, 3 bedrooms and 1 bedroom properties represent 48.6% of the active Airbnb listings in Nacascolo, indicating a high concentration in these sizes.
- A significant 51.3% of listings offer 3+ bedrooms, catering to larger groups and families seeking more space in Nacascolo.
Nacascolo Vacation Rental Guest Capacity Trends (2026)
Distribution of Listings by Guest Capacity
Guest Capacity Insights for Nacascolo
- The most common guest capacity trend in Nacascolo vacation rentals is listings accommodating 8+ guests (48.6%). This suggests the primary traveler segment is likely larger groups.
- Properties designed for 8+ guests and 6 guests dominate the Nacascolo STR market, accounting for 64.8% of listings.
- 64.8% of properties accommodate 6+ guests, serving the market segment for larger families or group travel in Nacascolo.
- On average, properties in Nacascolo are equipped to host 5.8 guests.
What Amenities Do Airbnb Guests Expect in Nacascolo?
Amenity Prevalence
Amenity Insights for Nacascolo
- Essential amenities in Nacascolo that guests expect include: Kitchen, Wifi. Lacking these (any) could significantly impact bookings.
- Popular amenities like Free parking on premises, TV, Air conditioning are common but not universal. Offering these can provide a competitive edge.
- A pool is a highly desired but not standard amenity, making it a key feature for attracting guests seeking leisure in Nacascolo.
Recommendations for Hosts
- Ensure your listing includes all essential amenities for Nacascolo: Kitchen, Wifi.
- Prioritize adding missing essentials: Kitchen, Wifi.
- Consider adding popular differentiators like Free parking on premises or TV to increase appeal.
- Highlight unique or less common amenities you offer (e.g., hot tub, dedicated workspace, EV charger) in your listing description and photos.
- Regularly check competitor amenities in Nacascolo to stay competitive.
Dive Deeper: Advanced Nacascolo STR Market Data (2026)
Ready to unlock more insights? AirROI provides access to advanced metrics and comprehensive Airbnb data for Nacascolo. Explore detailed analytics beyond this report to refine your investment strategy, optimize pricing, and maximize your vacation rental profits.
Explore Advanced MetricsNacascolo Airbnb Guest Demographics & Profile Analysis (2026)
Guest Profile Summary for Nacascolo
- The typical guest profile for Airbnb in Nacascolo consists of predominantly international visitors (76%), with top international origins including Canada, typically belonging to the Post-2000s (Gen Z/Alpha) group (50%), primarily speaking English or Spanish.
- Domestic travelers account for 24.1% of guests.
- Key international markets include United States (40.1%) and Canada (29.2%).
- Top languages spoken are English (53.8%) followed by Spanish (28.5%).
- A significant demographic segment is the Post-2000s (Gen Z/Alpha) group, representing 50% of guests.
Recommendations for Hosts
- Focus marketing internationally, particularly towards travelers from Canada.
- Tailor amenities and listing descriptions to appeal to the dominant Post-2000s (Gen Z/Alpha) demographic (e.g., highlight fast WiFi, smart home features, local guides).
- Highlight unique local experiences or amenities relevant to the primary guest profile.
- Consider seasonal promotions aligned with peak travel times for key origin markets.
Nacascolo Airbnb Booking Patterns (2026): Available vs. Booked Days
Available Days Distribution
Booked Days Distribution
Booking Pattern Insights for Nacascolo
- The most common availability pattern in Nacascolo falls within the 271-366 days range, representing 62.2% of listings. This suggests many properties have significant open periods on their calendars.
- Approximately 89.2% of listings show high availability (181+ days open annually), indicating potential for increased bookings or specific owner usage patterns.
- For booked days, the 31-90 days range is most frequent in Nacascolo (32.4%), reflecting common guest stay durations or potential owner blocking patterns.
- A notable 13.5% of properties secure long booking periods (181+ days booked per year), highlighting successful long-term rental strategies or significant owner usage.
How Far in Advance Do Guests Book Airbnb in Nacascolo?
Average Booking Lead Time by Month
Booking Lead Time Insights for Nacascolo
- The overall average booking lead time for vacation rentals in Nacascolo is 69 days.
- Guests book furthest in advance for stays during December (average 112 days), likely coinciding with peak travel demand or local events.
- The shortest booking windows occur for stays in August (average 32 days), indicating more last-minute travel plans during this time.
- Seasonally, Winter (83 days avg.) sees the longest lead times, while Summer (45 days avg.) has the shortest, reflecting typical travel planning cycles.
Recommendations for Hosts
- Use the overall average lead time (69 days) as a baseline for your pricing and availability strategy in Nacascolo.
- For December stays, consider implementing length-of-stay discounts or slightly higher rates for bookings made less than 112 days out to capitalize on advance planning.
- Target marketing efforts for the Winter season well in advance (at least 83 days) to capture early planners.
- Monitor your own booking lead times against these Nacascolo averages to identify opportunities for dynamic pricing adjustments.
Nacascolo Airbnb Minimum Stay Requirements Analysis
Distribution of Listings by Minimum Night Requirement
1 Night
17 listings
50% of total
2 Nights
2 listings
5.9% of total
3 Nights
2 listings
5.9% of total
4-6 Nights
8 listings
23.5% of total
30+ Nights
5 listings
14.7% of total
Key Insights
- The most prevalent minimum stay requirement in Nacascolo is 1 Night, adopted by 50% of listings. This highlights the market's preference for shorter, flexible bookings.
- A significant segment (14.7%) caters to monthly stays (30+ nights) in Nacascolo, pointing to opportunities in the extended-stay market.
Recommendations
- Align with the market by considering a 1 Night minimum stay, as 50% of Nacascolo hosts use this setting.
- Explore offering discounts for stays of 30+ nights to attract the 14.7% of the market seeking extended stays.
- Adjust minimum nights based on seasonality – potentially shorter during low season and longer during peak demand periods in Nacascolo.
Nacascolo Airbnb Cancellation Policy Trends Analysis (2026)
Super Strict 60 Days
2 listings
6.9% of total
Super Strict 30 Days
1 listings
3.4% of total
Flexible
7 listings
24.1% of total
Moderate
10 listings
34.5% of total
Firm
4 listings
13.8% of total
Strict
5 listings
17.2% of total
Cancellation Policy Insights for Nacascolo
- The prevailing Airbnb cancellation policy trend in Nacascolo is Moderate, used by 34.5% of listings.
- There's a relatively balanced mix between guest-friendly (58.6%) and stricter (31.0%) policies, offering choices for different guest needs.
Recommendations for Hosts
- Consider adopting a Moderate policy to align with the 34.5% market standard in Nacascolo.
- Regularly review your cancellation policy against competitors and market demand shifts in Nacascolo.
What Do the Top Airbnb Listings in Nacascolo Look Like?
Benchmark your potential! Explore examples of top-performing Airbnb properties in Nacascolobased on Trailing Twelve Month (TTM) revenue. Analyze their characteristics, revenue, occupancy rate, and ADR to understand what drives success in this market.
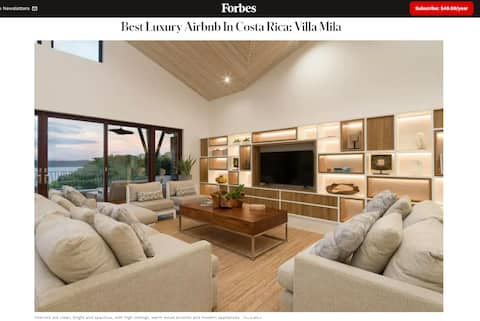
Best Luxury Airbnb In Costa Rica: Villa Mila
Entire Place • 3 bedrooms
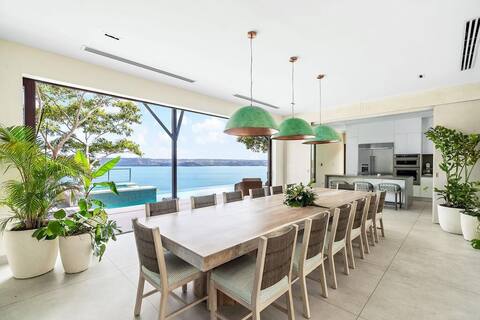
Ocean View Retreat w/ Infinity Pool, Gym
Entire Place • 6 bedrooms

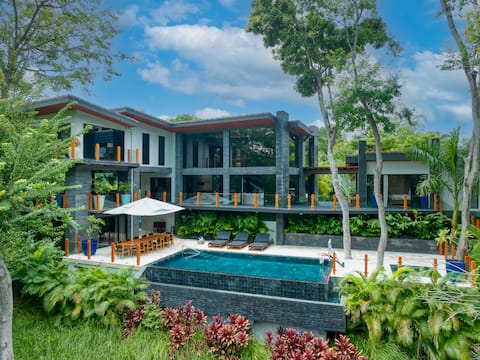
Casa Caiman + Viridian Experience
Entire Place • 5 bedrooms
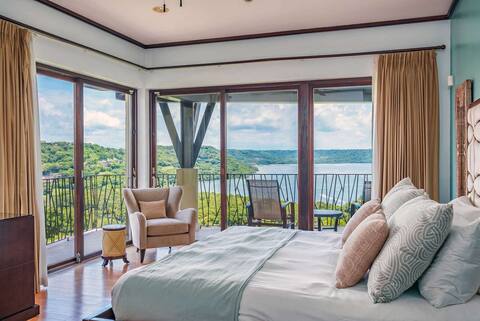
Villa Nambi FULL STAFF + BOATS Viridian Experience
Entire Place • 6 bedrooms

Concierge, Golf Cart, Luxe Amenities, Beach Clubs!
Entire Place • 3 bedrooms
Luxus 3BR Condo at Papagayo | Ocean Views, Luxury
Entire Place • 3 bedrooms
Note: Performance varies based on location, size, amenities, seasonality, and management quality. Data reflects the past 12 months.
Who Are the Top Airbnb Hosts in Nacascolo?
Learn from the best! This table showcases top-performing Airbnb hosts in Nacascolo based on the number of properties managed and estimated total revenue over the past year. Analyze their scale and performance metrics.
| Host Name | Properties | Grossing Revenue | Stay Reviews | Avg Rating |
|---|---|---|---|---|
| Mat | 2 | $502,899 | 18 | 5.00/5.0 |
| Shan | 1 | $392,948 | 40 | 5.00/5.0 |
| Krain Vacation Rentals | 1 | $339,936 | 1 | Not Rated |
| Host #463400744 | 5 | $294,583 | 2 | Not Rated |
| Host #533513154 | 1 | $230,159 | 0 | Not Rated |
| Host #541293316 | 1 | $164,623 | 1 | Not Rated |
| Papagayo Luxury | 1 | $163,466 | 5 | 5.00/5.0 |
| Brooke | 1 | $138,215 | 5 | 4.20/5.0 |
| Brokers | 2 | $121,194 | 1 | Not Rated |
| Diego | 1 | $76,816 | 4 | 5.00/5.0 |
Analyzing the strategies of top hosts, such as their property selection, pricing, and guest communication, can offer valuable lessons for optimizing your own Airbnb operations in Nacascolo.
How Does Nacascolo's Airbnb Market Compare to Nearby Cities?
How does the Nacascolo Airbnb market stack up against its neighbors? Compare key performance metrics like average monthly revenue, ADR, and occupancy rates in surrounding areas to understand the broader regional STR landscape.
Compared with Playa Tamarindo, Nacascolo has 19 percentage points lower occupancy and about $903 higher ADR. That helps frame whether this market is winning more on demand, pricing, or both.
| Market | Active Properties | Monthly Revenue | Daily Rate | Avg. Occupancy |
|---|---|---|---|---|
| Pinilla | 60 | $6,074 | $666.82 | 37% |
| Playa Tamarindo | 21 | $5,749 | $402.66 | 51% |
| Tamarindo | 139 | $5,016 | $467.65 | 41% |
| Playa Langosta | 158 | $4,478 | $510.68 | 43% |
| Punta Islita | 33 | $4,230 | $582.47 | 36% |
| Tamarindo | 1,092 | $4,100 | $385.79 | 43% |
| Cabo Velas | 901 | $3,465 | $388.34 | 40% |
| Nosara | 895 | $3,198 | $410.98 | 40% |
| Tempate | 708 | $3,015 | $399.02 | 36% |
| Pochomil Viejo | 10 | $2,715 | $374.38 | 27% |
Frequently Asked Questions About Airbnb in Nacascolo
These quick answers summarize the most common investor and operator questions using AirROI's latest market data for Nacascolo.
How much do Airbnb hosts make in Nacascolo?
Nacascolo hosts earn about $70,494 per year on average, with an average nightly rate of $1,306 and RevPAR of N/A. Those figures describe the typical revenue environment for active listings in Nacascolo, Provincia Guanacaste, not the ceiling for the best operators. Source: AirROI 2025 data, Nacascolo market, June 2024 to May 2025.
What is the average Airbnb occupancy rate in Nacascolo?
The average Airbnb occupancy rate in Nacascolo is 32.0%. March is the strongest month and September is the softest, so hosts should expect demand to move meaningfully throughout the year rather than stay flat.
What is the average Airbnb daily rate in Nacascolo?
Listings in Nacascolo average $1,306 per night. The broader pricing spread also matters: lower-performing listings cluster closer to the lower quartiles, while premium homes can price materially above the city average when demand spikes or listing quality stands out.
How many Airbnb listings are active in Nacascolo?
Nacascolo currently has about 37 active Airbnb listings in AirROI's market dataset. That supply count helps explain how competitive the market is, how much depth there is for benchmarking, and whether the market behaves like a niche destination or a scaled urban market.
How strict are short-term rental regulations in Nacascolo?
AirROI currently classifies the short-term rental regulation level in Nacascolo as Low. The dataset also shows about 5.4% of listings with registration evidence. That is a market signal, not legal advice, so hosts should still confirm current licensing and compliance rules locally before listing.
What is the RevPAR for Airbnb in Nacascolo?
RevPAR in Nacascolo is about N/A. That metric combines pricing and occupancy into one efficiency number, so it is often a better quick benchmark than ADR alone when investors want to compare how well listings convert nightly rates into realized revenue.
Is Airbnb profitable in Nacascolo?
Occupancy of 32.0% means Nacascolo is a more selective market. Profitability is achievable but requires careful cost management, premium positioning, or targeting longer stays to reduce turnover. Average annual revenue is $70,494, but individual returns depend on property type, location within the city, and the host's operating efficiency.
How far in advance do guests book Airbnb in Nacascolo?
The average booking lead time in Nacascolo is about 69 days — a longer planning horizon typical of destination or vacation markets where travelers book well in advance. Hosts who understand their market's booking cadence can adjust minimum stays and pricing windows accordingly.
What are the best neighborhoods for Airbnb in Nacascolo?
Based on AirROI's analysis, some of the top neighborhoods for short-term rentals in Nacascolo include Nacascolo Beach, Conchal, Papagayo. Each area attracts different guest profiles — from business travelers to leisure visitors — so the best location depends on the property type and target audience a host is aiming for. See the full neighborhood breakdown above.
What type of property performs best on Airbnb in Nacascolo?
entire_home listings make up 89.2% of the active supply in Nacascolo. The most common configuration does not always mean the most profitable — operators who identify underserved property types or bedroom counts can sometimes outperform the market average by filling a gap in local supply.
How does Nacascolo compare to nearby Airbnb markets?
Among neighboring markets, Pinilla posts $72,890 in average annual revenue with 36.8% occupancy, compared to Nacascolo's $70,494 and 32.0%. Comparing nearby markets helps investors understand whether a destination's performance reflects local demand or broader regional trends.
When is the peak season for Airbnb in Nacascolo?
March is the highest-revenue month in Nacascolo, while September is the softest. The revenue spread between them indicates a highly seasonal market �— revenue in the peak month is more than double the low month, so cash-flow planning and pricing automation are critical.
About AirROI Market Data
AirROI tracks over 20 million properties across 190+ countries and maintains 15+ years of historical performance data, making it one of the deepest Airbnb and STR intelligence platforms available. The analytics pipeline aggregates listing-level data monthly — revenue, occupancy, nightly rates, RevPAR, guest demographics, booking patterns, and competitive supply — so investors and operators can benchmark any market against its own history and against neighboring destinations.
Real estate investors, property managers, financial institutions, hedge funds, tourism boards, hospitality consultants, tech platforms, and academic researchers rely on AirROI data to underwrite acquisitions, optimize pricing, model macro trends, and conduct peer-reviewed research. Data is available through in-depth market reports like this one and the Airbnb API with 22 endpoints and an Airbnb MCP Server for AI agents.
AirROI proprietary analytics as of 2025-05-31. Metrics reflect trailing twelve-month aggregates from active listings. Revenue figures are market averages, not projections. Neighborhood descriptions are AI-generated and reviewed for accuracy. For full methodology, see the data methodology page.