Nosara, Provincia Guanacaste Airbnb Market Data 2025: STR Report & Statistics
How much can you earn on Airbnb in Nosara, Provincia Guanacaste? Based on AirROI's 2025 dataset (June 2024 – May 2025), the short answer is $38,380 per year — at a $411 nightly rate, 39.8% occupancy, and a N/A RevPAR.
With 895 active listings and moderate demand with room for well-positioned listings to outperform, Nosara is an established vacation rental market. Supply grew 24.1% over the past year, yet revenue and nightly rates both trended upward — a signal that traveler demand is outpacing new inventory rather than being diluted by it. For hosts, pricing power remains intact even as competition increases.
Regulation is low with minimal registration requirements, pointing to an operator-friendly environment. The data points to a market where fundamentals reward execution — the right property, priced well, in the right neighborhood still outperforms.

Table of Contents [hide] [show]
What Are the Key Airbnb Metrics in Nosara?
In Nosara, the headline Airbnb metrics are $38,380 in average annual revenue,39.8% occupancy, $411 ADR, and $0 in RevPAR, and guests book about 65 days in advance.
How Much Do Airbnb Hosts Earn Monthly in Nosara?
Understanding the monthly revenue variations for Airbnb listings in Nosara is key to maximizing your short term rental income potential. Seasonality significantly impacts earnings. Our analysis, based on data from the past 12 months, shows that the peak revenue month for STRs in Nosara is typically March, while September often presents the lowest earnings, highlighting opportunities for strategic pricing adjustments during shoulder and low seasons. Explore the typical Airbnb income in Nosara across different performance tiers:
- Best-in-class properties (Top 10%) achieve $12,148+ monthly, often utilizing dynamic pricing and superior guest experiences.
- Strong performing properties (Top 25%) earn $6,514 or more, indicating effective management and desirable locations/amenities.
- Typical properties (Median) generate around $3,074 per month, representing the average market performance.
- Entry-level properties (Bottom 25%) see earnings around $1,333, often with potential for optimization.
Average Monthly Airbnb Earnings Trend in Nosara
What Is the Monthly Airbnb Occupancy Rate in Nosara?
Maximize your bookings by understanding the Nosara STR occupancy trends. Seasonal demand shifts significantly influence how often properties are booked. Typically, Februarysees the highest demand (peak season occupancy), while September experiences the lowest (low season). Effective strategies, like adjusting minimum stays or offering promotions, can boost occupancy during slower periods. Here's how different property tiers perform in Nosara:
- Best-in-class properties (Top 10%) achieve 78%+ occupancy, indicating high desirability and potentially optimized availability.
- Strong performing properties (Top 25%) maintain 60% or higher occupancy, suggesting good market fit and guest satisfaction.
- Typical properties (Median) have an occupancy rate around 39%.
- Entry-level properties (Bottom 25%) average 20% occupancy, potentially facing higher vacancy.
Average Monthly Occupancy Rate Trend in Nosara
What Is the Average Airbnb Nightly Rate in Nosara?
Effective short term rental pricing strategy in Nosara involves understanding monthly ADR fluctuations. The Average Daily Rate (ADR) for Airbnb in Nosara typically peaks in January and dips lowest during September. Leveraging Airbnb dynamic pricing tools or strategies based on this seasonality can significantly boost revenue. Here's a look at the typical nightly rates achieved:
- Best-in-class properties (Top 10%) command rates of $929+ per night, often due to premium features or locations.
- Strong performing properties (Top 25%) achieve nightly rates of $495 or more.
- Typical properties (Median) charge around $252 per night.
- Entry-level properties (Bottom 25%) earn around $132 per night.
Average Daily Rate (ADR) Trend by Month in Nosara
What Is the RevPAR for Airbnb in Nosara?
RevPAR in Nosara is currently N/A. Because RevPAR combines nightly rates with realized occupancy, it is one of the cleanest ways to compare how efficiently listings turn demand into revenue across the market.
- Entry-level properties (Bottom 25%) see N/A RevPAR.
- Typical properties (Median) generate N/A RevPAR.
- Strong performers (Top 25%) earn N/A RevPAR.
- Best-in-class (Top 10%) achieve N/A RevPAR.
Average Monthly RevPAR Trend in Nosara
RevPAR Insights for Nosara
- RevPAR peaks in Jan and bottoms out in Jan, mirroring the broader seasonal demand pattern and suggesting opportunities for dynamic pricing.
Recommendations for Hosts
- Track your own RevPAR monthly against these Nosara benchmarks. If your RevPAR falls below the median of N/A, examine whether low occupancy or low ADR is the primary drag.
- Use RevPAR rather than revenue alone when comparing properties of different sizes — it normalizes for available nights and gives a more accurate picture of performance.
Get Live Nosara Market Intelligence 👇
Explore Real-time Analytics
When Is the Peak Season for Airbnb in Nosara?
Nosara's peak Airbnb season falls in March, January, February, while the softest stretch is May, September, October. Overall, the market shows highly seasonal trends requiring careful strategy, which should guide pricing, minimum stays, and cash-flow planning.
Peak Season (March, January, February)
- Revenue averages $7,940 per month
- Occupancy rates average 56.7%
- Daily rates average $490
Shoulder Season
- Revenue averages $4,825 per month
- Occupancy maintains around 38.9%
- Daily rates hold near $390
Low Season (May, September, October)
- Revenue drops to average $2,815 per month
- Occupancy decreases to average 30.0%
- Daily rates adjust to average $367
Seasonality Insights for Nosara
- Airbnb seasonality in Nosara is pronounced. Revenue swings sharply between peak and low months, which means pricing strategy, minimum-stay settings, and cash reserves all need to account for extended slower periods.
- During the high season, the absolute peak month showcases Nosara's highest earning potential, with monthly revenues climbing to $8,213, occupancy reaching 57.8%, and ADRs peaking at $495.
- Conversely, the slowest single month marks the market's lowest point — revenue may dip to $2,277, occupancy could drop to 28.6%, and ADRs may adjust to $341.
- Lower occupancy paired with meaningful seasonality means hosts in Nosara need to maximize every peak-season booking and seriously consider whether off-season pricing adjustments or minimum-stay changes can capture incremental revenue.
Seasonal Strategies for Maximizing Profit
- Peak Season: Maximize revenue through premium pricing and potentially longer minimum stays. Ensure high availability and consider tightening cancellation policies to reduce last-minute gaps.
- Low Season: Offer competitive pricing, extended-stay discounts, and flexible cancellation policies. Target off-season travelers like remote workers, budget-conscious guests, and travelers with flexible schedules.
- Shoulder Seasons: Implement dynamic pricing that bridges peak and low rates. Target weekend travelers, local events, and business visitors. Slightly more flexible terms than peak season can help maintain occupancy without deep discounting.
- In a highly seasonal market like Nosara, building a cash reserve during the top months is essential for covering fixed costs during the slow period. Automated pricing tools can help capture demand shifts in real time.
Do You Need a License for Airbnb in Nosara?
Nosara, Provincia Guanacaste, Costa Rica currently shows a low regulation profile despite having 895 active listings. Larger markets with light regulation can attract new supply quickly, but that also means regulatory frameworks may evolve as local governments respond to growth — staying informed protects your investment. Always verify the latest short-term rental regulations and Airbnb license requirements directly with local government authorities for Nosara to ensure full compliance before hosting.
(Source: AirROI data, 2026, based on 4% licensed listings)
What Are the Best Neighborhoods for Airbnb in Nosara?
Location within Nosara matters. Even in a midsize market, the difference between neighborhoods can mean a material gap in occupancy, nightly rate, and overall Airbnb revenue. Below are 8 areas where short-term rental activity and guest interest are concentrated — along with the reasons each neighborhood appeals to travelers.
| Neighborhood / Area | Why Host Here? (Target Guests & Appeal) | Key Attractions & Landmarks |
|---|---|---|
| Playa Guiones | A famous surf beach known for its consistent waves and beautiful sunsets. A hotspot for surfers and beachgoers looking for a relaxed and vibrant atmosphere. | Surfing schools, Yoga retreats, Natural hot springs, Wildlife refuge, Beaches for swimming and sunbathing |
| Playa Pelada | A quieter and less crowded beach compared to its neighbor Playa Guiones. Ideal for families and those seeking tranquility in a picturesque setting. | Secluded beaches, Tide pools, Nature walks, Local eateries, Sunset views |
| Nosara town center | The heart of the Nosara community, offering local shops, restaurants, and access to various amenities. Great for those who want to experience local culture and lifestyle. | Nosara Wildlife Rescue, Local markets, Art galleries, Restaurants and cafes, Cultural events |
| Ostional | Known for the nesting of Olive Ridley sea turtles, attracting ecotourism and nature lovers. A unique and important natural area preserving marine biodiversity. | Turtle nesting tours, Ecotourism activities, Wildlife observation, Stunning beaches, Protected wildlife reserves |
| San Juanillo | A beautiful beach town with pristine waters and an unspoiled atmosphere. It draws those looking for a local vibe and natural beauty. | Beaches for swimming and snorkeling, Local seafood restaurants, Scenic viewpoints, Calm waters, Nature hikes |
| Sámara | A picturesque beach town offering good surf and a family-friendly atmosphere. Known for its vibrant community and array of beach activities. | Surfing and paddleboarding, Beachfront restaurants, Sámara Park, Natural beauty, Wildlife tours |
| Cabo Velas | A tranquil locale surrounded by nature that offers stunning ocean views and opportunities for outdoor activities. Ideal for those seeking relaxation away from the bustle. | Beautiful beaches, Nature reserves, Scenic hiking trails, Fishing activities, Secluded coves |
| Garza | A small fishing village that offers a glimpse into local life. Popular for its laid-back vibe and great for fishing and marine activities. | Fishing and boat tours, Beach relaxation, Local cultural experiences, Scenic views, Restaurants serving fresh seafood |
With 8 distinct neighborhoods showing meaningful short-term rental activity, Nosara offers diversification within a single market. Investors can tailor their strategy — from high-turnover tourist zones to quieter residential areas that attract longer stays and remote workers.
What Types of Properties Are on Airbnb in Nosara?
Room Type Distribution
Property Type Distribution
Market Composition Insights for Nosara
- The Nosara Airbnb market composition is heavily skewed towards Entire Home/Apt listings, which make up 86.6% of the 895 active rentals. This indicates strong guest preference for privacy and space.
- Looking at the property type distribution in Nosara, House properties are the most common (61.8%), reflecting the local real estate landscape.
- Houses represent a significant 61.8% portion, catering likely to families or larger groups.
- The presence of 9.7% Hotel/Boutique listings indicates integration with traditional hospitality.
- Smaller segments like outdoor/unique, unique stays, others (combined 6.2%) offer potential for unique stay experiences.
Nosara Airbnb Room Capacity Analysis (2026): Bedroom Distribution
Distribution of Listings by Number of Bedrooms
Room Capacity Insights for Nosara
- The dominant room capacity in Nosara is 1 bedroom listings, making up 32.4% of the market. This suggests a strong demand for properties suitable for couples or solo travelers.
- Together, 1 bedroom and 2 bedrooms properties represent 55.9% of the active Airbnb listings in Nosara, indicating a high concentration in these sizes.
- A significant 34.3% of listings offer 3+ bedrooms, catering to larger groups and families seeking more space in Nosara.
Nosara Vacation Rental Guest Capacity Trends (2026)
Distribution of Listings by Guest Capacity
Guest Capacity Insights for Nosara
- The most common guest capacity trend in Nosara vacation rentals is listings accommodating 2 guests (26.3%). This suggests the primary traveler segment is likely couples or solo travelers.
- Properties designed for 2 guests and 8+ guests dominate the Nosara STR market, accounting for 51.2% of listings.
- 41.1% of properties accommodate 6+ guests, serving the market segment for larger families or group travel in Nosara.
- On average, properties in Nosara are equipped to host 4.6 guests.
What Amenities Do Airbnb Guests Expect in Nosara?
Amenity Prevalence
Amenity Insights for Nosara
- Essential amenities in Nosara that guests expect include: Wifi, Air conditioning. Lacking these (any) could significantly impact bookings.
- Popular amenities like Kitchen, Free parking on premises, Essentials are common but not universal. Offering these can provide a competitive edge.
Recommendations for Hosts
- Ensure your listing includes all essential amenities for Nosara: Wifi, Air conditioning.
- Prioritize adding missing essentials: Wifi, Air conditioning.
- Consider adding popular differentiators like Kitchen or Free parking on premises to increase appeal.
- Highlight unique or less common amenities you offer (e.g., hot tub, dedicated workspace, EV charger) in your listing description and photos.
- Regularly check competitor amenities in Nosara to stay competitive.
Dive Deeper: Advanced Nosara STR Market Data (2026)
Ready to unlock more insights? AirROI provides access to advanced metrics and comprehensive Airbnb data for Nosara. Explore detailed analytics beyond this report to refine your investment strategy, optimize pricing, and maximize your vacation rental profits.
Explore Advanced MetricsNosara Airbnb Guest Demographics & Profile Analysis (2026)
Guest Profile Summary for Nosara
- The typical guest profile for Airbnb in Nosara consists of predominantly international visitors (89%), with top international origins including Canada, typically belonging to the Post-2000s (Gen Z/Alpha) group (50%), primarily speaking English or Spanish.
- Domestic travelers account for 11.2% of guests.
- Key international markets include United States (57.8%) and Canada (16%).
- Top languages spoken are English (52.7%) followed by Spanish (22.6%).
- A significant demographic segment is the Post-2000s (Gen Z/Alpha) group, representing 50% of guests.
Recommendations for Hosts
- Focus marketing internationally, particularly towards travelers from Canada.
- Tailor amenities and listing descriptions to appeal to the dominant Post-2000s (Gen Z/Alpha) demographic (e.g., highlight fast WiFi, smart home features, local guides).
- Highlight unique local experiences or amenities relevant to the primary guest profile.
- Consider seasonal promotions aligned with peak travel times for key origin markets.
Nosara Airbnb Booking Patterns (2026): Available vs. Booked Days
Available Days Distribution
Booked Days Distribution
Booking Pattern Insights for Nosara
- The most common availability pattern in Nosara falls within the 271-366 days range, representing 54% of listings. This suggests many properties have significant open periods on their calendars.
- Approximately 86.4% of listings show high availability (181+ days open annually), indicating potential for increased bookings or specific owner usage patterns.
- For booked days, the 91-180 days range is most frequent in Nosara (32.4%), reflecting common guest stay durations or potential owner blocking patterns.
- A notable 15.1% of properties secure long booking periods (181+ days booked per year), highlighting successful long-term rental strategies or significant owner usage.
How Far in Advance Do Guests Book Airbnb in Nosara?
Average Booking Lead Time by Month
Booking Lead Time Insights for Nosara
- The overall average booking lead time for vacation rentals in Nosara is 65 days.
- Guests book furthest in advance for stays during January (average 91 days), likely coinciding with peak travel demand or local events.
- The shortest booking windows occur for stays in September (average 33 days), indicating more last-minute travel plans during this time.
- Seasonally, Winter (89 days avg.) sees the longest lead times, while Summer (49 days avg.) has the shortest, reflecting typical travel planning cycles.
Recommendations for Hosts
- Use the overall average lead time (65 days) as a baseline for your pricing and availability strategy in Nosara.
- For January stays, consider implementing length-of-stay discounts or slightly higher rates for bookings made less than 91 days out to capitalize on advance planning.
- Target marketing efforts for the Winter season well in advance (at least 89 days) to capture early planners.
- Monitor your own booking lead times against these Nosara averages to identify opportunities for dynamic pricing adjustments.
Nosara Airbnb Minimum Stay Requirements Analysis
Distribution of Listings by Minimum Night Requirement
1 Night
126 listings
14.3% of total
2 Nights
138 listings
15.6% of total
3 Nights
141 listings
16% of total
4-6 Nights
175 listings
19.8% of total
7-29 Nights
25 listings
2.8% of total
30+ Nights
278 listings
31.5% of total
Key Insights
- The most prevalent minimum stay requirement in Nosara is 30+ Nights, adopted by 31.5% of listings. This highlights the market's preference for longer commitments.
- A significant segment (31.5%) caters to monthly stays (30+ nights) in Nosara, pointing to opportunities in the extended-stay market.
Recommendations
- Align with the market by considering a 30+ Nights minimum stay, as 31.5% of Nosara hosts use this setting.
- If feasible, allowing 1-night stays, especially midweek or during low season, could capture last-minute bookings, as only 14.3% currently do.
- Explore offering discounts for stays of 30+ nights to attract the 31.5% of the market seeking extended stays.
- Adjust minimum nights based on seasonality – potentially shorter during low season and longer during peak demand periods in Nosara.
Nosara Airbnb Cancellation Policy Trends Analysis (2026)
Super Strict 30 Days
62 listings
8% of total
Super Strict 60 Days
48 listings
6.2% of total
Flexible
76 listings
9.8% of total
Moderate
102 listings
13.2% of total
Firm
212 listings
27.4% of total
Strict
273 listings
35.3% of total
Cancellation Policy Insights for Nosara
- The prevailing Airbnb cancellation policy trend in Nosara is Strict, used by 35.3% of listings.
- A majority (62.7%) of hosts in Nosara utilize Firm or Strict policies, indicating a market where hosts prioritize booking security.
Recommendations for Hosts
- Consider adopting a Strict policy to align with the 35.3% market standard in Nosara.
- With 35.3% using Strict terms, this is a viable option in Nosara, particularly for high-value properties or during peak demand periods.
- Regularly review your cancellation policy against competitors and market demand shifts in Nosara.
What Do the Top Airbnb Listings in Nosara Look Like?
Benchmark your potential! Explore examples of top-performing Airbnb properties in Nosarabased on Trailing Twelve Month (TTM) revenue. Analyze their characteristics, revenue, occupancy rate, and ADR to understand what drives success in this market.
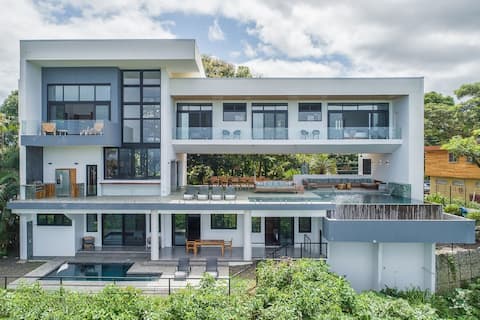
Exclusive Modern Luxurious villa w/ infinity pool!
Entire Place • 7 bedrooms

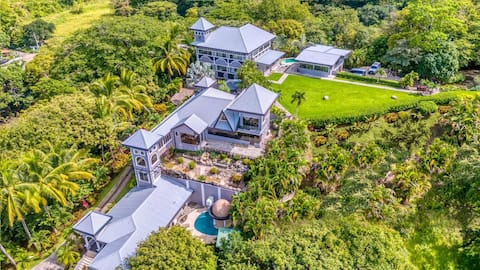
Perfect for large groups - Ocean Breeze Nosara
Entire Place • 10 bedrooms
15BR Luxury Private Resort Ocean View in Nosara!
Entire Place • 15 bedrooms
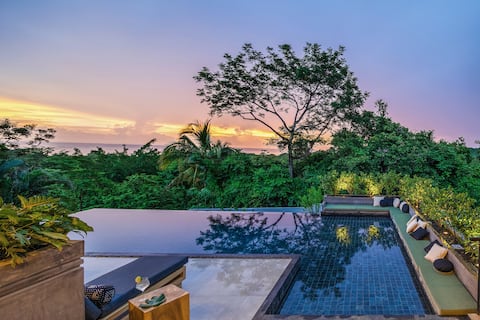
Most desirable waterfront villa in heart of Nosara
Entire Place • 3 bedrooms

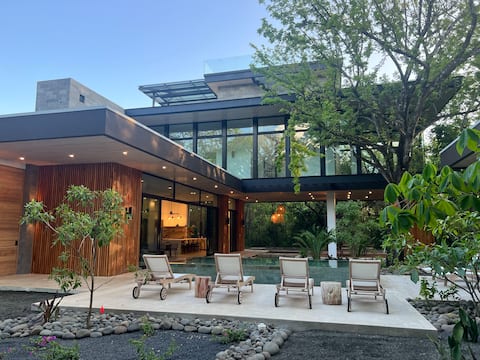
Elements 7 bedroom villa... 5 minute walk to beach
Entire Place • 7 bedrooms
Raintree Experience _ House
Entire Place • 5 bedrooms
Note: Performance varies based on location, size, amenities, seasonality, and management quality. Data reflects the past 12 months.
Who Are the Top Airbnb Hosts in Nosara?
Learn from the best! This table showcases top-performing Airbnb hosts in Nosara based on the number of properties managed and estimated total revenue over the past year. Analyze their scale and performance metrics.
| Host Name | Properties | Grossing Revenue | Stay Reviews | Avg Rating |
|---|---|---|---|---|
| Vacation Nosara | 42 | $1,704,279 | 860 | 4.79/5.0 |
| Alba Properties | 25 | $1,335,161 | 396 | 4.81/5.0 |
| RentNosara | 26 | $1,207,799 | 251 | 4.69/5.0 |
| Surfing Nosara | 32 | $1,086,941 | 128 | 4.88/5.0 |
| Nalu | 7 | $964,161 | 311 | 4.94/5.0 |
| Rick | 13 | $905,770 | 53 | 4.89/5.0 |
| QUIN Surf Residence Nosara | 5 | $617,836 | 25 | 5.00/5.0 |
| Surfing Nosara | 13 | $583,304 | 158 | 4.66/5.0 |
| Carmelina | 5 | $528,126 | 24 | 5.00/5.0 |
| Kendra | 5 | $483,646 | 88 | 4.84/5.0 |
Analyzing the strategies of top hosts, such as their property selection, pricing, and guest communication, can offer valuable lessons for optimizing your own Airbnb operations in Nosara.
How Does Nosara's Airbnb Market Compare to Nearby Cities?
How does the Nosara Airbnb market stack up against its neighbors? Compare key performance metrics like average monthly revenue, ADR, and occupancy rates in surrounding areas to understand the broader regional STR landscape.
Compared with Playa Tamarindo, Nosara has 11 percentage points lower occupancy and about $8 higher ADR. That helps frame whether this market is winning more on demand, pricing, or both.
| Market | Active Properties | Monthly Revenue | Daily Rate | Avg. Occupancy |
|---|---|---|---|---|
| Pinilla | 60 | $6,074 | $666.82 | 37% |
| Nacascolo | 37 | $5,874 | $1305.69 | 32% |
| Playa Tamarindo | 21 | $5,749 | $402.66 | 51% |
| Tamarindo | 139 | $5,016 | $467.65 | 41% |
| Playa Langosta | 158 | $4,478 | $510.68 | 43% |
| Punta Islita | 33 | $4,230 | $582.47 | 36% |
| Tamarindo | 1,092 | $4,100 | $385.79 | 43% |
| Cabo Velas | 901 | $3,465 | $388.34 | 40% |
| Tempate | 708 | $3,015 | $399.02 | 36% |
| Quepos | 1,145 | $2,695 | $257.65 | 40% |
Frequently Asked Questions About Airbnb in Nosara
These quick answers summarize the most common investor and operator questions using AirROI's latest market data for Nosara.
How much do Airbnb hosts make in Nosara?
Nosara hosts earn about $38,380 per year on average, with an average nightly rate of $411 and RevPAR of N/A. Those figures describe the typical revenue environment for active listings in Nosara, Provincia Guanacaste, not the ceiling for the best operators. Source: AirROI 2025 data, Nosara market, June 2024 to May 2025.
What is the average Airbnb occupancy rate in Nosara?
The average Airbnb occupancy rate in Nosara is 39.8%. March is the strongest month and September is the softest, so hosts should expect demand to move meaningfully throughout the year rather than stay flat.
What is the average Airbnb daily rate in Nosara?
Listings in Nosara average $411 per night. The broader pricing spread also matters: lower-performing listings cluster closer to the lower quartiles, while premium homes can price materially above the city average when demand spikes or listing quality stands out.
How many Airbnb listings are active in Nosara?
Nosara currently has about 895 active Airbnb listings in AirROI's market dataset. That supply count helps explain how competitive the market is, how much depth there is for benchmarking, and whether the market behaves like a niche destination or a scaled urban market.
How strict are short-term rental regulations in Nosara?
AirROI currently classifies the short-term rental regulation level in Nosara as Low. The dataset also shows about 3.9% of listings with registration evidence. That is a market signal, not legal advice, so hosts should still confirm current licensing and compliance rules locally before listing.
What is the RevPAR for Airbnb in Nosara?
RevPAR in Nosara is about N/A. That metric combines pricing and occupancy into one efficiency number, so it is often a better quick benchmark than ADR alone when investors want to compare how well listings convert nightly rates into realized revenue.
Is Airbnb profitable in Nosara?
Occupancy of 39.8% means Nosara is a more selective market. Profitability is achievable but requires careful cost management, premium positioning, or targeting longer stays to reduce turnover. Average annual revenue is $38,380, but individual returns depend on property type, location within the city, and the host's operating efficiency.
How far in advance do guests book Airbnb in Nosara?
The average booking lead time in Nosara is about 65 days — a longer planning horizon typical of destination or vacation markets where travelers book well in advance. Hosts who understand their market's booking cadence can adjust minimum stays and pricing windows accordingly.
What are the best neighborhoods for Airbnb in Nosara?
Based on AirROI's analysis, some of the top neighborhoods for short-term rentals in Nosara include Playa Guiones, Playa Pelada, Nosara town center. Each area attracts different guest profiles — from business travelers to leisure visitors — so the best location depends on the property type and target audience a host is aiming for. See the full neighborhood breakdown above.
What type of property performs best on Airbnb in Nosara?
entire_home listings make up 86.6% of the active supply in Nosara. The most common configuration does not always mean the most profitable — operators who identify underserved property types or bedroom counts can sometimes outperform the market average by filling a gap in local supply.
How does Nosara compare to nearby Airbnb markets?
Among neighboring markets, Pinilla posts $72,890 in average annual revenue with 36.8% occupancy, compared to Nosara's $38,380 and 39.8%. Comparing nearby markets helps investors understand whether a destination's performance reflects local demand or broader regional trends.
When is the peak season for Airbnb in Nosara?
March is the highest-revenue month in Nosara, while September is the softest. The revenue spread between them indicates a highly seasonal market — revenue in the peak month is more than double the low month, so cash-flow planning and pricing automation are critical.
About AirROI Market Data
AirROI tracks over 20 million properties across 190+ countries and maintains 15+ years of historical performance data, making it one of the deepest Airbnb and STR intelligence platforms available. The analytics pipeline aggregates listing-level data monthly — revenue, occupancy, nightly rates, RevPAR, guest demographics, booking patterns, and competitive supply — so investors and operators can benchmark any market against its own history and against neighboring destinations.
Real estate investors, property managers, financial institutions, hedge funds, tourism boards, hospitality consultants, tech platforms, and academic researchers rely on AirROI data to underwrite acquisitions, optimize pricing, model macro trends, and conduct peer-reviewed research. Data is available through in-depth market reports like this one and the Airbnb API with 22 endpoints and an Airbnb MCP Server for AI agents.
AirROI proprietary analytics as of 2025-05-31. Metrics reflect trailing twelve-month aggregates from active listings. Revenue figures are market averages, not projections. Neighborhood descriptions are AI-generated and reviewed for accuracy. For full methodology, see the data methodology page.