Lokaserena, Bali Airbnb Market Data 2025: STR Report & Statistics
How much can you earn on Airbnb in Lokaserena, Bali? Based on AirROI's 2025 dataset (June 2024 – May 2025), the short answer is $20,992 per year — at a $276 nightly rate, 44.8% occupancy, and a N/A RevPAR.
With just 27 active listings, Lokaserena is a micro-market where moderate demand with room for well-positioned listings to outperform. Supply grew 145.5% and nightly rates have risen, creating an environment where the most bookable listings stand to capture outsized share. Hosts who pair competitive pricing with strong guest experience are well-positioned to convert the growing traveler base into consistent bookings.
Regulation data is limited for this market, and hosts should verify short-term rental rules with the local government. In a market this size, differentiated listings with strong reviews can capture outsized returns relative to the competition.
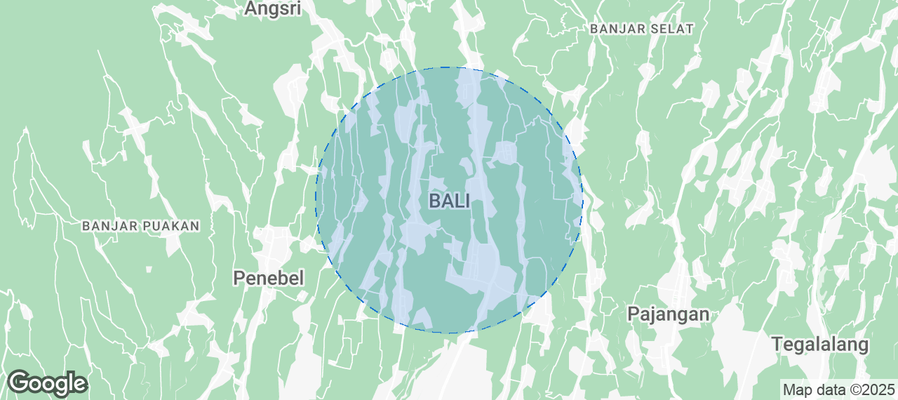
Table of Contents [hide] [show]
What Are the Key Airbnb Metrics in Lokaserena?
In Lokaserena, the headline Airbnb metrics are $20,992 in average annual revenue,44.8% occupancy, $276 ADR, and $0 in RevPAR, and guests book about 65 days in advance.
How Much Do Airbnb Hosts Earn Monthly in Lokaserena?
Understanding the monthly revenue variations for Airbnb listings in Lokaserena is key to maximizing your short term rental income potential. Seasonality significantly impacts earnings. Our analysis, based on data from the past 12 months, shows that the peak revenue month for STRs in Lokaserena is typically August, while March often presents the lowest earnings, highlighting opportunities for strategic pricing adjustments during shoulder and low seasons. Explore the typical Airbnb income in Lokaserena across different performance tiers:
- Best-in-class properties (Top 10%) achieve $5,656+ monthly, often utilizing dynamic pricing and superior guest experiences.
- Strong performing properties (Top 25%) earn $3,257 or more, indicating effective management and desirable locations/amenities.
- Typical properties (Median) generate around $2,219 per month, representing the average market performance.
- Entry-level properties (Bottom 25%) see earnings around $1,396, often with potential for optimization.
Average Monthly Airbnb Earnings Trend in Lokaserena
What Is the Monthly Airbnb Occupancy Rate in Lokaserena?
Maximize your bookings by understanding the Lokaserena STR occupancy trends. Seasonal demand shifts significantly influence how often properties are booked. Typically, Junesees the highest demand (peak season occupancy), while November experiences the lowest (low season). Effective strategies, like adjusting minimum stays or offering promotions, can boost occupancy during slower periods. Here's how different property tiers perform in Lokaserena:
- Best-in-class properties (Top 10%) achieve 91%+ occupancy, indicating high desirability and potentially optimized availability.
- Strong performing properties (Top 25%) maintain 78% or higher occupancy, suggesting good market fit and guest satisfaction.
- Typical properties (Median) have an occupancy rate around 51%.
- Entry-level properties (Bottom 25%) average 26% occupancy, potentially facing higher vacancy.
Average Monthly Occupancy Rate Trend in Lokaserena
What Is the Average Airbnb Nightly Rate in Lokaserena?
Effective short term rental pricing strategy in Lokaserena involves understanding monthly ADR fluctuations. The Average Daily Rate (ADR) for Airbnb in Lokaserena typically peaks in August and dips lowest during December. Leveraging Airbnb dynamic pricing tools or strategies based on this seasonality can significantly boost revenue. Here's a look at the typical nightly rates achieved:
- Best-in-class properties (Top 10%) command rates of $590+ per night, often due to premium features or locations.
- Strong performing properties (Top 25%) achieve nightly rates of $247 or more.
- Typical properties (Median) charge around $104 per night.
- Entry-level properties (Bottom 25%) earn around $55 per night.
Average Daily Rate (ADR) Trend by Month in Lokaserena
What Is the RevPAR for Airbnb in Lokaserena?
RevPAR in Lokaserena is currently N/A. Because RevPAR combines nightly rates with realized occupancy, it is one of the cleanest ways to compare how efficiently listings turn demand into revenue across the market.
- Entry-level properties (Bottom 25%) see N/A RevPAR.
- Typical properties (Median) generate N/A RevPAR.
- Strong performers (Top 25%) earn N/A RevPAR.
- Best-in-class (Top 10%) achieve N/A RevPAR.
Average Monthly RevPAR Trend in Lokaserena
RevPAR Insights for Lokaserena
- RevPAR peaks in Jan and bottoms out in Jan, mirroring the broader seasonal demand pattern and suggesting opportunities for dynamic pricing.
Recommendations for Hosts
- Track your own RevPAR monthly against these Lokaserena benchmarks. If your RevPAR falls below the median of N/A, examine whether low occupancy or low ADR is the primary drag.
- Use RevPAR rather than revenue alone when comparing properties of different sizes — it normalizes for available nights and gives a more accurate picture of performance.
Get Live Lokaserena Market Intelligence 👇
Explore Real-time Analytics
When Is the Peak Season for Airbnb in Lokaserena?
Lokaserena's peak Airbnb season falls in August, April, June, while the softest stretch is February, March, November. Overall, the market shows highly seasonal trends requiring careful strategy, which should guide pricing, minimum stays, and cash-flow planning.
Peak Season (August, April, June)
- Revenue averages $3,756 per month
- Occupancy rates average 65.2%
- Daily rates average $254
Shoulder Season
- Revenue averages $2,676 per month
- Occupancy maintains around 50.6%
- Daily rates hold near $245
Low Season (February, March, November)
- Revenue drops to average $1,978 per month
- Occupancy decreases to average 42.0%
- Daily rates adjust to average $228
Seasonality Insights for Lokaserena
- Airbnb seasonality in Lokaserena is pronounced. Revenue swings sharply between peak and low months, which means pricing strategy, minimum-stay settings, and cash reserves all need to account for extended slower periods.
- During the high season, the absolute peak month showcases Lokaserena's highest earning potential, with monthly revenues climbing to $5,064, occupancy reaching 73.9%, and ADRs peaking at $264.
- Conversely, the slowest single month marks the market's lowest point — revenue may dip to $1,910, occupancy could drop to 38.9%, and ADRs may adjust to $213.
- Understanding both the seasonal averages and these monthly peaks and troughs in revenue, occupancy, and ADR is crucial for maximizing your Airbnb profit potential in Lokaserena.
Seasonal Strategies for Maximizing Profit
- Peak Season: Maximize revenue through premium pricing and potentially longer minimum stays. Ensure high availability and consider tightening cancellation policies to reduce last-minute gaps.
- Low Season: Offer competitive pricing, extended-stay discounts, and flexible cancellation policies. Target off-season travelers like remote workers, budget-conscious guests, and travelers with flexible schedules.
- Shoulder Seasons: Implement dynamic pricing that bridges peak and low rates. Target weekend travelers, local events, and business visitors. Slightly more flexible terms than peak season can help maintain occupancy without deep discounting.
- In a highly seasonal market like Lokaserena, building a cash reserve during the top months is essential for covering fixed costs during the slow period. Automated pricing tools can help capture demand shifts in real time.
Do You Need a License for Airbnb in Lokaserena?
With 19% of listings showing registration in 2026, understanding potential Airbnb license requirements is crucial in Lokaserena. Always verify the latest short-term rental regulations and Airbnb license requirements directly with local government authorities for Lokaserena to ensure full compliance before hosting.
(Source: AirROI data, 2026, based on 19% licensed listings)
What Are the Best Neighborhoods for Airbnb in Lokaserena?
With a compact short-term rental market, Lokaserena gives early-mover hosts an advantage in the right neighborhoods. The areas listed below are where guest demand and local attractions converge — a useful lens for investors evaluating whether to enter this market and where to position their listing.
| Neighborhood / Area | Why Host Here? (Target Guests & Appeal) | Key Attractions & Landmarks |
|---|---|---|
| Seminyak | A bustling area known for its lively atmosphere, upscale shopping, and vibrant nightlife. It's a favorite among both tourists and locals, and offers plenty of beach clubs and fine dining options. | Seminyak Beach, Eat Street, La Plancha Beach Bar, Double Six Beach, Petitenget Temple, Bali Anti-Gravity Yoga |
| Canggu | A trendy coastal village that attracts surfers and a younger crowd looking for a laid-back vibe. Known for its beach clubs and wellness retreats, Canggu offers a hip, alternative lifestyle. | Echo Beach, Finns Beach Club, Tanah Lot Temple, Bali Treetop Adventure Park, Canggu Club, Old Man's Bar |
| Ubud | The cultural heart of Bali, surrounded by lush jungles and rice paddies. Ideal for those looking for a peaceful retreat and a connection to Bali’s arts and culture. | Ubud Monkey Forest, Tegallalang Rice Terrace, Ubud Art Market, Campuhan Ridge Walk, Goa Gajah (Elephant Cave), Puri Saren Royal Palace |
| Kuta | Famous for its long stretch of beach, Kuta is a lively area popular among tourists for its surf culture, shops, and nightlife. Great for budget travelers and party-goers. | Kuta Beach, Waterbom Bali, Beachwalk Mall, Kuta Art Market, Sky Garden Lounge |
| Nusa Dua | A luxurious resort area known for its pristine beaches and high-end resorts. Provides a tranquil environment ideal for families and honeymooners. | Nusa Dua Beach, Geger Beach, Bali Collection Mall, Waterblow, Mengiat Beach |
| Jimbaran | Known for its seafood restaurants along the beach and stunning sunsets, Jimbaran attracts both families and couples. It’s quieter than other areas while still providing beautiful beaches. | Jimbaran Bay Beach, Seafood Cafes, Jenggala Ceramics, Bali Intercontinental Resort |
| Sanur | A laid-back coastal town with a beautiful beach and a strong local culture. Popular among older tourists and families looking for a more relaxed vibe. | Sanur Beach, Le Mayeur Museum, Bali Seawalker, Sindhu Market, Mertasari Beach |
| Uluwatu | Famous for its stunning cliffs and surf breaks, Uluwatu attracts surfers and those looking for breathtaking views. Home to luxury villas and the famous Uluwatu Temple. | Uluwatu Temple, Padang Padang Beach, Suluban Beach, Single Fin Beach Club, Bingin Beach |
With 8 distinct neighborhoods showing meaningful short-term rental activity, Lokaserena offers diversification within a single market. Investors can tailor their strategy — from high-turnover tourist zones to quieter residential areas that attract longer stays and remote workers.
What Types of Properties Are on Airbnb in Lokaserena?
Room Type Distribution
Property Type Distribution
Market Composition Insights for Lokaserena
- The Lokaserena Airbnb market composition is heavily skewed towards Entire Home/Apt listings, which make up 70.4% of the 27 active rentals. This indicates strong guest preference for privacy and space.
- Looking at the property type distribution in Lokaserena, House properties are the most common (77.8%), reflecting the local real estate landscape.
- Houses represent a significant 77.8% portion, catering likely to families or larger groups.
- The presence of 22.2% Hotel/Boutique listings indicates integration with traditional hospitality.
Lokaserena Airbnb Room Capacity Analysis (2026): Bedroom Distribution
Distribution of Listings by Number of Bedrooms
Room Capacity Insights for Lokaserena
- The dominant room capacity in Lokaserena is 2 bedrooms listings, making up 40.7% of the market. This suggests a strong demand for properties suitable for couples or solo travelers.
- Together, 2 bedrooms and 1 bedroom properties represent 70.3% of the active Airbnb listings in Lokaserena, indicating a high concentration in these sizes.
- A significant 25.9% of listings offer 3+ bedrooms, catering to larger groups and families seeking more space in Lokaserena.
Lokaserena Vacation Rental Guest Capacity Trends (2026)
Distribution of Listings by Guest Capacity
Guest Capacity Insights for Lokaserena
- The most common guest capacity trend in Lokaserena vacation rentals is listings accommodating 4 guests (40.7%). This suggests the primary traveler segment is likely small families or groups.
- Properties designed for 4 guests and 2 guests dominate the Lokaserena STR market, accounting for 70.3% of listings.
- 22.2% of properties accommodate 6+ guests, serving the market segment for larger families or group travel in Lokaserena.
- On average, properties in Lokaserena are equipped to host 4.0 guests.
What Amenities Do Airbnb Guests Expect in Lokaserena?
Amenity Prevalence
Amenity Insights for Lokaserena
- Essential amenities in Lokaserena that guests expect include: Wifi, Free parking on premises, Essentials, Kitchen. Lacking these (any) could significantly impact bookings.
- Popular amenities like Air conditioning, Hot water, Shampoo are common but not universal. Offering these can provide a competitive edge.
Recommendations for Hosts
- Ensure your listing includes all essential amenities for Lokaserena: Wifi, Free parking on premises, Essentials, Kitchen.
- Prioritize adding missing essentials: Essentials, Kitchen.
- Consider adding popular differentiators like Air conditioning or Hot water to increase appeal.
- Highlight unique or less common amenities you offer (e.g., hot tub, dedicated workspace, EV charger) in your listing description and photos.
- Regularly check competitor amenities in Lokaserena to stay competitive.
Dive Deeper: Advanced Lokaserena STR Market Data (2026)
Ready to unlock more insights? AirROI provides access to advanced metrics and comprehensive Airbnb data for Lokaserena. Explore detailed analytics beyond this report to refine your investment strategy, optimize pricing, and maximize your vacation rental profits.
Explore Advanced MetricsLokaserena Airbnb Guest Demographics & Profile Analysis (2026)
Guest Profile Summary for Lokaserena
- The typical guest profile for Airbnb in Lokaserena consists of predominantly international visitors (96%), with top international origins including France, typically belonging to the Post-2000s (Gen Z/Alpha) group (50%), primarily speaking English or Spanish.
- Domestic travelers account for 4.3% of guests.
- Key international markets include Australia (14.8%) and France (9.9%).
- Top languages spoken are English (46.9%) followed by Spanish (8.3%).
- A significant demographic segment is the Post-2000s (Gen Z/Alpha) group, representing 50% of guests.
Recommendations for Hosts
- Focus marketing internationally, particularly towards travelers from France.
- Tailor amenities and listing descriptions to appeal to the dominant Post-2000s (Gen Z/Alpha) demographic (e.g., highlight fast WiFi, smart home features, local guides).
- Highlight unique local experiences or amenities relevant to the primary guest profile.
- Consider seasonal promotions aligned with peak travel times for key origin markets.
Lokaserena Airbnb Booking Patterns (2026): Available vs. Booked Days
Available Days Distribution
Booked Days Distribution
Booking Pattern Insights for Lokaserena
- The most common availability pattern in Lokaserena falls within the 271-366 days range, representing 55.6% of listings. This suggests many properties have significant open periods on their calendars.
- Approximately 74.1% of listings show high availability (181+ days open annually), indicating potential for increased bookings or specific owner usage patterns.
- For booked days, the 31-90 days range is most frequent in Lokaserena (29.6%), reflecting common guest stay durations or potential owner blocking patterns.
- A notable 25.9% of properties secure long booking periods (181+ days booked per year), highlighting successful long-term rental strategies or significant owner usage.
How Far in Advance Do Guests Book Airbnb in Lokaserena?
Average Booking Lead Time by Month
Booking Lead Time Insights for Lokaserena
- The overall average booking lead time for vacation rentals in Lokaserena is 65 days.
- Guests book furthest in advance for stays during March (average 106 days), likely coinciding with peak travel demand or local events.
- The shortest booking windows occur for stays in November (average 32 days), indicating more last-minute travel plans during this time.
- Seasonally, Spring (95 days avg.) sees the longest lead times, while Summer (65 days avg.) has the shortest, reflecting typical travel planning cycles.
Recommendations for Hosts
- Use the overall average lead time (65 days) as a baseline for your pricing and availability strategy in Lokaserena.
- For March stays, consider implementing length-of-stay discounts or slightly higher rates for bookings made less than 106 days out to capitalize on advance planning.
- Target marketing efforts for the Spring season well in advance (at least 95 days) to capture early planners.
- Monitor your own booking lead times against these Lokaserena averages to identify opportunities for dynamic pricing adjustments.
Lokaserena Airbnb Minimum Stay Requirements Analysis
Distribution of Listings by Minimum Night Requirement
1 Night
15 listings
55.6% of total
2 Nights
5 listings
18.5% of total
30+ Nights
7 listings
25.9% of total
Key Insights
- The most prevalent minimum stay requirement in Lokaserena is 1 Night, adopted by 55.6% of listings. This highlights the market's preference for shorter, flexible bookings.
- A strong majority (74.1%) of the Lokaserena Airbnb data shows acceptance of very short stays (1-2 nights), indicating a dynamic, high-turnover market.
- A significant segment (25.9%) caters to monthly stays (30+ nights) in Lokaserena, pointing to opportunities in the extended-stay market.
Recommendations
- Align with the market by considering a 1 Night minimum stay, as 55.6% of Lokaserena hosts use this setting.
- Explore offering discounts for stays of 30+ nights to attract the 25.9% of the market seeking extended stays.
- Adjust minimum nights based on seasonality – potentially shorter during low season and longer during peak demand periods in Lokaserena.
Lokaserena Airbnb Cancellation Policy Trends Analysis (2026)
Super Strict 60 Days
3 listings
15.8% of total
Flexible
7 listings
36.8% of total
Moderate
2 listings
10.5% of total
Firm
2 listings
10.5% of total
Strict
5 listings
26.3% of total
Cancellation Policy Insights for Lokaserena
- The prevailing Airbnb cancellation policy trend in Lokaserena is Flexible, used by 36.8% of listings.
- There's a relatively balanced mix between guest-friendly (47.3%) and stricter (36.8%) policies, offering choices for different guest needs.
Recommendations for Hosts
- Consider adopting a Flexible policy to align with the 36.8% market standard in Lokaserena.
- Regularly review your cancellation policy against competitors and market demand shifts in Lokaserena.
What Do the Top Airbnb Listings in Lokaserena Look Like?
Benchmark your potential! Explore examples of top-performing Airbnb properties in Lokaserenabased on Trailing Twelve Month (TTM) revenue. Analyze their characteristics, revenue, occupancy rate, and ADR to understand what drives success in this market.

The Pala Ubud - Villa Agung, 5BR, Ubud w/ staff
Entire Place • 5 bedrooms

Thatched wooden villa with amazing views near Ubud
Entire Place • 3 bedrooms
The Pala Ubud - Villa Seraya A, 2BR, Ubud w/ staff
Entire Place • 2 bedrooms

2 BR Villa with open view of rice paddies & sunset
Entire Place • 2 bedrooms
New 4 BR Villa surrounded by Jungle and Ricefields
Entire Place • 4 bedrooms
The Pala Ubud - Villa Seraya B, 2BR, Ubud w/ staff
Entire Place • 2 bedrooms
Note: Performance varies based on location, size, amenities, seasonality, and management quality. Data reflects the past 12 months.
Who Are the Top Airbnb Hosts in Lokaserena?
Learn from the best! This table showcases top-performing Airbnb hosts in Lokaserena based on the number of properties managed and estimated total revenue over the past year. Analyze their scale and performance metrics.
| Host Name | Properties | Grossing Revenue | Stay Reviews | Avg Rating |
|---|---|---|---|---|
| Host #28368233 | 8 | $243,203 | 0 | Not Rated |
| Putu | 5 | $122,356 | 688 | 4.95/5.0 |
| Wayan | 1 | $67,495 | 56 | 4.93/5.0 |
| I Wayan Krisna | 1 | $34,416 | 171 | 4.93/5.0 |
| Marheni | 1 | $32,430 | 22 | 5.00/5.0 |
| Putu | 3 | $25,922 | 134 | 4.75/5.0 |
| Host #458990304 | 3 | $23,926 | 0 | Not Rated |
| Made Darta | 1 | $14,552 | 105 | 4.70/5.0 |
| Host #508165946 | 1 | $1,689 | 0 | Not Rated |
| Host #25332564 | 1 | $337 | 0 | Not Rated |
Analyzing the strategies of top hosts, such as their property selection, pricing, and guest communication, can offer valuable lessons for optimizing your own Airbnb operations in Lokaserena.
How Does Lokaserena's Airbnb Market Compare to Nearby Cities?
How does the Lokaserena Airbnb market stack up against its neighbors? Compare key performance metrics like average monthly revenue, ADR, and occupancy rates in surrounding areas to understand the broader regional STR landscape.
Compared with Padangaji, Lokaserena has 27 percentage points lower occupancy and about $45 lower ADR. That helps frame whether this market is winning more on demand, pricing, or both.
| Market | Active Properties | Monthly Revenue | Daily Rate | Avg. Occupancy |
|---|---|---|---|---|
| Padangaji | 15 | $6,920 | $321.08 | 72% |
| Pejeng | 13 | $4,078 | $396.14 | 45% |
| Pejeng Kawan | 127 | $2,940 | $228.85 | 44% |
| Bedulu | 40 | $2,929 | $257.72 | 41% |
| BATAS DESA BATU JANGKIH | 17 | $2,905 | $414.01 | 37% |
| Seminyak | 2,095 | $2,856 | $300.43 | 43% |
| Pecatu | 1,858 | $2,738 | $252.31 | 48% |
| Duda | 28 | $2,667 | $222.48 | 46% |
| Sanding | 17 | $2,543 | $374.92 | 32% |
| Dencarik | 54 | $2,516 | $187.32 | 47% |
Frequently Asked Questions About Airbnb in Lokaserena
These quick answers summarize the most common investor and operator questions using AirROI's latest market data for Lokaserena.
How much do Airbnb hosts make in Lokaserena?
Lokaserena hosts earn about $20,992 per year on average, with an average nightly rate of $276 and RevPAR of N/A. Those figures describe the typical revenue environment for active listings in Lokaserena, Bali, not the ceiling for the best operators. Source: AirROI 2025 data, Lokaserena market, June 2024 to May 2025.
What is the average Airbnb occupancy rate in Lokaserena?
The average Airbnb occupancy rate in Lokaserena is 44.8%. August is the strongest month and March is the softest, so hosts should expect demand to move meaningfully throughout the year rather than stay flat.
What is the average Airbnb daily rate in Lokaserena?
Listings in Lokaserena average $276 per night. The broader pricing spread also matters: lower-performing listings cluster closer to the lower quartiles, while premium homes can price materially above the city average when demand spikes or listing quality stands out.
How many Airbnb listings are active in Lokaserena?
Lokaserena currently has about 27 active Airbnb listings in AirROI's market dataset. That supply count helps explain how competitive the market is, how much depth there is for benchmarking, and whether the market behaves like a niche destination or a scaled urban market.
How strict are short-term rental regulations in Lokaserena?
AirROI currently classifies the short-term rental regulation level in Lokaserena as Moderate. The dataset also shows about 18.5% of listings with registration evidence. That is a market signal, not legal advice, so hosts should still confirm current licensing and compliance rules locally before listing.
What is the RevPAR for Airbnb in Lokaserena?
RevPAR in Lokaserena is about N/A. That metric combines pricing and occupancy into one efficiency number, so it is often a better quick benchmark than ADR alone when investors want to compare how well listings convert nightly rates into realized revenue.
Is Airbnb profitable in Lokaserena?
At 44.8% occupancy, Lokaserena can be profitable — but margins depend heavily on operating costs, property acquisition price, and how well hosts optimize pricing across seasons. Average annual revenue is $20,992, but individual returns depend on property type, location within the city, and the host's operating efficiency.
How far in advance do guests book Airbnb in Lokaserena?
The average booking lead time in Lokaserena is about 65 days — a longer planning horizon typical of destination or vacation markets where travelers book well in advance. Hosts who understand their market's booking cadence can adjust minimum stays and pricing windows accordingly.
What are the best neighborhoods for Airbnb in Lokaserena?
Based on AirROI's analysis, some of the top neighborhoods for short-term rentals in Lokaserena include Seminyak, Canggu, Ubud. Each area attracts different guest profiles — from business travelers to leisure visitors — so the best location depends on the property type and target audience a host is aiming for. See the full neighborhood breakdown above.
What type of property performs best on Airbnb in Lokaserena?
entire_home listings make up 70.4% of the active supply in Lokaserena. The most common configuration does not always mean the most profitable — operators who identify underserved property types or bedroom counts can sometimes outperform the market average by filling a gap in local supply.
How does Lokaserena compare to nearby Airbnb markets?
Among neighboring markets, Padangaji posts $83,043 in average annual revenue with 72.1% occupancy, compared to Lokaserena's $20,992 and 44.8%. Comparing nearby markets helps investors understand whether a destination's performance reflects local demand or broader regional trends.
When is the peak season for Airbnb in Lokaserena?
August is the highest-revenue month in Lokaserena, while March is the softest. The revenue spread between them indicates a highly seasonal market — revenue in the peak month is more than double the low month, so cash-flow planning and pricing automation are critical.
About AirROI Market Data
AirROI tracks over 20 million properties across 190+ countries and maintains 15+ years of historical performance data, making it one of the deepest Airbnb and STR intelligence platforms available. The analytics pipeline aggregates listing-level data monthly — revenue, occupancy, nightly rates, RevPAR, guest demographics, booking patterns, and competitive supply — so investors and operators can benchmark any market against its own history and against neighboring destinations.
Real estate investors, property managers, financial institutions, hedge funds, tourism boards, hospitality consultants, tech platforms, and academic researchers rely on AirROI data to underwrite acquisitions, optimize pricing, model macro trends, and conduct peer-reviewed research. Data is available through in-depth market reports like this one and the Airbnb API with 22 endpoints and an Airbnb MCP Server for AI agents.
AirROI proprietary analytics as of 2025-05-31. Metrics reflect trailing twelve-month aggregates from active listings. Revenue figures are market averages, not projections. Neighborhood descriptions are AI-generated and reviewed for accuracy. For full methodology, see the data methodology page.