
Pacing
Pacing is a forward-looking performance metric that compares your current bookings-on-the-books for a future period to where those bookings stood at the same point one year ago. A property pacing 25% ahead of last year for next month is not just a positive sign — it is a quantified mandate to raise rates before those nights fill at prices set for softer demand.
Key Takeaways
- Pacing compares future bookings today versus future bookings at this exact point last year, isolating demand strength from seasonal noise
- "Pacing ahead" means demand is running stronger than the prior year; "pacing behind" signals weakness that still has time to be corrected
- Pacing is one of the highest-leverage inputs for dynamic pricing decisions — acting early on a pacing signal recovers revenue that reactive pricing leaves on the table
- Track pacing for 30, 60, and 90-day horizons weekly; short-horizon readings catch last-minute surges, long-horizon readings allow meaningful rate adjustments
- Pair pacing with booking lead time data to calibrate how urgently a behind signal demands action in your specific market
How Pacing Works
Pacing measures how far ahead or behind your bookings are relative to the same measurement point in the prior year. The comparison is always apples-to-apples on the calendar: bookings on the books today for next month versus bookings that were on the books on this same date last year for that same month.
Example — two months, two signals:
| Metric | This Year | Same Point Last Year | Pacing |
|---|---|---|---|
| March nights booked (as of Feb 10) | 20 nights | 16 nights | +25% ahead |
| March revenue booked (as of Feb 10) | $3,800 | $3,040 | +25% ahead |
| April nights booked (as of Feb 10) | 8 nights | 12 nights | -33% behind |
| April revenue booked (as of Feb 10) | $1,520 | $2,160 | -30% behind |
March is ahead on both nights and revenue — raise rates on remaining availability. April is behind on both — lower rates or cut minimum stays now, while there are still weeks to recover bookings that would otherwise go to competitors.
Nashville-Davidson Pacing by Month
Understanding whether your fill rate is strong or weak requires a baseline. AirROI's monthly occupancy data for Nashville-Davidson — one of the US's most active STR markets with 6,958 active listings — shows how booking pace shifts dramatically across the calendar year.
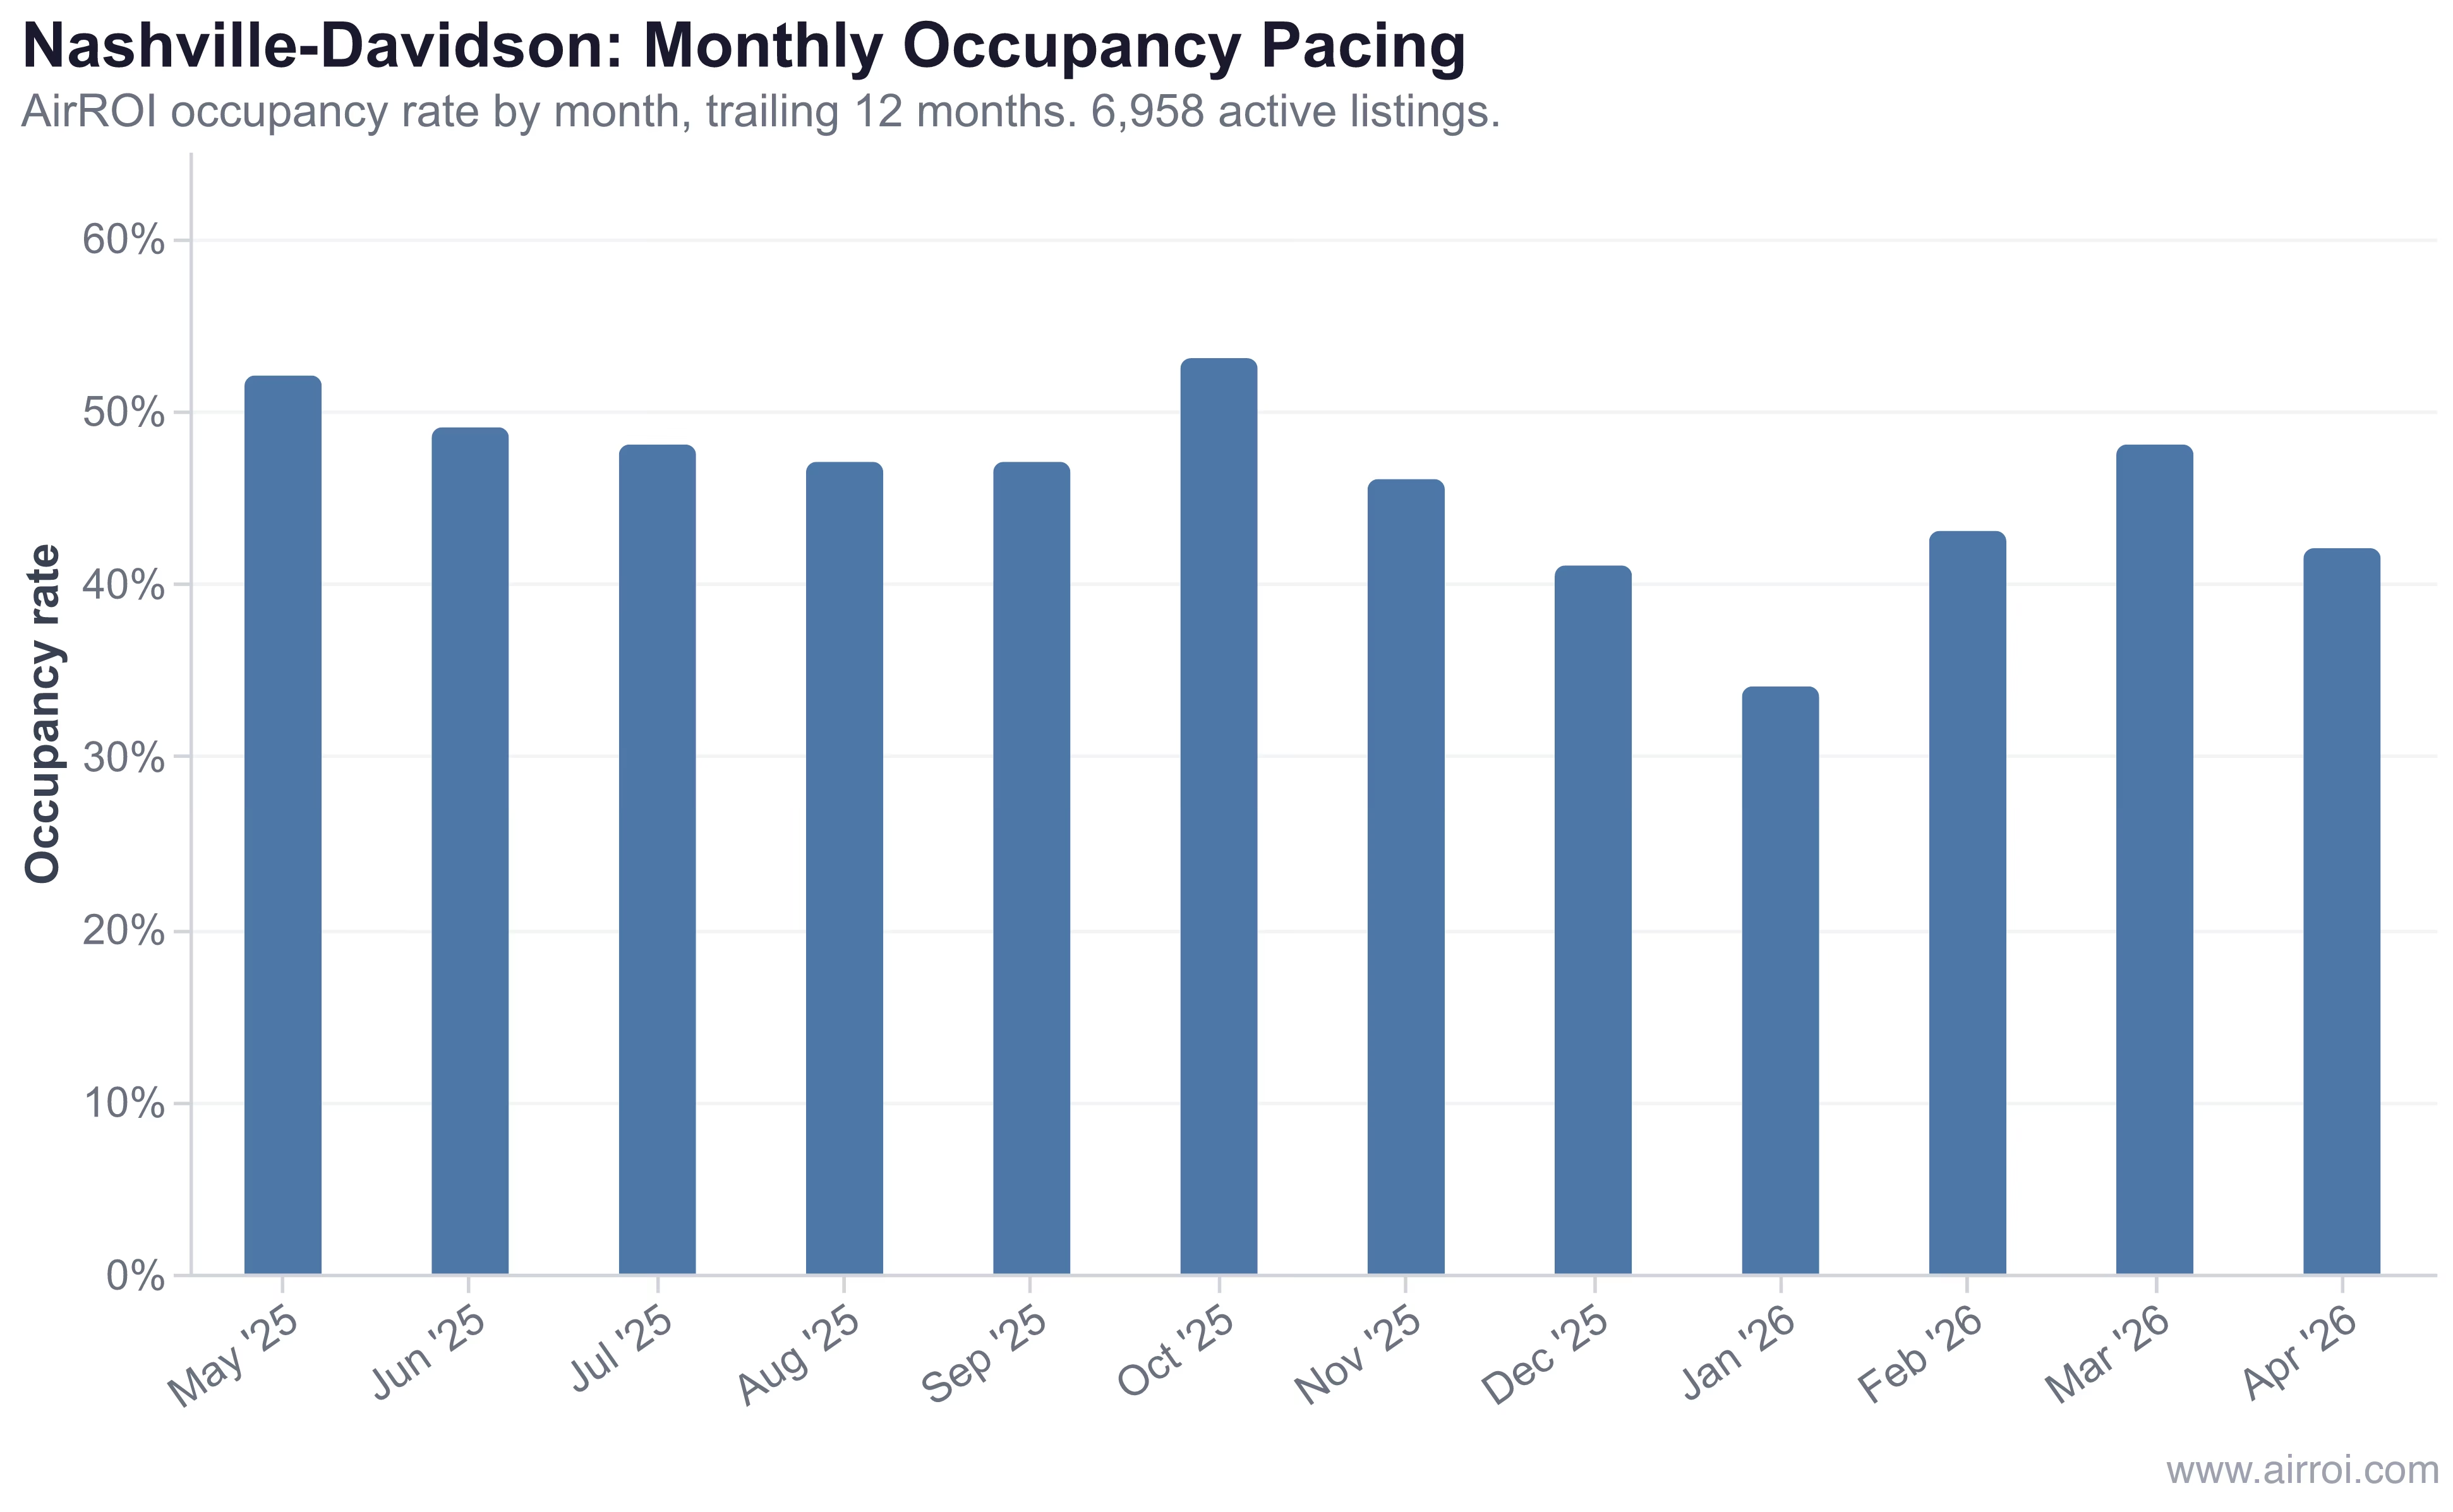
In AirROI's analysis of 6,958 active listings across Nashville-Davidson, occupancy ranged from a January low of 34% to an October peak of 53%, with secondary strength in May (52%) and a summer plateau in the high 40s. A host tracking pacing in early September whose October bookings are running ahead of last year's 53% has a concrete signal to raise weekend rates — not a vague sense that demand "seems strong."
The value of a pacing report is not the number itself — it is the comparison to last year at the same point in time, which strips out seasonality and reveals whether this year's demand curve is steeper or flatter than the one you already survived.
Why Pacing Matters for STR Revenue Management
- Early warning system: Pacing alerts you to demand shifts weeks before the stay date, when pricing changes still influence booking behavior. By the time a night shows as underbooked on check-in day, the opportunity to recover revenue is gone.
- Pricing confidence: When pacing 20% or more ahead, raising rates by 10–15% on remaining availability converts demand into margin. When pacing 20% or more behind, opening shorter minimum stays — not just discounting — often recovers more bookings than price cuts alone.
- Revenue forecasting: A pacing-based forecast is more accurate than historical-average projections because it incorporates current demand signals. A property with 60% of its summer revenue already on the books in February is far less exposed to a soft spring booking season than its peers.
- Year-over-year context: Because pacing compares the same future window at the same calendar point, it naturally controls for seasonality. A 30% fill rate in January is not alarming if the prior January showed 28% at this same point.
Pacing Response Framework
| Pacing Status | Nights vs. Last Year | Recommended Action |
|---|---|---|
| Significantly ahead | +20% or more | Raise rates 10–15%, increase minimum stay length |
| Slightly ahead | +5% to +20% | Modest rate increase, hold availability settings |
| On pace | -5% to +5% | Maintain current pricing; monitor weekly |
| Slightly behind | -5% to -20% | Lower rates 5–10%, reduce minimum stay to open gaps |
| Significantly behind | -20% or more | Aggressive discounting, open all availability, last-minute deals |
How to Use Pacing Data Effectively
- Check pacing weekly for the next 30, 60, and 90 days. A single snapshot misses the velocity of change — a property pacing 5% behind today but improving week-over-week is in a different position than one deteriorating at the same rate.
- Compare nights and revenue pacing separately to catch rate-compression signals early. Revenue pacing behind nights pacing means ADR is sliding.
- Layer in lead time data to calibrate urgency. In a 55-day-lead market, a 60-day pacing deficit demands immediate action. In a 35-day-lead market, the same deficit at 60 days may resolve naturally.
- Account for year-over-year anomalies: If last year's comparable period included a large local event that inflated bookings, this year will look artificially weak. Adjust your baseline for known distortions.
- Set automated pacing rules in your dynamic pricing tool to trigger rate changes when bookings cross defined ahead/behind thresholds. This removes the manual monitoring burden and ensures consistent execution. Our guide to data-driven dynamic pricing for STRs walks through how to configure these rules.
Frequently Asked Questions
Pacing compares your current forward-looking bookings (reservations on the books for future dates) to where you were at the same point last year. If you have 18 nights booked for next month compared to 14 at this time last year, you are pacing 29% ahead — a clear signal that demand is stronger and rates can rise.
A pacing report shows future booked nights or revenue compared to the same future period measured at the same point in the prior year. Pacing ahead means demand is stronger; pacing behind means you may need to adjust pricing or reduce minimum stays to stimulate bookings before those dates close.
If you are pacing ahead of last year, raise rates on remaining available dates — demand is strong enough to absorb the increase. If pacing behind, lower rates or open shorter minimum stays early enough to compete for bookings. Pacing gives you an early warning system to act before vacant nights become permanently lost revenue.
Fill rate (same as occupancy) varies by market and season. In Nashville-Davidson, AirROI data shows monthly fill rates ranging from 34% in January to 53% in October across 6,958 active listings — so a fill rate that looks low in isolation may be perfectly normal once you benchmark it against the same month last year.
Track pacing for the next 30, 60, and 90 days simultaneously. The 30-day window catches last-minute demand shifts; the 60- and 90-day windows give you time to adjust rates meaningfully. Markets with long booking lead times — Gatlinburg books 57 days out on average — reward monitoring at 90 days or beyond.