Airbnb market data · 202612 months to September 2026
Capurganá, Colombia Airbnb Market Data: Revenue, Occupancy & Trends
The average Airbnb in Capurganá brought in COP 12,305,801 over the 12 months through September 2026, across just 22 active listings, so a single property can move that figure.
The short answer
Capurganá Airbnb Market at a Glance
Listings averaged COP 258,474 a night and were booked on 23% of available nights, close to the Chocó average on both counts.
Timing matters: in June, the best month, the average listing earned about twice as much as in April, the slowest. With only 22 active listings, a few bookings can reorder the months.
With 22 active listings, Capurganá is the fourth-largest of 4 Chocó markets AirROI tracks.
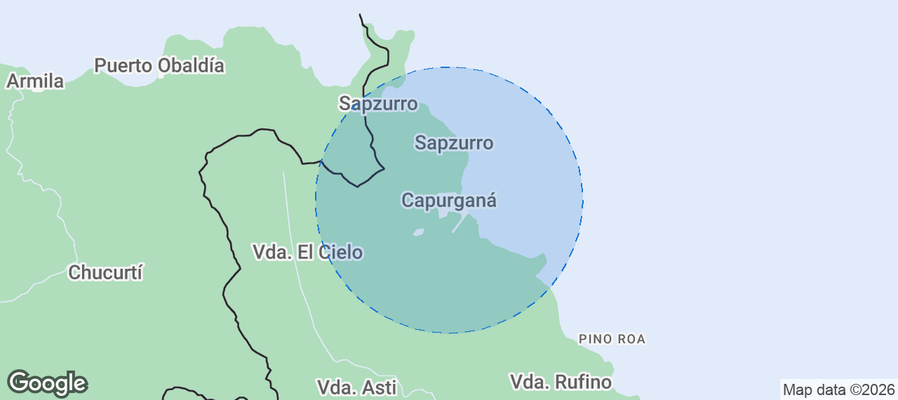 Browse the live Capurganá Airbnb market See Every Capurganá Listing
Revenue
How Much Do Airbnb Hosts Make in Capurganá?
Gross bookings per Capurganá listing averaged COP 12,305,801 over the 12 months to September 2026 (Chocó average: COP 10,544,778), before cleaning, platform and management costs and taxes.
The average Capurganá listing brought in COP 3,090,000 in June, its best month, and COP 1,500,000 in April, its slowest. The three strongest months bring in 32% of a full year's revenue, where an even calendar would give any three months 25%.
Across Capurganá's 22 active listings, monthly revenue by tier:
- Best-in-class properties (top 10%) earn COP 4,440,000+ a month, about 2.3 times the typical property.
- Strong performers (top 25%) earn COP 3,180,000 or more, roughly COP 1,300,000 a month above the median.
- Typical properties (median) earn about COP 1,930,000 a month.
- Entry-level properties (bottom 25%) earn COP 998,000 or less, about half of the median.
These are monthly figures for listings active in each month. The annual average above also counts listings that operated for only part of the year, so it runs below twelve times these figures.
June earned about twice what April did
Average revenue per active listing, by month, September 2025 to August 2026
The dashed line is the average of the months shown, COP 2,260,000.
Capurganá Airbnb Data by Month
Latest 12 months in the September 2026 data. September's figures are still coming in, so the rows run to August.
June 2026 led on revenue. Nightly rates peaked in July 2026 and bookings in October 2025, so the best-paying month is not always the busiest or the priciest.
| Month | Avg. Revenue | Occupancy | Avg. Nightly Rate | RevPAR | Booking Lead Time | Avg. Length of Stay |
|---|---|---|---|---|---|---|
| Sep 2025 | COP 2,013,250 | 37.8% | COP 218,943 | COP 67,108 | 53 days | 2.3 nights |
| Oct 2025 | COP 2,824,669 | 39.3% | COP 227,121 | COP 91,118 | 51 days | 3.3 nights |
| Nov 2025 | COP 2,514,420 | 36.1% | COP 227,838 | COP 83,814 | 72 days | 2.3 nights |
| Dec 2025 | COP 2,356,025 | 31.5% | COP 249,100 | COP 76,001 | 53 days | 3.2 nights |
| Jan 2026 | COP 2,257,442 | 31.2% | COP 247,765 | COP 72,821 | 18 days | 4.4 nights |
| Feb 2026 | COP 2,453,140 | 29.6% | COP 240,405 | COP 87,612 | 37 days | 5.9 nights |
| Mar 2026 | COP 1,674,648 | 19.4% | COP 248,466 | COP 54,021 | 32 days | 2.7 nights |
| Apr 2026 | COP 1,496,028 | 17.9% | COP 252,688 | COP 49,868 | 16 days | 2.3 nights |
| May 2026 | COP 1,843,658 | 16.6% | COP 284,381 | COP 59,473 | 41 days | 2.6 nights |
| Jun 2026 | COP 3,093,000 | 32.8% | COP 284,746 | COP 103,100 | 27 days | 3.8 nights |
| Jul 2026 | COP 2,670,368 | 21.6% | COP 295,333 | COP 86,141 | 46 days | 3.9 nights |
| Aug 2026 | COP 1,910,323 | 21.9% | COP 293,971 | COP 61,623 | 19 days | 3 nights |
Averages per active listing in each month. Highlighted: the highest-revenue month of the 12. RevPAR is the month's revenue spread over its nights, booked or not. Booking lead time is the days between booking and check-in, and length of stay the nights per booking, for stays in that month.
These are market-wide figures. To see what one particular Capurganá home could earn, enter its address, bedrooms and guests in the Airbnb calculator; it compares the home with similar listings nearby.
Profit
Is an Airbnb in Capurganá Profitable?
Yes, as extra income from a home or room you already have. The average Capurganá Airbnb took in COP 12,305,801 in the 12 months to September 2026, counting listings open only part of the year, and a listing in the top quarter, run by its owner at everyday costs, keeps about COP 1,270,000 a month after running costs.
These amounts come before housing costs. Where the mortgage or rent is less each month, the difference is profit; a home owned outright keeps it all after property tax, home insurance and any building or condo fees.
Capurganá Airbnb Income, Expenses and Profit per Year
| Line | Average listing | Top-quarter listing |
|---|---|---|
| Money in | ||
| Nightly bookings | COP 11,915,801 | COP 19,590,000 |
| Cleaning fees guests pay3% of Capurganá bookings | COP 390,000 | COP 640,000 |
| Gross bookings | COP 12,305,801 | COP 20,230,000 |
| Running costs | ||
| Airbnb's feeAbout 10%: 15.5% for the 59% of Capurganá listings on Simplified Pricing, 3% for the rest | −COP 1,280,000 | −COP 2,100,000 |
| Cleaning and laundryPaid for by the cleaning fee; COP 0 if you clean yourself | −COP 390,000 | −COP 640,000 |
| Utilities and internetAbout 5% of bookings | −COP 620,000 | −COP 1,010,000 |
| Guest suppliesToiletries, coffee, paper goods: about 2% | −COP 250,000 | −COP 400,000 |
| Repairs and upkeepIncluding linens and small replacements: about 3% | −COP 370,000 | −COP 610,000 |
| Short-term rental insuranceOne policy, on top of Airbnb's free AirCover | −COP 120,000 | −COP 120,000 |
| Permit and registrationWhere one is required | −COP 60,000 | −COP 60,000 |
| ManagementCOP 0 when you run it; co-hosts charge from about 10% of nightly bookings | COP 0 | COP 0 |
| Pricing and messaging toolsOptional; Airbnb's own tools are free | COP 0 | COP 0 |
| Lodging taxesAdded to the guest's bill and passed on | COP 0 | COP 0 |
| Total running costsAbout 22% of bookings, plus cleaning paid for by the cleaning fee | −COP 3,090,000 | −COP 4,940,000 |
| Left for housing costs, then profit | COP 9,215,801about COP 770,000 a month | COP 15,290,000about COP 1,270,000 a month |
| Housing costs | ||
| Mortgage or rent, property tax, home insurance, building or condo fees | Depend on the home | |
Estimate Your Own Capurganá Airbnb Profit
The estimate starts from Capurganá's average listing, run by its owner. Change how the listing performs, who runs it and who cleans to see what is left for the mortgage or rent.
To work out the profit on one Capurganá home, with its price, its mortgage or rent and your own costs, use the Airbnb profit calculator. It starts from the comparable listings around the address.
How Capurganá's Top Earners Get There
- More nights booked. The busiest quarter of Capurganá listings are booked on 39% or more of their nights, against 25% for the median listing. Ten more booked nights a year at the median rate of COP 229,000 adds about COP 2,290,000 in bookings.
- Prices that follow demand. Ranked by price, the top quarter charge COP 310,000 a night or more, against a median of COP 229,000. That is a separate ranking from the busiest quarter, so the two marks don't multiply into one listing's takings. For the average listing, a 10% higher rate on the nights it already books adds about COP 1,190,000 a year.
- Open for the busy months. June brought the average listing about COP 3,090,000, against COP 1,500,000 in April, so a calendar that is open and full in the busy months carries the year.
- Reviews that stand out. Capurganá listings average 4.68 stars, and 9% carry Airbnb's Guest Favorite badge, which guests can filter for.
What a listing keeps comes down to the figures this page measures: nightly rate, nights booked and the months it's open. A listing at the top-quarter mark takes in about COP 1,690,000 a month, against COP 1,030,000 for the average one.
Occupancy
What Is the Airbnb Occupancy Rate in Capurganá?
Capurganá listings were booked on 23% of the nights they were open over the past year, in line with the Chocó average and 10 percentage points below the Colombia average (33%). Occupancy climbs to 39% in October and falls to 17% in May.
Across Capurganá's 22 active listings, the share of open nights booked by tier:
- Best-in-class properties (top 10%) are booked 52%+ of open nights, 27 points above the median.
- Strong performers (top 25%) fill 39% or more, roughly two and a half nights a week.
- Typical properties (median) fill about 25% of open nights.
- Entry-level properties (bottom 25%) fill 14% or less, under two nights a week.
October was the busiest month in Capurganá, May the quietest
Share of open nights booked, by month, September 2025 to August 2026
The 12-month rate of 23% averages each listing's whole year, slow months included; each month here counts only the listings booked in it.
Nightly rates
How Much Does an Airbnb Cost per Night in Capurganá?
The average nightly rate in Capurganá, known as ADR (average daily rate), was COP 258,474 over the past year, about the same as the Chocó average (COP 257,000) and about 27% below the Colombia average of COP 353,000. Rates peak in July and August at about COP 295,000 and bottom out in September at about COP 219,000.
Across Capurganá's 22 active listings, nightly rates by tier:
- Best-in-class properties (top 10%) charge COP 403,000+ a night, about 1.8 times the median.
- Strong performers (top 25%) charge COP 310,000 or more, about COP 81,000 above the median.
- Typical properties (median) charge about COP 229,000 a night.
- Entry-level properties (bottom 25%) charge COP 156,000 or less, about two-thirds of the median.
July rates ran 35% above September's
Average nightly rate (ADR), by month, September 2025 to August 2026
The dashed line is the average of the months shown, COP 256,000.
What Is the RevPAR for Airbnb in Capurganá?
RevPAR, or revenue per available night, divides a listing's income by every night it was open to book, so it rises with both price and bookings. In Capurganá it averaged COP 60,900 over the past year, from about COP 49,900 in April to about COP 103,000 in June.
Across Capurganá's 22 active listings, RevPAR by tier:
- Best-in-class properties (top 10%) earn COP 116,000+ per open night, about 2.6 times the median.
- Strong performers (top 25%) earn COP 84,300 or more, about COP 39,000 a night above the median.
- Typical properties (median) earn about COP 45,100 per open night.
- Entry-level properties (bottom 25%) earn COP 35,300 or less, about three-quarters of the median.
June RevPAR was about twice April's
Revenue per open night (RevPAR), by month, September 2025 to August 2026
The dashed line is the average of the months shown, COP 74,400. The 12-month RevPAR of COP 60,900 averages each listing's whole year, slow months included; each month here counts only the listings booked in it.
Seasonality
Best and Worst Months for Airbnb in Capurganá
With only 22 active listings, the monthly pattern in Capurganá is noisy, since a few long or pricey stays can lift a month; revenue peaked in June and bottomed out in April.
How Far in Advance Do Guests Book Airbnb in Capurganá?
Guests book Capurganá stays 31 days ahead on average (about four weeks). November stays are booked furthest out, about 72 days ahead, and April stays closest to arrival, about 16 days. A typical November booking is made in early September.
November stays are booked furthest ahead
Average days between booking and check-in, by month of stay, September 2025 to August 2026
The 12-month figure of 31 days averages each listing's year as a whole; each month here averages only the listings with stays in it.
Permits
Airbnb Permits and Registration in Capurganá
All 22 active listings in Capurganá display a registration, permit or license number. The share shows what hosts display, not what local rules allow: it can't show whether new permits are still issued, or whether limits on nights, zones or property types apply.
Registration, permit, zoning and tourist-tax rules vary by address and change often, so confirm them with the local authority before buying or listing in Capurganá.
Neighborhoods
Best Neighborhoods for Airbnb in Capurganá
AirROI's area guide picks eight Capurganá neighborhoods that draw short-term rental guests, led by Capurganá Beach, La Miel and Cabo de la Vela. The picks reflect guest appeal, not earnings data or permit eligibility, so check local permit rules for a specific address before buying.
| Area | Who it suits | Landmarks nearby |
|---|---|---|
| Capurganá Beach | Beautiful Caribbean beach area known for its stunning natural scenery and proximity to island hopping opportunities. | Capurganá Beach, El Cielo Beach, Isla de San Blas, Dolphin Watching Tours, Hiking to La Manuela |
| La Miel | Popular destination that offers a more secluded beach experience with serene surroundings, perfect for relaxation and nature lovers. | La Miel Beach, Biodiversity of the Darien, Local artisan markets, Water sports, Nature trails |
| Cabo de la Vela | A remote and spectacular beach area ideal for kitesurfing and experiencing the beauty of Colombia's northern coast. | Cabo de la Vela Beach, Kitesurfing, Desierto de la Tatacoa, Cultural experiences with local Wayuu community |
| Utría National Natural Park | An ecological paradise offering incredible biodiversity, perfect for eco-tourism and nature excursions. | Diverse marine life, Hiking trails, Whale watching (during season), Serene beaches, Rich flora and fauna |
| Playón de la Bodega | A charming, less crowded beach locale, ideal for families and those seeking a peaceful environment. | Playón de la Bodega Beach, Snorkeling sites, Local food shacks, Relaxation areas |
| Canoas de Punta Alegre | Home to stunning flora and fauna, this area is perfect for those interested in nature and local indigenous cultures. | Cultural visits with Embera community, Nature trails, Biodiversity hotspots, River excursions |
| Sambú Community | An indigenous community offering unique cultural experiences and eco-friendly tourist options, emphasizing sustainability. | Cultural experiences, Traditional crafts, Biodiversity exploration, Nature and river tours |
| Sapzurro | A picturesque beach area known for its vibrant underwater life and a gateway to the Panamanian border. | Sapzurro Beach, Snorkeling and diving spots, Hiking trails to La Piscina, Ecotourism opportunities |
Area descriptions are AI-assisted from public sources and are not checked against zoning.
Nearby markets
Capurganá vs. Nearby Airbnb Markets
Capurganá out-earns every one of the two nearby markets in the table, all within 66 km; the best of them, Necoclí, averaged about 10% less per listing.
Other Airbnb Markets in Chocó
- Nuquí Airbnb data 67 listings
- Bahía Solano (Mutis) Airbnb data 35 listings
See all 4 Chocó Airbnb markets
Markets Similar to Capurganá
Markets elsewhere in Colombia with a similar nightly rate and occupancy to Capurganá:
- Cabecera Municipal Airbnb data Colombia · COP 257,341/night · 26.1%
- Paipa Airbnb data Colombia · COP 279,334/night · 21.0%
- Yopal Airbnb data Colombia · COP 276,250/night · 25.1%
- San Gil Airbnb data Colombia · COP 245,739/night · 19.6%
- Jardín Airbnb data Colombia · COP 299,160/night · 22.0%
- Valledupar Airbnb data Colombia · COP 298,426/night · 21.9%
FAQ
Capurganá Airbnb FAQ
How much do Airbnb hosts make in Capurganá?
An active Capurganá Airbnb grossed COP 12,305,801 on average in the 12 months to September 2026, according to AirROI's tracking of 22 active listings. That is before cleaning, management, taxes and financing. Busier, better-run listings do far better: the top quarter took in COP 3,180,000 or more in a typical month.
How much can I make on Airbnb in Capurganá?
It depends most on the home's size, location and how it's run. The middle half of Capurganá listings earn between COP 998,000 and COP 3,180,000 in a typical month, and the top tenth COP 4,440,000 or more. For one home, enter its address and bedroom count in the Airbnb income calculator: it compares the home with similar listings nearby.
What is the average Airbnb occupancy rate in Capurganá?
Listings in Capurganá were booked on 23% of available nights over the past year. That compares with 22% for the Chocó average. October was the busiest month.
How much does an Airbnb cost per night in Capurganá?
The average booked night in Capurganá cost COP 258,474 before fees. Half of listings charge between COP 156,000 and COP 310,000, so bedroom count and location move the price more than the average suggests.
Do you need a permit for an Airbnb in Capurganá?
All active Capurganá listings display a registration, permit or license number. The share shows what hosts display, not what the rules allow, so confirm registration, permit and tourist-tax rules with the local authority before buying.
Is Airbnb profitable in Capurganá?
It can be, as extra income from a home or room you already have. The average Capurganá Airbnb grossed COP 12,305,801 in the 12 months to September 2026, 17% above the Chocó average of COP 10,544,778, though with only 22 active listings a single property can move that figure, counting listings open only part of the year, and a listing at the top-quarter mark, run by its owner with the cleaning fee covering the cleaner and everyday costs for Airbnb's fee, utilities, supplies, upkeep and insurance, keeps about COP 1,270,000 a month. Check a specific home in the Airbnb estimator.
When is Airbnb peak season in Capurganá?
June paid best over the past year, at COP 3,090,000 per active listing, and April paid least. The month-by-month table above shows how rates and bookings each move.
What is the Airbnb RevPAR in Capurganá?
Each night a Capurganá listing was open to book earned COP 60,900 on average over the past year, booked or not. That figure, revenue per available night (RevPAR), folds price and occupancy into one number; the top 10% of listings made COP 116,000 or more.
How far in advance do guests book Airbnbs in Capurganá?
Capurganá stays were booked 31 days (about four weeks) before arrival on average over the past year, so most of a month is booked well before it starts.
How long do guests stay at Airbnbs in Capurganá?
The average Capurganá Airbnb stay lasted 3.8 nights over the past year. A listing took 11 reservations over the year on average.
How are Airbnbs in Capurganá rated?
Guests rate Capurganá Airbnbs 4.68 out of 5 on average. Guests score communication highest and location lowest.
What are the best neighborhoods for Airbnb in Capurganá?
Capurganá Beach, La Miel and Cabo de la Vela draw the most short-term rental interest in Capurganá. The neighborhood guide explains what brings guests to each.
How many Airbnbs are there in Capurganá?
AirROI counted 22 active Airbnb listings in Capurganá as of September 2026. The closest tracked market is Acandí, 1 km away.
How much are Airbnb cleaning fees in Capurganá?
In Capurganá, nearly a third of listings add a cleaning fee. The median fee is COP 14,686, but a minority of much higher fees lifts the average to COP 29,373, so the median is the better guide.
Method
About This Data
Figures on this page cover 22 active Airbnb listings in Capurganá from October 2025 to September 2026 (trailing twelve months). AirROI refreshes them monthly from listing-level booking and calendar data covering 20+ million properties worldwide. AirROI measures bookings in US dollars; this page shows them in Colombian pesos at COP 3,672 per US$, the typical rate from October 2025 to September 2026. Annual revenue averages every listing active during the period, including those listed for only part of it; monthly figures average the listings active in each month; the tier lists show the spread. Neighborhood descriptions are AI-assisted. See the methodology for definitions.
Need this programmatically? The same metrics are available through the AirROI Airbnb Data API and bulk downloads in the data portal.