Massignano, Marche Airbnb Market Data 2025: STR Report & Statistics
How much can you earn on Airbnb in Massignano, Marche? Based on AirROI's 2025 dataset (March 2024 – February 2025), the short answer is $4,129 per year — at a $97 nightly rate, 29.4% occupancy, and a N/A RevPAR.
With just 18 active listings, Massignano is a micro-market where selective demand that rewards strong listing quality and pricing strategy. The market trimmed 33.3% of its supply while nightly rates moved higher — fewer listings competing for the same travelers, and those travelers are paying more. Hosts who can unlock occupancy through standout listings, flexible policies, and targeted marketing have clear revenue upside.
Regulation is high, and hosts should factor licensing costs and compliance timelines into their launch plan. In a market this size, differentiated listings with strong reviews can capture outsized returns relative to the competition.
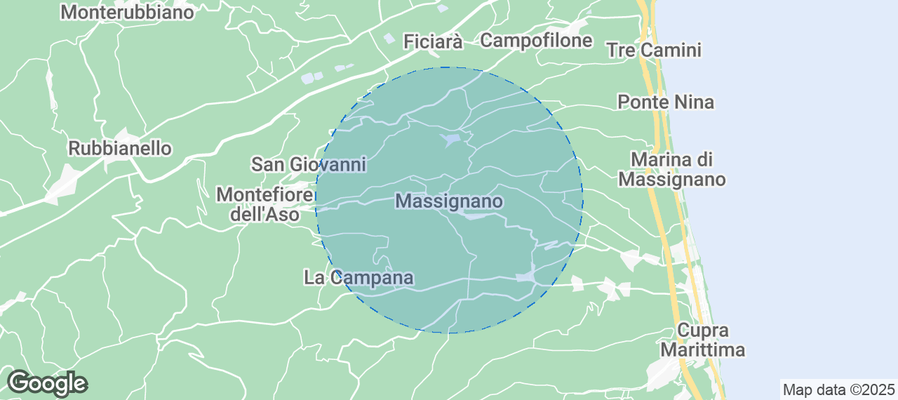
Table of Contents [hide] [show]
What Are the Key Airbnb Metrics in Massignano?
In Massignano, the headline Airbnb metrics are $4,129 in average annual revenue,29.4% occupancy, $97 ADR, and $0 in RevPAR, and guests book about 69 days in advance.
How Much Do Airbnb Hosts Earn Monthly in Massignano?
Understanding the monthly revenue variations for Airbnb listings in Massignano is key to maximizing your short term rental income potential. Seasonality significantly impacts earnings. Our analysis, based on data from the past 12 months, shows that the peak revenue month for STRs in Massignano is typically August, while March often presents the lowest earnings, highlighting opportunities for strategic pricing adjustments during shoulder and low seasons. Explore the typical Airbnb income in Massignano across different performance tiers:
- Best-in-class properties (Top 10%) achieve $1,384+ monthly, often utilizing dynamic pricing and superior guest experiences.
- Strong performing properties (Top 25%) earn $928 or more, indicating effective management and desirable locations/amenities.
- Typical properties (Median) generate around $460 per month, representing the average market performance.
- Entry-level properties (Bottom 25%) see earnings around $258, often with potential for optimization.
Average Monthly Airbnb Earnings Trend in Massignano
What Is the Monthly Airbnb Occupancy Rate in Massignano?
Maximize your bookings by understanding the Massignano STR occupancy trends. Seasonal demand shifts significantly influence how often properties are booked. Typically, Augustsees the highest demand (peak season occupancy), while March experiences the lowest (low season). Effective strategies, like adjusting minimum stays or offering promotions, can boost occupancy during slower periods. Here's how different property tiers perform in Massignano:
- Best-in-class properties (Top 10%) achieve 41%+ occupancy, indicating high desirability and potentially optimized availability.
- Strong performing properties (Top 25%) maintain 29% or higher occupancy, suggesting good market fit and guest satisfaction.
- Typical properties (Median) have an occupancy rate around 16%.
- Entry-level properties (Bottom 25%) average 9% occupancy, potentially facing higher vacancy.
Average Monthly Occupancy Rate Trend in Massignano
What Is the Average Airbnb Nightly Rate in Massignano?
Effective short term rental pricing strategy in Massignano involves understanding monthly ADR fluctuations. The Average Daily Rate (ADR) for Airbnb in Massignano typically peaks in July and dips lowest during November. Leveraging Airbnb dynamic pricing tools or strategies based on this seasonality can significantly boost revenue. Here's a look at the typical nightly rates achieved:
- Best-in-class properties (Top 10%) command rates of $157+ per night, often due to premium features or locations.
- Strong performing properties (Top 25%) achieve nightly rates of $116 or more.
- Typical properties (Median) charge around $92 per night.
- Entry-level properties (Bottom 25%) earn around $77 per night.
Average Daily Rate (ADR) Trend by Month in Massignano
What Is the RevPAR for Airbnb in Massignano?
RevPAR in Massignano is currently N/A. Because RevPAR combines nightly rates with realized occupancy, it is one of the cleanest ways to compare how efficiently listings turn demand into revenue across the market.
- Entry-level properties (Bottom 25%) see N/A RevPAR.
- Typical properties (Median) generate N/A RevPAR.
- Strong performers (Top 25%) earn N/A RevPAR.
- Best-in-class (Top 10%) achieve N/A RevPAR.
Average Monthly RevPAR Trend in Massignano
RevPAR Insights for Massignano
- RevPAR peaks in Jan and bottoms out in Jan, mirroring the broader seasonal demand pattern and suggesting opportunities for dynamic pricing.
Recommendations for Hosts
- Track your own RevPAR monthly against these Massignano benchmarks. If your RevPAR falls below the median of N/A, examine whether low occupancy or low ADR is the primary drag.
- Use RevPAR rather than revenue alone when comparing properties of different sizes — it normalizes for available nights and gives a more accurate picture of performance.
Get Live Massignano Market Intelligence 👇
Explore Real-time Analytics
When Is the Peak Season for Airbnb in Massignano?
Massignano's peak Airbnb season falls in August, October, July, while the softest stretch is January, March, May. Overall, the market shows highly seasonal trends requiring careful strategy, which should guide pricing, minimum stays, and cash-flow planning.
Peak Season (August, October, July)
- Revenue averages $1,273 per month
- Occupancy rates average 38.2%
- Daily rates average $108
Shoulder Season
- Revenue averages $606 per month
- Occupancy maintains around 18.7%
- Daily rates hold near $99
Low Season (January, March, May)
- Revenue drops to average $202 per month
- Occupancy decreases to average 6.3%
- Daily rates adjust to average $98
Seasonality Insights for Massignano
- Airbnb seasonality in Massignano is pronounced. Revenue swings sharply between peak and low months, which means pricing strategy, minimum-stay settings, and cash reserves all need to account for extended slower periods.
- During the high season, the absolute peak month showcases Massignano's highest earning potential, with monthly revenues climbing to $1,633, occupancy reaching 54.2%, and ADRs peaking at $116.
- Conversely, the slowest single month marks the market's lowest point — revenue may dip to $92, occupancy could drop to 4.0%, and ADRs may adjust to $91.
- Lower occupancy paired with meaningful seasonality means hosts in Massignano need to maximize every peak-season booking and seriously consider whether off-season pricing adjustments or minimum-stay changes can capture incremental revenue.
Seasonal Strategies for Maximizing Profit
- Peak Season: Maximize revenue through premium pricing. In a high-regulation market like Massignano, ensure your permit covers the number of nights you plan to book — some jurisdictions cap annual rental days.
- Low Season: Offer competitive pricing, extended-stay discounts, and flexible cancellation policies. Target off-season travelers like remote workers, budget-conscious guests, and travelers with flexible schedules.
- Shoulder Seasons: Implement dynamic pricing that bridges peak and low rates. Target weekend travelers, local events, and business visitors. Slightly more flexible terms than peak season can help maintain occupancy without deep discounting.
- In a highly seasonal market like Massignano, building a cash reserve during the top months is essential for covering fixed costs during the slow period. Automated pricing tools can help capture demand shifts in real time.
Do You Need a License for Airbnb in Massignano?
Massignano, Marche, Italy has a high regulation classification, yet only 44% of listings show registration evidence. That gap between regulation on the books and compliance on the ground can shift quickly — municipalities often tighten enforcement in waves, putting unregistered operators at risk of fines or delisting. Always verify the latest short-term rental regulations and Airbnb license requirements directly with local government authorities for Massignano to ensure full compliance before hosting.
(Source: AirROI data, 2026, based on 44% licensed listings)
What Are the Best Neighborhoods for Airbnb in Massignano?
With a compact short-term rental market, Massignano gives early-mover hosts an advantage in the right neighborhoods. The areas listed below are where guest demand and local attractions converge — a useful lens for investors evaluating whether to enter this market and where to position their listing.
| Neighborhood / Area | Why Host Here? (Target Guests & Appeal) | Key Attractions & Landmarks |
|---|---|---|
| Massignano Centro | Charming historic center with beautiful architecture, local shops, and restaurants. A great base for exploring the surrounding region and the coast. | Chiesa di Santa Maria, Piazza della Libertà, local trattorias, historic buildings |
| Pedaso Beach | A picturesque beach area known for its golden sands and calm waters. Ideal for families and beachgoers looking for relaxation and sun. | Pedaso beach, beachfront restaurants, water sports, scenic walks along the coast |
| Montegranaro | A nearby town famous for its shoe manufacturing, offering unique shopping experiences and local culture. Attractive for those seeking a quieter stay with local flair. | Shoe Museum, historic churches, local artisan shops, cultural events |
| Fermo | A historic city with a rich heritage and beautiful medieval architecture. Attracts visitors interested in history and culture, perfect for city tours. | Fermo Cathedral, Palazzo dei Priori, Roman Theatre, Civic Museum |
| Grottammare | A beautiful seaside town known for its beaches and vibrant promenade. Popular among tourists looking for both relaxation and nightlife. | Grottammare beach, Viale Secondo Moretti, historic old town, summer festivals |
| San Benedetto del Tronto | A lively coastal town with a bustling harbor and beautiful beaches. Great for those seeking entertainment, dining, and a vibrant seaside atmosphere. | San Benedetto del Tronto beach, Piazza B. Assisi, Fishermen's Wharf, summer beach clubs |
| Ascoli Piceno | A stunning hilltop city known for its medieval architecture and rich history. Attracts tourists interested in culture and gastronomy. | Piazza del Popolo, Palazzo dei Capitani, local food markets, historical sites |
| Ripatransone | A charming hill town with panoramic views and a laid-back atmosphere. Perfect for travelers looking for a peaceful retreat with beautiful landscapes. | Historic town center, Museo delle Conchiglie, vineyards, local wineries |
Because Massignano has a high regulation profile, confirming that short-term rental permits are available in your target neighborhood is a critical first step before committing to a property purchase. Regulation can vary at the neighborhood or district level even within the same city.
What Types of Properties Are on Airbnb in Massignano?
Room Type Distribution
Property Type Distribution
Market Composition Insights for Massignano
- The Massignano Airbnb market composition is heavily skewed towards Entire Home/Apt listings, which make up 77.8% of the 18 active rentals. This indicates strong guest preference for privacy and space.
- Looking at the property type distribution in Massignano, Apartment/Condo properties are the most common (55.6%), reflecting the local real estate landscape.
- Houses represent a significant 22.2% portion, catering likely to families or larger groups.
- The presence of 16.7% Hotel/Boutique listings indicates integration with traditional hospitality.
Massignano Airbnb Room Capacity Analysis (2026): Bedroom Distribution
Distribution of Listings by Number of Bedrooms
Room Capacity Insights for Massignano
- The dominant room capacity in Massignano is 2 bedrooms listings, making up 38.9% of the market. This suggests a strong demand for properties suitable for couples or solo travelers.
- Together, 2 bedrooms and 1 bedroom properties represent 61.1% of the active Airbnb listings in Massignano, indicating a high concentration in these sizes.
- A significant 33.4% of listings offer 3+ bedrooms, catering to larger groups and families seeking more space in Massignano.
Massignano Vacation Rental Guest Capacity Trends (2026)
Distribution of Listings by Guest Capacity
Guest Capacity Insights for Massignano
- The most common guest capacity trend in Massignano vacation rentals is listings accommodating 4 guests (27.8%). This suggests the primary traveler segment is likely small families or groups.
- Properties designed for 4 guests and 3 guests dominate the Massignano STR market, accounting for 44.5% of listings.
- 27.9% of properties accommodate 6+ guests, serving the market segment for larger families or group travel in Massignano.
- On average, properties in Massignano are equipped to host 4.2 guests.
What Amenities Do Airbnb Guests Expect in Massignano?
Amenity Prevalence
Amenity Insights for Massignano
- Popular amenities like Kitchen, Essentials, Free parking on premises are common but not universal. Offering these can provide a competitive edge.
- Warning: Wifi is not universally provided but is considered essential globally. Ensure reliable Wifi is offered.
Recommendations for Hosts
- Consider adding popular differentiators like Kitchen or Essentials to increase appeal.
- Highlight unique or less common amenities you offer (e.g., hot tub, dedicated workspace, EV charger) in your listing description and photos.
- Regularly check competitor amenities in Massignano to stay competitive.
Dive Deeper: Advanced Massignano STR Market Data (2026)
Ready to unlock more insights? AirROI provides access to advanced metrics and comprehensive Airbnb data for Massignano. Explore detailed analytics beyond this report to refine your investment strategy, optimize pricing, and maximize your vacation rental profits.
Explore Advanced MetricsMassignano Airbnb Guest Demographics & Profile Analysis (2026)
Guest Profile Summary for Massignano
- The typical guest profile for Airbnb in Massignano consists of a mix of domestic (62%) and international guests, often arriving from nearby Vlaardinger-Ambacht, typically belonging to the Post-2000s (Gen Z/Alpha) group (50%), primarily speaking Italian or English.
- Domestic travelers account for 61.9% of guests.
- Key international markets include Italy (61.9%) and Germany (14.3%).
- Top languages spoken are Italian (37.5%) followed by English (25%).
- A significant demographic segment is the Post-2000s (Gen Z/Alpha) group, representing 50% of guests.
Recommendations for Hosts
- Target domestic marketing efforts towards travelers from Vlaardinger-Ambacht and London.
- Tailor amenities and listing descriptions to appeal to the dominant Post-2000s (Gen Z/Alpha) demographic (e.g., highlight fast WiFi, smart home features, local guides).
- Highlight unique local experiences or amenities relevant to the primary guest profile.
- Consider seasonal promotions aligned with peak travel times for key origin markets.
Massignano Airbnb Booking Patterns (2026): Available vs. Booked Days
Available Days Distribution
Booked Days Distribution
Booking Pattern Insights for Massignano
- The most common availability pattern in Massignano falls within the 271-366 days range, representing 100% of listings. This suggests many properties have significant open periods on their calendars.
- Approximately 100.0% of listings show high availability (181+ days open annually), indicating potential for increased bookings or specific owner usage patterns.
- For booked days, the 31-90 days range is most frequent in Massignano (61.1%), reflecting common guest stay durations or potential owner blocking patterns.
How Far in Advance Do Guests Book Airbnb in Massignano?
Average Booking Lead Time by Month
Booking Lead Time Insights for Massignano
- The overall average booking lead time for vacation rentals in Massignano is 69 days.
- Guests book furthest in advance for stays during August (average 100 days), likely coinciding with peak travel demand or local events.
- The shortest booking windows occur for stays in May (average 0 days), indicating more last-minute travel plans during this time.
- Seasonally, Summer (66 days avg.) sees the longest lead times, while Spring (0 days avg.) has the shortest, reflecting typical travel planning cycles.
Recommendations for Hosts
- Use the overall average lead time (69 days) as a baseline for your pricing and availability strategy in Massignano.
- For August stays, consider implementing length-of-stay discounts or slightly higher rates for bookings made less than 100 days out to capitalize on advance planning.
- During May, focus on last-minute booking availability and promotions, as guests book with very short notice (0 days avg.).
- Target marketing efforts for the Summer season well in advance (at least 66 days) to capture early planners.
- Monitor your own booking lead times against these Massignano averages to identify opportunities for dynamic pricing adjustments.
Massignano Airbnb Minimum Stay Requirements Analysis
Distribution of Listings by Minimum Night Requirement
1 Night
2 listings
12.5% of total
2 Nights
1 listings
6.3% of total
3 Nights
5 listings
31.3% of total
4-6 Nights
5 listings
31.3% of total
7-29 Nights
3 listings
18.8% of total
Key Insights
- The most prevalent minimum stay requirement in Massignano is 3 Nights, adopted by 31.3% of listings. This highlights the market's preference for longer commitments.
- Very short stays (1-2 nights) are less common (18.8%), suggesting hosts prefer slightly longer bookings to optimize turnover.
Recommendations
- Align with the market by considering a 3 Nights minimum stay, as 31.3% of Massignano hosts use this setting.
- If feasible, allowing 1-night stays, especially midweek or during low season, could capture last-minute bookings, as only 12.5% currently do.
- Adjust minimum nights based on seasonality – potentially shorter during low season and longer during peak demand periods in Massignano.
Massignano Airbnb Cancellation Policy Trends Analysis (2026)
Flexible
3 listings
21.4% of total
Moderate
7 listings
50% of total
Strict
4 listings
28.6% of total
Cancellation Policy Insights for Massignano
- The prevailing Airbnb cancellation policy trend in Massignano is Moderate, used by 50% of listings.
- The market strongly favors guest-friendly terms, with 71.4% of listings offering Flexible or Moderate policies. This suggests guests in Massignano may expect booking flexibility.
Recommendations for Hosts
- Consider adopting a Moderate policy to align with the 50% market standard in Massignano.
- Regularly review your cancellation policy against competitors and market demand shifts in Massignano.
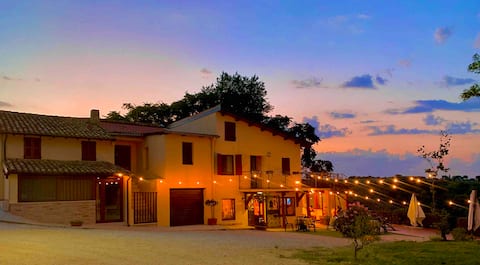
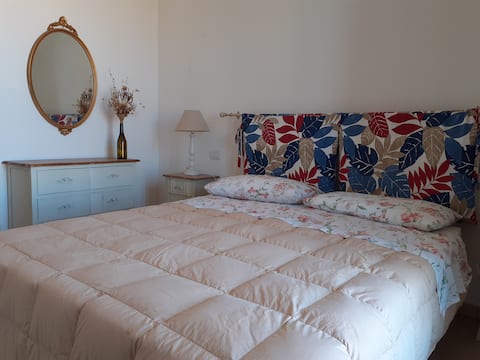
What Do the Top Airbnb Listings in Massignano Look Like?
Benchmark your potential! Explore examples of top-performing Airbnb properties in Massignanobased on Trailing Twelve Month (TTM) revenue. Analyze their characteristics, revenue, occupancy rate, and ADR to understand what drives success in this market.
Casa Lucetta hills and sea
Entire Place • 5 bedrooms
Agriturismo Chiaraluce Countryhouse 4km from the sea
Private Room • 6 bedrooms
Casa Adria
Entire Place • 2 bedrooms

Terrazzo sul Mare
Entire Place • 2 bedrooms

House surrounded by greenery 3 km from the sea
Entire Place • 2 bedrooms
Lovely apartment with 2min walk to the beach!
Entire Place • 1 bedroom
Note: Performance varies based on location, size, amenities, seasonality, and management quality. Data reflects the past 12 months.
Who Are the Top Airbnb Hosts in Massignano?
Learn from the best! This table showcases top-performing Airbnb hosts in Massignano based on the number of properties managed and estimated total revenue over the past year. Analyze their scale and performance metrics.
| Host Name | Properties | Grossing Revenue | Stay Reviews | Avg Rating |
|---|---|---|---|---|
| Luca | 1 | $9,753 | 14 | 4.57/5.0 |
| Miguel | 1 | $8,532 | 5 | 4.80/5.0 |
| Francesco | 1 | $7,900 | 19 | 4.68/5.0 |
| Host #260525782 | 1 | $7,164 | 0 | 0.00/5.0 |
| Sabina | 1 | $5,467 | 18 | 4.89/5.0 |
| Toni | 1 | $5,322 | 14 | 4.71/5.0 |
| Agnese | 2 | $4,846 | 35 | 4.37/5.0 |
| Tetyana | 1 | $4,508 | 4 | 4.75/5.0 |
| Cristina E Andrea | 1 | $4,172 | 16 | 4.69/5.0 |
| Manuela | 1 | $3,892 | 8 | 4.88/5.0 |
Analyzing the strategies of top hosts, such as their property selection, pricing, and guest communication, can offer valuable lessons for optimizing your own Airbnb operations in Massignano.
How Does Massignano's Airbnb Market Compare to Nearby Cities?
How does the Massignano Airbnb market stack up against its neighbors? Compare key performance metrics like average monthly revenue, ADR, and occupancy rates in surrounding areas to understand the broader regional STR landscape.
Compared with Deruta, Massignano has 9 percentage points lower occupancy and about $141 lower ADR. That helps frame whether this market is winning more on demand, pricing, or both.
| Market | Active Properties | Monthly Revenue | Daily Rate | Avg. Occupancy |
|---|---|---|---|---|
| Monte Castello di Vibio | 23 | $2,975 | $817.27 | 36% |
| Parrano | 18 | $2,918 | $327.84 | 34% |
| Guardea | 15 | $2,731 | $322.78 | 36% |
| Collazzone | 34 | $2,618 | $379.26 | 32% |
| Monteleone d'Orvieto | 33 | $2,406 | $295.17 | 36% |
| Lugnano in Teverina | 21 | $2,387 | $277.60 | 36% |
| Deruta | 15 | $2,349 | $237.80 | 38% |
| Stanišovi | 26 | $2,215 | $635.13 | 29% |
| Palombara Sabina | 16 | $2,195 | $349.79 | 36% |
| Lisciano Niccone | 32 | $2,129 | $379.44 | 33% |
Frequently Asked Questions About Airbnb in Massignano
These quick answers summarize the most common investor and operator questions using AirROI's latest market data for Massignano.
How much do Airbnb hosts make in Massignano?
Massignano hosts earn about $4,129 per year on average, with an average nightly rate of $97 and RevPAR of N/A. Those figures describe the typical revenue environment for active listings in Massignano, Marche, not the ceiling for the best operators. Source: AirROI 2025 data, Massignano market, March 2024 to February 2025.
What is the average Airbnb occupancy rate in Massignano?
The average Airbnb occupancy rate in Massignano is 29.4%. August is the strongest month and March is the softest, so hosts should expect demand to move meaningfully throughout the year rather than stay flat.
What is the average Airbnb daily rate in Massignano?
Listings in Massignano average $97 per night. The broader pricing spread also matters: lower-performing listings cluster closer to the lower quartiles, while premium homes can price materially above the city average when demand spikes or listing quality stands out.
How many Airbnb listings are active in Massignano?
Massignano currently has about 18 active Airbnb listings in AirROI's market dataset. That supply count helps explain how competitive the market is, how much depth there is for benchmarking, and whether the market behaves like a niche destination or a scaled urban market.
How strict are short-term rental regulations in Massignano?
AirROI currently classifies the short-term rental regulation level in Massignano as High. The dataset also shows about 44.4% of listings with registration evidence. That is a market signal, not legal advice, so hosts should still confirm current licensing and compliance rules locally before listing.
What is the RevPAR for Airbnb in Massignano?
RevPAR in Massignano is about N/A. That metric combines pricing and occupancy into one efficiency number, so it is often a better quick benchmark than ADR alone when investors want to compare how well listings convert nightly rates into realized revenue.
Is Airbnb profitable in Massignano?
Occupancy of 29.4% means Massignano is a more selective market. Profitability is achievable but requires careful cost management, premium positioning, or targeting longer stays to reduce turnover. Average annual revenue is $4,129, but individual returns depend on property type, location within the city, and the host's operating efficiency.
How far in advance do guests book Airbnb in Massignano?
The average booking lead time in Massignano is about 69 days — a longer planning horizon typical of destination or vacation markets where travelers book well in advance. Hosts who understand their market's booking cadence can adjust minimum stays and pricing windows accordingly.
What are the best neighborhoods for Airbnb in Massignano?
Based on AirROI's analysis, some of the top neighborhoods for short-term rentals in Massignano include Massignano Centro, Pedaso Beach, Montegranaro. Each area attracts different guest profiles — from business travelers to leisure visitors — so the best location depends on the property type and target audience a host is aiming for. See the full neighborhood breakdown above.
What type of property performs best on Airbnb in Massignano?
entire_home listings make up 77.8% of the active supply in Massignano. The most common configuration does not always mean the most profitable — operators who identify underserved property types or bedroom counts can sometimes outperform the market average by filling a gap in local supply.
How does Massignano compare to nearby Airbnb markets?
Among neighboring markets, Monte Castello di Vibio posts $35,705 in average annual revenue with 36.3% occupancy, compared to Massignano's $4,129 and 29.4%. Comparing nearby markets helps investors understand whether a destination's performance reflects local demand or broader regional trends.
When is the peak season for Airbnb in Massignano?
August is the highest-revenue month in Massignano, while May is the softest. The revenue spread between them indicates a highly seasonal market — revenue in the peak month is more than double the low month, so cash-flow planning and pricing automation are critical.
About AirROI Market Data
AirROI tracks over 20 million properties across 190+ countries and maintains 15+ years of historical performance data, making it one of the deepest Airbnb and STR intelligence platforms available. The analytics pipeline aggregates listing-level data monthly — revenue, occupancy, nightly rates, RevPAR, guest demographics, booking patterns, and competitive supply — so investors and operators can benchmark any market against its own history and against neighboring destinations.
Real estate investors, property managers, financial institutions, hedge funds, tourism boards, hospitality consultants, tech platforms, and academic researchers rely on AirROI data to underwrite acquisitions, optimize pricing, model macro trends, and conduct peer-reviewed research. Data is available through in-depth market reports like this one and the Airbnb API with 22 endpoints and an Airbnb MCP Server for AI agents.
AirROI proprietary analytics as of 2025-02-28. Metrics reflect trailing twelve-month aggregates from active listings. Revenue figures are market averages, not projections. Neighborhood descriptions are AI-generated and reviewed for accuracy. For full methodology, see the data methodology page.