Airbnb market data · 202612 months to October 2026
Tortona, Italy Airbnb Market Data: Revenue, Occupancy & Trends
The average Airbnb in Tortona brought in €8,777 over the 12 months through October 2026, across just 28 active listings, so a single property can move that figure.
The short answer
Tortona Airbnb Market at a Glance
Tortona is priced below the Piedmont average. Listings averaged €100 a night, about 31% less than that average of €145, and were booked on 39% of available nights, close to its 38% occupancy.
Timing matters: in August, usually the best month, the average listing earns about 2.2 times as much as in November, usually the slowest. With only 28 active listings, a few bookings can reorder the months.
With 28 active listings, Tortona is the 73rd-largest of 145 Piedmont markets AirROI tracks.
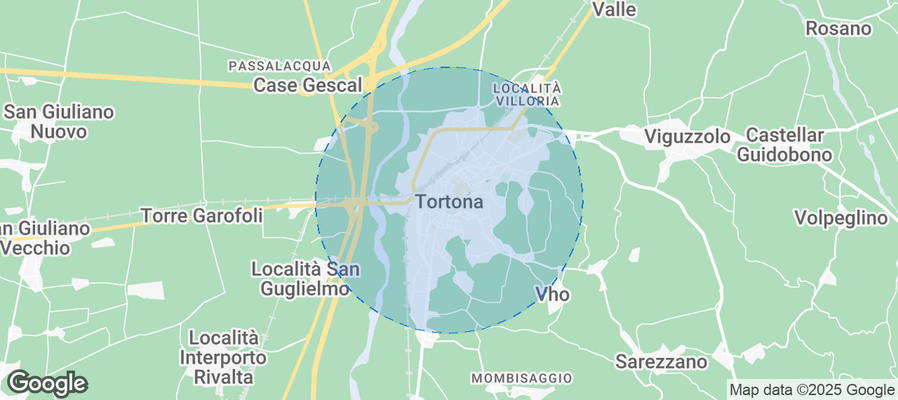 Browse the live Tortona Airbnb market See Every Tortona Listing
Revenue
How Much Do Airbnb Hosts Make in Tortona?
Gross bookings per Tortona listing averaged €8,777 over the 12 months to October 2026 (Piedmont average: €13,273), before cleaning, platform and management costs and taxes.
In a typical year, the average Tortona listing brings in €1,290 in August, its best month, and €582 in November, its slowest. July runs within 1% of August, so either can come out on top in a given year. The three strongest months bring in 33% of a full year's revenue, where an even calendar would give any three months 25%.
Across Tortona's 28 active listings, monthly revenue by tier:
- Best-in-class properties (top 10%) earn €1,940+ a month, about 2.1 times the typical property.
- Strong performers (top 25%) earn €1,420 or more, roughly €500 a month above the median.
- Typical properties (median) earn about €916 a month.
- Entry-level properties (bottom 25%) earn €446 or less, about half of the median.
These are monthly figures for listings active in each month. The annual average above also counts listings that operated for only part of the year, so it runs below twelve times these figures.
August earns about 2.2 times what November does
Average revenue per active listing, by month, October 2024 to September 2026
The dashed line is the average of the months shown, €958. Each point is one month as recorded, averaged over the listings active in it. The best and slowest months in the text average each calendar month over the past two years, so they can differ from the highest and lowest points here.
Tortona Airbnb Data by Month
Latest 12 months in the October 2026 data. October's figures are still coming in, so the rows run to September.
July 2026 led on revenue. Nightly rates peaked in August 2026 and bookings in June 2026, so the best-paying month is not always the busiest or the priciest. Across the past two years, August is usually the strongest month.
| Month | Avg. Revenue | Occupancy | Avg. Nightly Rate | RevPAR | Booking Lead Time | Avg. Length of Stay |
|---|---|---|---|---|---|---|
| Oct 2025 | €944 | 42.4% | €101 | €30 | 25 days | 3.1 nights |
| Nov 2025 | €806 | 30.6% | €105 | €27 | 32 days | 7 nights |
| Dec 2025 | €916 | 34.5% | €99 | €30 | 27 days | 4.5 nights |
| Jan 2026 | €839 | 30.6% | €99 | €27 | 19 days | 4 nights |
| Feb 2026 | €772 | 34.5% | €99 | €28 | 35 days | 3.3 nights |
| Mar 2026 | €978 | 38.6% | €99 | €32 | 24 days | 4.8 nights |
| Apr 2026 | €1,153 | 44.6% | €100 | €38 | 30 days | 4.6 nights |
| May 2026 | €1,137 | 41.1% | €103 | €37 | 42 days | 3 nights |
| Jun 2026 | €1,232 | 48.3% | €106 | €41 | 36 days | 7 nights |
| Jul 2026 | €1,383 | 45.3% | €107 | €45 | 63 days | 4.9 nights |
| Aug 2026 | €1,253 | 47.2% | €107 | €40 | 38 days | 3.8 nights |
| Sep 2026 | €1,016 | 42.4% | €104 | €34 | 29 days | 2.4 nights |
Averages per active listing in each month. Highlighted: the highest-revenue month of the 12. RevPAR is the month's revenue spread over its nights, booked or not. Booking lead time is the days between booking and check-in, and length of stay the nights per booking, for stays in that month.
These are market-wide figures. To see what one particular Tortona home could earn, enter its address, bedrooms and guests in the Airbnb income calculator; it compares the home with similar listings nearby.
Profit
Is an Airbnb in Tortona Profitable?
Yes, when it's run well. The average Tortona Airbnb took in €8,777 in the 12 months to October 2026, and run by its owner at everyday costs, about €480 a month of that is left after running costs, so a home that costs less than that to own or rent makes money. A listing in the top quarter leaves about €750 a month.
Cleaning it yourself keeps the €660 a year guests pay in cleaning fees, for about €540 a month. Handing the listing to a co-host at about 10% of nightly bookings still leaves about €410 a month.
These amounts come before housing costs. Where the mortgage or rent is less each month, the difference is profit; a home owned outright keeps it all after property tax, home insurance and any building or condo fees.
Tortona Airbnb Income, Expenses and Profit per Year
| Line | Average listing | Top-quarter listing |
|---|---|---|
| Money in | ||
| Nightly bookings | €8,117 | €12,570 |
| Cleaning fees guests pay8% of Tortona bookings | €660 | €1,020 |
| Gross bookings | €8,777 | €13,590 |
| Running costs | ||
| Airbnb's feeAbout 15%: 15.5% for the 96% of Tortona listings on Simplified Pricing, 3% for the rest | −€1,320 | −€2,050 |
| Cleaning and laundryPaid for by the cleaning fee; €0 if you clean yourself | −€660 | −€1,020 |
| Utilities and internetAbout 5% of bookings | −€440 | −€680 |
| Guest suppliesToiletries, coffee, paper goods: about 2% | −€180 | −€270 |
| Repairs and upkeepIncluding linens and small replacements: about 3% | −€260 | −€410 |
| Short-term rental insuranceOne policy, on top of Airbnb's free AirCover | −€90 | −€90 |
| Permit and registrationWhere one is required | −€40 | −€40 |
| Management€0 when you run it; co-hosts charge from about 10% of nightly bookings | €0 | €0 |
| Pricing and messaging toolsOptional; Airbnb's own tools are free | €0 | €0 |
| Lodging taxesAdded to the guest's bill and passed on | €0 | €0 |
| Total running costsAbout 27% of bookings, plus cleaning paid for by the cleaning fee | −€2,990 | −€4,560 |
| Left for housing costs, then profit | €5,787about €480 a month | €9,030about €750 a month |
| Housing costs | ||
| Mortgage or rent, property tax, home insurance, building or condo fees | Depend on the home | |
Estimate Your Own Tortona Airbnb Profit
The estimate starts from Tortona's average listing, run by its owner. Change how the listing performs, who runs it and who cleans to see what is left for the mortgage or rent.
To work out the profit on one Tortona home, with its price, its mortgage or rent and your own costs, use the Airbnb profit calculator. It starts from the comparable listings around the address.
How Tortona's Top Earners Get There
- More nights booked. The busiest quarter of Tortona listings are booked on 60% or more of their nights, against 37% for the median listing. Ten more booked nights a year at the median rate of €80 adds about €800 in bookings.
- Prices that follow demand. Ranked by price, the top quarter charge €98 a night or more, against a median of €80. That is a separate ranking from the busiest quarter, so the two marks don't multiply into one listing's takings. For the average listing, a 10% higher rate on the nights it already books adds about €810 a year.
- Open for the busy months. In a typical year, August brings the average listing about €1,290, against €582 in November, so a calendar that is open and full in the busy months carries the year.
- Reviews that stand out. Tortona listings average 4.75 stars, and 29% carry Airbnb's Guest Favorite badge, which guests can filter for.
What a listing keeps comes down to the figures this page measures: nightly rate, nights booked and the months it's open. A listing at the top-quarter mark takes in about €1,130 a month, against €730 for the average one.
Occupancy
What Is the Airbnb Occupancy Rate in Tortona?
Tortona listings were booked on 39% of the nights they were open over the past year, in line with the Piedmont average and in line with the Italy average. In a typical year, occupancy climbs to 45% in June and falls to 27% in November.
Across Tortona's 28 active listings, the share of open nights booked by tier:
- Best-in-class properties (top 10%) are booked 75%+ of open nights, 38 points above the median.
- Strong performers (top 25%) fill 60% or more, roughly four nights a week.
- Typical properties (median) fill about 37% of open nights.
- Entry-level properties (bottom 25%) fill 16% or less, under two nights a week.
June is usually the busiest month in Tortona, November the quietest
Share of open nights booked, by month, October 2024 to September 2026
Nightly rates
How Much Does an Airbnb Cost per Night in Tortona?
The average nightly rate in Tortona, known as ADR (average daily rate), was €100 over the past year, about 31% below the Piedmont average of €145 and about 46% below the Italy average of €185. In a typical year, rates peak in August and September at about €105 and bottom out in October and December at about €88.
Across Tortona's 28 active listings, nightly rates by tier:
- Best-in-class properties (top 10%) charge €200+ a night, about 2.5 times the median.
- Strong performers (top 25%) charge €98 or more, about €18 above the median.
- Typical properties (median) charge about €80 a night.
- Entry-level properties (bottom 25%) charge €72 or less, about 9% below the median.
August rates run 21% above December's
Average nightly rate (ADR), by month, October 2024 to September 2026
The dashed line is the average of the months shown, €98.
What Is the RevPAR for Airbnb in Tortona?
RevPAR, or revenue per available night, divides a listing's income by every night it was open to book, so it rises with both price and bookings. In Tortona it averaged €38 over the past year, from about €19 in a typical November to about €42 in a typical August.
Across Tortona's 28 active listings, RevPAR by tier:
- Best-in-class properties (top 10%) earn €71+ per open night, about twice the median.
- Strong performers (top 25%) earn €45 or more, about €9 a night above the median.
- Typical properties (median) earn about €36 per open night.
- Entry-level properties (bottom 25%) earn €21 or less, about 58% of the median.
August RevPAR is about 2.1 times November's
Revenue per open night (RevPAR), by month, October 2024 to September 2026
The dashed line is the average of the months shown, €31. The 12-month RevPAR of €38 averages each listing's whole year, slow months included; each month here counts only the listings booked in it.
Seasonality
Best and Worst Months for Airbnb in Tortona
With only 28 active listings, the monthly pattern in Tortona is noisy, since a few long or pricey stays can lift a month; revenue has tended to peak in August and bottom out in November.
Average revenue by month in Tortona
Average revenue per active listing, each calendar month averaged over the past two years
The dashed line is the average of the 12 calendar months, €958.
Revenue by month in Tortona in numbers
| Month | Revenue per listing |
|---|---|
| January | €791 |
| February | €828 |
| March | €916 |
| April | €957 |
| May | €1,050 |
| June | €1,230 |
| July | €1,290 |
| August | €1,290 |
| September | €1,030 |
| October | €789 |
| November | €582 |
| December | €757 |
How Far in Advance Do Guests Book Airbnb in Tortona?
Guests book Tortona stays 38 days ahead on average (about five weeks). July stays are booked furthest out, about 57 days ahead, and January stays closest to arrival, about 18 days. A typical July booking is made in mid-May.
July stays are booked furthest ahead
Average days between booking and check-in, by month of stay, October 2024 to September 2026
The 12-month figure of 38 days averages each listing's year as a whole; each month here averages only the listings with stays in it.
Permits
Airbnb Permits and Registration in Tortona
All 28 active listings in Tortona display a registration, permit or license number. The share shows what hosts display, not what local rules allow: it can't show whether new permits are still issued, or whether limits on nights, zones or property types apply.
Registration, permit, zoning and tourist-tax rules vary by address and change often, so confirm them with the local authority before buying or listing in Tortona.
Neighborhoods
Best Neighborhoods for Airbnb in Tortona
AirROI's area guide picks eight Tortona neighborhoods that draw short-term rental guests, led by Centro Storico, Tortona Railway Station Area and Parco Casale. The picks reflect guest appeal, not earnings data or permit eligibility, so check local permit rules for a specific address before buying.
| Area | Who it suits | Landmarks nearby |
|---|---|---|
| Centro Storico | The historical center of Tortona, featuring beautiful architecture and local markets. Ideal for tourists seeking culture and history, with easy access to shops and restaurants. | Tortona Cathedral, Piazza Duomo, Museo delle Arti, Chiesa di San Matteo, Tortona's local markets |
| Tortona Railway Station Area | A key transportation hub, convenient for travelers accessing nearby cities. This area attracts business visitors and those needing quick transit options. | Tortona Railway Station, Piazza Malaspina, Nearby dining options, Convenient transport links |
| Parco Casale | A green park area that offers relaxation and outdoor activities. Perfect for families and anyone looking to enjoy nature within the city. | Parco Casale, Playgrounds, Picnic areas, Walking trails |
| Via Emilia | A bustling street with shops, restaurants, and local life. It attracts visitors who want to experience the local culture and cuisine. | Restaurants and cafes, Local boutiques, Historical buildings, Cultural events |
| Stadio Comunale | The sports area home to local football games. Great for sports fans and families attending events and games. | Stadio Comunale, Local sports events, Nearby restaurants |
| Colline Tortonesi | The surrounding hills of Tortona, known for their wineries and stunning views. This area is perfect for wine lovers and those looking for tranquility. | Local wineries, Hiking trails, Scenic viewpoints |
| Local Vineyards | A great area to experience the wine culture of Piedmont, attracting wine enthusiasts and tourists interested in enogastronomy. | Vineyard tours, Wine tasting, Culinary experiences |
| Shopping District | The primary area for retail shopping in Tortona, appealing to those who love to shop and explore local Italian brands. | Shops and boutiques, Local crafts, Cafes and eateries |
Area descriptions are AI-assisted from public sources and are not checked against zoning.
Nearby markets
Tortona vs. Nearby Airbnb Markets
Of the eight nearby markets in the table, all within 42 km, Nizza Monferrato (42 km away, 45 listings) earned the most per listing, about 2.1 times as much as Tortona.
| Market | Listings | Avg. annual revenue | Avg. nightly rate | Occupancy |
|---|---|---|---|---|
| Novi Ligure 16 km | 42 | €9,936 | €110 | 34% |
| Voghera 16 km | 30 | €6,315 | €93 | 32% |
| Serravalle Scrivia 18 km | 34 | €6,245 | €144 | 25% |
| Alessandria 19 km | 87 | €8,565 | €93 | 36% |
| Acqui Terme 39 km | 54 | €14,317 | €154 | 36% |
| Pavia 40 km | 234 | €11,162 | €113 | 39% |
| Casale Monferrato 42 km | 62 | €6,886 | €113 | 28% |
| Nizza Monferrato 42 km | 45 | €18,507 | €233 | 31% |
Other Airbnb Markets in Piedmont
- Turin Airbnb data 4,345 listings
- Stresa Airbnb data 426 listings
- Verbania Airbnb data 279 listings
- Sauze d'Oulx Airbnb data 247 listings
- Alba Airbnb data 238 listings
- Sestriere Airbnb data 237 listings
- Bardonecchia Airbnb data 213 listings
- Asti Airbnb data 201 listings
See all 145 Piedmont Airbnb markets
Markets Similar to Tortona
Markets elsewhere in Italy with a similar nightly rate and occupancy to Tortona:
- Forlì Airbnb data Italy · €99/night · 39.3%
- Cremona Airbnb data Italy · €100/night · 38.8%
- Catania Airbnb data Italy · €101/night · 39.3%
- Isola delle Femmine Airbnb data Italy · €102/night · 38.7%
- Piacenza Airbnb data Italy · €101/night · 38.5%
- Ancona Airbnb data Italy · €104/night · 38.8%
FAQ
Tortona Airbnb FAQ
How much do Airbnb hosts make in Tortona?
An active Tortona Airbnb grossed €8,777 on average in the 12 months to October 2026, according to AirROI's tracking of 28 active listings. That is before cleaning, management, taxes and financing. Busier, better-run listings do far better: the top quarter took in €1,420 or more in a typical month.
How much can I make on Airbnb in Tortona?
It depends most on the home's size, location and how it's run. The middle half of Tortona listings earn between €446 and €1,420 in a typical month, and the top tenth €1,940 or more. For one home, enter its address and bedroom count in the Airbnb calculator: it compares the home with similar listings nearby.
What is the average Airbnb occupancy rate in Tortona?
Listings in Tortona were booked on 39% of available nights over the past year. That compares with 38% for the Piedmont average. June is usually the busiest month.
How much does an Airbnb cost per night in Tortona?
The average booked night in Tortona cost €100 before fees. Half of listings charge between €72 and €98; a few high-priced homes pull the average above that range.
Do you need a permit for an Airbnb in Tortona?
All active Tortona listings display a registration, permit or license number. The share shows what hosts display, not what the rules allow, so confirm registration, permit and tourist-tax rules with the local authority before buying.
Is Airbnb profitable in Tortona?
Yes, when it's run well. The average Tortona Airbnb grossed €8,777 in the 12 months to October 2026, 34% below the Piedmont average of €13,273, though with only 28 active listings a single property can move that figure. Run by its owner, with the cleaning fee covering the cleaner and everyday costs for Airbnb's fee, utilities, supplies, upkeep and insurance, €5,787 a year (about €480 a month) is left before the mortgage or rent. A home that costs less than that to own or rent makes a profit, and a listing at the top-quarter mark leaves about €750 a month. Check a specific home in the Airbnb estimator.
When is Airbnb peak season in Tortona?
August usually pays best, averaging €1,290 per active listing over the past two years, and November usually pays least. The month-by-month table above shows how the latest 12 months played out.
What is the Airbnb RevPAR in Tortona?
Each night a Tortona listing was open to book earned €38 on average over the past year, booked or not. That figure, revenue per available night (RevPAR), folds price and occupancy into one number; the top 10% of listings made €71 or more.
How far in advance do guests book Airbnbs in Tortona?
Tortona stays were booked 38 days (about five weeks) before arrival on average over the past year, so most of a month is booked well before it starts.
How long do guests stay at Airbnbs in Tortona?
The average Tortona Airbnb stay lasted 5 nights over the past year. A listing took 21 reservations over the year on average.
How are Airbnbs in Tortona rated?
Guests rate Tortona Airbnbs 4.75 out of 5 on average. Guests score check-in highest and value lowest.
What are the best neighborhoods for Airbnb in Tortona?
Centro Storico, Tortona Railway Station Area and Parco Casale draw the most short-term rental interest in Tortona. The neighborhood guide explains what brings guests to each.
How many Airbnbs are there in Tortona?
AirROI counted 28 active Airbnb listings in Tortona as of October 2026. The closest tracked market is Novi Ligure, 16 km away.
How much are Airbnb cleaning fees in Tortona?
In Tortona, more than four in ten listings add a cleaning fee, and the typical fee is about €45.
How many tourists visit Tortona, Italy?
All of Italy had 57.7 million international tourist arrivals in 2024, UN Tourism reports, via Our World in Data. AirROI estimates 583 Airbnb stays in Tortona, Italy in the 12 months to October 2026, which counts bookings and not tourists. See Italy tourism statistics.
Method
About This Data
Figures on this page cover 28 active Airbnb listings in Tortona from November 2025 to October 2026 (trailing twelve months). AirROI refreshes them monthly from listing-level booking and calendar data covering 20+ million properties worldwide. AirROI measures bookings in US dollars; this page shows them in euros at €0.86 per US$, the typical rate from November 2025 to October 2026. Annual revenue averages every listing active during the period, including those listed for only part of it; monthly figures average the listings active in each month; the tier lists show the spread. Neighborhood descriptions are AI-assisted. See the methodology for definitions.
Need this programmatically? The same metrics are available through the AirROI Airbnb Data API and bulk downloads in the data portal.