Nisporto, Tuscany Airbnb Market Data 2026: STR Report & Statistics
How much can you earn on Airbnb in Nisporto, Tuscany? Based on AirROI's 2026 dataset (July 2025 – June 2026), the short answer is $10,445 per year — at a $210 nightly rate, 40.3% occupancy, and a $85 RevPAR that reflects moderate rate-to-revenue efficiency with room to optimize.
At 61 active listings, Nisporto is a boutique market where moderate demand with room for well-positioned listings to outperform. Supply has held steady year over year while revenue and nightly rates climbed — a mature market where existing hosts capture more value per listing. Stable inventory paired with rising returns reflects healthy demand.
Regulation is high and 98% of listings show active registration — compliance is the cost of entry. In a market this size, differentiated listings with strong reviews can capture outsized returns relative to the competition.

Table of Contents [hide] [show]
What Are the Key Airbnb Metrics in Nisporto?
In Nisporto, the headline Airbnb metrics are $10,445 in average annual revenue,40.3% occupancy, $210 ADR, and $85 in RevPAR, and guests book about 79 days in advance.
How Much Do Airbnb Hosts Earn Monthly in Nisporto?
Understanding the monthly revenue variations for Airbnb listings in Nisporto is key to maximizing your short term rental income potential. Seasonality significantly impacts earnings. Our analysis, based on data from the past 12 months, shows that the peak revenue month for STRs in Nisporto is typically August, while February often presents the lowest earnings, highlighting opportunities for strategic pricing adjustments during shoulder and low seasons. Explore the typical Airbnb income in Nisporto across different performance tiers:
- Best-in-class properties (Top 10%) achieve $2,520+ monthly, often utilizing dynamic pricing and superior guest experiences.
- Strong performing properties (Top 25%) earn $1,737 or more, indicating effective management and desirable locations/amenities.
- Typical properties (Median) generate around $1,071 per month, representing the average market performance.
- Entry-level properties (Bottom 25%) see earnings around $650, often with potential for optimization.
Average Monthly Airbnb Earnings Trend in Nisporto
What Is the Monthly Airbnb Occupancy Rate in Nisporto?
Maximize your bookings by understanding the Nisporto STR occupancy trends. Seasonal demand shifts significantly influence how often properties are booked. Typically, Augustsees the highest demand (peak season occupancy), while February experiences the lowest (low season). Effective strategies, like adjusting minimum stays or offering promotions, can boost occupancy during slower periods. Here's how different property tiers perform in Nisporto:
- Best-in-class properties (Top 10%) achieve 45%+ occupancy, indicating high desirability and potentially optimized availability.
- Strong performing properties (Top 25%) maintain 36% or higher occupancy, suggesting good market fit and guest satisfaction.
- Typical properties (Median) have an occupancy rate around 24%.
- Entry-level properties (Bottom 25%) average 15% occupancy, potentially facing higher vacancy.
Average Monthly Occupancy Rate Trend in Nisporto
What Is the Average Airbnb Nightly Rate in Nisporto?
Effective short term rental pricing strategy in Nisporto involves understanding monthly ADR fluctuations. The Average Daily Rate (ADR) for Airbnb in Nisporto typically peaks in June and dips lowest during October. Leveraging Airbnb dynamic pricing tools or strategies based on this seasonality can significantly boost revenue. Here's a look at the typical nightly rates achieved:
- Best-in-class properties (Top 10%) command rates of $252+ per night, often due to premium features or locations.
- Strong performing properties (Top 25%) achieve nightly rates of $159 or more.
- Typical properties (Median) charge around $129 per night.
- Entry-level properties (Bottom 25%) earn around $105 per night.
Average Daily Rate (ADR) Trend by Month in Nisporto
What Is the RevPAR for Airbnb in Nisporto?
RevPAR in Nisporto is currently $85. Because RevPAR combines nightly rates with realized occupancy, it is one of the cleanest ways to compare how efficiently listings turn demand into revenue across the market.
- Entry-level properties (Bottom 25%) see $48 RevPAR.
- Typical properties (Median) generate $67 RevPAR.
- Strong performers (Top 25%) earn $92 RevPAR.
- Best-in-class (Top 10%) achieve $126 RevPAR.
Average Monthly RevPAR Trend in Nisporto
RevPAR Insights for Nisporto
- The average RevPAR in Nisporto is $85. This metric combines nightly rates with realized occupancy, making it one of the best single-number indicators of market efficiency.
- The gap between the top 10% ($126) and bottom 25% ($48) is $78, suggesting a relatively compressed market where operational differences yield moderate returns.
- RevPAR peaks in Aug and bottoms out in Feb, mirroring the broader seasonal demand pattern and suggesting opportunities for dynamic pricing.
Recommendations for Hosts
- Track your own RevPAR monthly against these Nisporto benchmarks. If your RevPAR falls below the median of $67, examine whether low occupancy or low ADR is the primary drag.
- Top-quartile listings achieve $92+ RevPAR through a combination of competitive pricing, strong reviews, and strategic amenities. Target this tier through incremental improvements.
- Use RevPAR rather than revenue alone when comparing properties of different sizes — it normalizes for available nights and gives a more accurate picture of performance.
Get Live Nisporto Market Intelligence 👇
Explore Real-time Analytics
When Is the Peak Season for Airbnb in Nisporto?
Nisporto's peak Airbnb season falls in August, July, June, while the softest stretch is January, February, December. Overall, the market shows highly seasonal trends requiring careful strategy, which should guide pricing, minimum stays, and cash-flow planning.
Peak Season (August, July, June)
- Revenue averages $3,274 per month
- Occupancy rates average 52.6%
- Daily rates average $226
Shoulder Season
- Revenue averages $1,072 per month
- Occupancy maintains around 21.4%
- Daily rates hold near $194
Low Season (January, February, December)
- Revenue drops to average $384 per month
- Occupancy decreases to average 10.8%
- Daily rates adjust to average $188
Seasonality Insights for Nisporto
- Airbnb seasonality in Nisporto is pronounced. Revenue swings sharply between peak and low months, which means pricing strategy, minimum-stay settings, and cash reserves all need to account for extended slower periods.
- During the high season, the absolute peak month showcases Nisporto's highest earning potential, with monthly revenues climbing to $4,219, occupancy reaching 66.0%, and ADRs peaking at $250.
- Conversely, the slowest single month marks the market's lowest point — revenue may dip to $221, occupancy could drop to 7.1%, and ADRs may adjust to $168.
- Understanding both the seasonal averages and these monthly peaks and troughs in revenue, occupancy, and ADR is crucial for maximizing your Airbnb profit potential in Nisporto.
Seasonal Strategies for Maximizing Profit
- Peak Season: Maximize revenue through premium pricing. In a high-regulation market like Nisporto, ensure your permit covers the number of nights you plan to book — some jurisdictions cap annual rental days.
- Low Season: Offer competitive pricing, extended-stay discounts, and flexible cancellation policies. Target off-season travelers like remote workers, budget-conscious guests, and travelers with flexible schedules.
- Shoulder Seasons: Implement dynamic pricing that bridges peak and low rates. Target weekend travelers, local events, and business visitors. Slightly more flexible terms than peak season can help maintain occupancy without deep discounting.
- In a highly seasonal market like Nisporto, building a cash reserve during the top months is essential for covering fixed costs during the slow period. Automated pricing tools can help capture demand shifts in real time.
Do You Need a License for Airbnb in Nisporto?
Yes, Nisporto, Tuscany, Italy enforces high STR regulations and 98% of active listings show registration evidence — indicating that enforcement is active and compliance is a prerequisite for operating legally. Hosts entering this market should budget for permit fees, inspections, and potential occupancy tax obligations as part of their startup costs. Always verify the latest short-term rental regulations and Airbnb license requirements directly with local government authorities for Nisporto to ensure full compliance before hosting.
(Source: AirROI data, 2026, based on 98% licensed listings)
What Are the Best Neighborhoods for Airbnb in Nisporto?
Nisporto is a smaller vacation rental market where a handful of neighborhoods drive most of the booking activity. Choosing the right area is especially important in boutique markets — there is less room for a mediocre location to succeed on volume alone. The areas below highlight where short-term rental demand is strongest and why.
| Neighborhood / Area | Why Host Here? (Target Guests & Appeal) | Key Attractions & Landmarks |
|---|---|---|
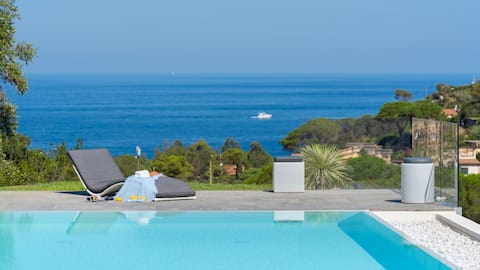
| Nisporto Beach | A beautiful and serene beach location popular for its clear waters and scenic views of the Elba Island. Ideal for visitors looking for relaxation and coastal activities such as swimming and sunbathing. | Nisporto Beach, Scuba diving, Snorkeling, Coastal hiking trails, Beachfront restaurants |
| Rio Marina | A charming port town with a rich mining history. Attracts tourists interested in local culture and maritime activities, making it a great spot for Airbnb rentals. | Rio Marina Port, Museum of Mining, Local shops and cafes, Scenic coastal walks, Historical sites |
| Porto Azzurro | A picturesque fishing village known for its colorful buildings and waterfront promenade. A hit among families and couples seeking a cozy getaway by the sea. | Porto Azzurro Beach, Santa Maria Assunta Church, Local seafood restaurants, Hiking in the surrounding hills, Boat tours |
| Capoliveri | Famous for its stunning views and vibrant nightlife, Capoliveri attracts both tourists and locals. It's an ideal spot for those looking for a lively atmosphere combined with beautiful landscapes. | Capoliveri Town Square, Local beaches, Sunset views from the hilltop, Annual festivals, Artisan shops |
| Elba Island | The island itself is the main attraction with its diverse landscapes, beaches, and outdoor activities. Investing in Airbnb here offers a wide market from beach lovers to adventure seekers. | Beaches of Elba, Diving and snorkeling sites, Hiking trails, Historical monuments, Wine tasting tours |
| Marciana Marina | Known for its charming harbor and the beautiful surrounding natural park. Perfect for those looking for outdoor adventures and a quieter atmosphere. | Marciana Marina Beach, Natural Park of the Island of Elba, Local markets and festivals, Hiking in the surrounding hills, Boat rentals |
| Procchio | A tranquil beach destination ideal for families, with shallow waters and a variety of beach amenities. Popular among tourists seeking a peaceful retreat. | Procchio Beach, Water sports activities, Family-friendly restaurants, Surrounding pine forest, Scenic bike trails |
| Campo nell'Elba | A vibrant local community with great access to both beaches and hiking trails. Offers a blend of nature and local culture, appealing to a diverse audience. | Local vineyards, Historical sites, Beaches within reach, Nature trails, Community events |
Because Nisporto has a high regulation profile, confirming that short-term rental permits are available in your target neighborhood is a critical first step before committing to a property purchase. Regulation can vary at the neighborhood or district level even within the same city.
What Types of Properties Are on Airbnb in Nisporto?
Room Type Distribution
Property Type Distribution
Market Composition Insights for Nisporto
- The Nisporto Airbnb market composition is heavily skewed towards Entire Home/Apt listings, which make up 100% of the 61 active rentals. This indicates strong guest preference for privacy and space.
- Looking at the property type distribution in Nisporto, Apartment/Condo properties are the most common (72.1%), reflecting the local real estate landscape.
- Houses represent a significant 27.9% portion, catering likely to families or larger groups.
Nisporto Airbnb Room Capacity Analysis (2026): Bedroom Distribution
Distribution of Listings by Number of Bedrooms
Room Capacity Insights for Nisporto
- The dominant room capacity in Nisporto is 1 bedroom listings, making up 47.5% of the market. This suggests a strong demand for properties suitable for couples or solo travelers.
- Together, 1 bedroom and 2 bedrooms properties represent 88.5% of the active Airbnb listings in Nisporto, indicating a high concentration in these sizes.
Nisporto Vacation Rental Guest Capacity Trends (2026)
Distribution of Listings by Guest Capacity
Guest Capacity Insights for Nisporto
- The most common guest capacity trend in Nisporto vacation rentals is listings accommodating 4 guests (39.3%). This suggests the primary traveler segment is likely small families or groups.
- Properties designed for 4 guests and 6 guests dominate the Nisporto STR market, accounting for 59.0% of listings.
- 31.1% of properties accommodate 6+ guests, serving the market segment for larger families or group travel in Nisporto.
- On average, properties in Nisporto are equipped to host 4.8 guests.
How Do Listings in Nisporto Compare on Quality?
Listing quality in Nisporto can be approximated through presentation depth, bedroom count, and how often hosts disclose exact locations. These signals show how professionally the local supply base is merchandised.
Listing Quality Insights for Nisporto
- At 27 photos per listing on average, Nisporto hosts invest well in visual presentation. Listings with 20+ photos consistently outperform in search ranking and conversion.
- 41.0% of listings show their exact location. Lower disclosure rates can increase booking hesitation — guests want to know exactly where they are staying.
Recommendations for Hosts
- Enable exact location if possible — it removes a common source of guest uncertainty and can improve your listing's position in map-based searches.
- Use these quality indicators as a self-audit checklist. Listings that exceed the Nisporto averages across all three metrics are better positioned for premium pricing.
What Amenities Do Airbnb Guests Expect in Nisporto?
Amenity Prevalence
Amenity Insights for Nisporto
- Essential amenities in Nisporto that guests expect include: TV, Refrigerator. Lacking these (any) could significantly impact bookings.
- Popular amenities like Free parking on premises, Hot water, Kitchen are common but not universal. Offering these can provide a competitive edge.
- Warning: Wifi is not universally provided but is considered essential globally. Ensure reliable Wifi is offered.
Recommendations for Hosts
- Ensure your listing includes all essential amenities for Nisporto: TV, Refrigerator.
- Prioritize adding missing essentials: TV, Refrigerator.
- Consider adding popular differentiators like Free parking on premises or Hot water to increase appeal.
- Highlight unique or less common amenities you offer (e.g., hot tub, dedicated workspace, EV charger) in your listing description and photos.
- Regularly check competitor amenities in Nisporto to stay competitive.
Which Airbnb Amenities Boost Revenue in Nisporto?
Not every amenity matters equally. This table focuses on the amenities most associated with higher revenue in Nisporto, which makes it more useful for prioritizing upgrades than a simple popularity list alone.
| Amenity | Prevalence | Revenue With | Revenue Without | Revenue Uplift |
|---|---|---|---|---|
Dishwasher | 29.5% | $16,719 | $7,818 | 113.9% |
Baking sheetHigh opportunity | 9.8% | $19,227 | $9,486 | 102.7% |
Air conditioning | 60.7% | $12,833 | $6,763 | 89.7% |
Washer | 70.5% | $12,078 | $6,542 | 84.6% |
Outdoor shower | 27.9% | $15,023 | $8,676 | 73.2% |
Barbecue utensils | 9.8% | $16,563 | $9,777 | 69.4% |
Sun loungers | 24.6% | $15,109 | $8,924 | 69.3% |
Kitchen | 83.6% | $11,187 | $6,657 | 68.1% |
Oven | 54.1% | $12,778 | $7,694 | 66.1% |
Host greets you | 21.3% | $15,202 | $9,156 | 66.0% |
Revenue Impact Insights for Nisporto
- Dishwasher tops the revenue impact list with a 113.9% uplift — listings with this amenity earn $16,719 vs. $7,818 without it.
- High-opportunity amenities — Baking sheet — combine revenue uplift above 100% with prevalence under 10%, meaning most competitors haven't adopted them yet.
- Kitchen — while widespread — still correlate with meaningful revenue gains, making it table stakes rather than true differentiators.
Recommendations for Hosts
- Prioritize adding Baking sheet — it has the best combination of high revenue impact and low market saturation in Nisporto.
- Focus your upgrade budget on amenities in the top half of this table. Below-median amenities may improve guest experience but contribute less to revenue growth.
- Highlight revenue-impacting amenities prominently in your listing title, photos, and description — guests can't value what they don't notice.
Dive Deeper: Advanced Nisporto STR Market Data (2026)
Ready to unlock more insights? AirROI provides access to advanced metrics and comprehensive Airbnb data for Nisporto. Explore detailed analytics beyond this report to refine your investment strategy, optimize pricing, and maximize your vacation rental profits.
Explore Advanced MetricsNisporto Airbnb Guest Demographics & Profile Analysis (2026)
Guest Profile Summary for Nisporto
- The typical guest profile for Airbnb in Nisporto consists of a mix of domestic (37%) and international guests, with top international origins including Germany, typically belonging to the Post-2000s (Gen Z/Alpha) group (50%), primarily speaking English or German.
- Domestic travelers account for 36.8% of guests.
- Key international markets include Italy (36.8%) and Germany (26.5%).
- Top languages spoken are English (36.6%) followed by German (19.7%).
- A significant demographic segment is the Post-2000s (Gen Z/Alpha) group, representing 50% of guests.
Recommendations for Hosts
- Focus marketing internationally, particularly towards travelers from Germany.
- Tailor amenities and listing descriptions to appeal to the dominant Post-2000s (Gen Z/Alpha) demographic (e.g., highlight fast WiFi, smart home features, local guides).
- Highlight unique local experiences or amenities relevant to the primary guest profile.
- Consider seasonal promotions aligned with peak travel times for key origin markets.
What Are Airbnb Guest Ratings in Nisporto?
Listings in Nisporto average 4.5 out of 5 overall, with about 11.3 reviews per active listing and 8.2% of listings carrying the Guest Favorite badge.
Rating Breakdown by Category
Guest Rating Insights for Nisporto
- An average rating of 4.5 places Nisporto in solid territory. Most guests leave satisfied, though there is room for hosts to push toward the top tier.
- The strongest subcategory is Check-in (4.64), while Value (4.33) trails behind — a useful signal for hosts looking to prioritize upgrades.
- 8.2% of listings carry the Guest Favorite badge, a strong trust signal that can meaningfully lift click-through and booking rates.
Recommendations for Hosts
- Focus improvement efforts on Value — even small gains in the weakest subcategory can lift overall ratings and search ranking.
- Encourage guests to leave reviews after checkout. Listings with more reviews rank higher in search results and convert browsers into bookers more effectively.
- With only 8.2% of listings earning Guest Favorite status, hosts who consistently exceed expectations have a clear competitive advantage.
Nisporto Airbnb Booking Patterns (2026): Available vs. Booked Days
Available Days Distribution
Booked Days Distribution
Booking Pattern Insights for Nisporto
- The most common availability pattern in Nisporto falls within the 271-366 days range, representing 86.9% of listings. This suggests many properties have significant open periods on their calendars.
- Approximately 100.0% of listings show high availability (181+ days open annually), indicating potential for increased bookings or specific owner usage patterns.
- For booked days, the 31-90 days range is most frequent in Nisporto (57.4%), reflecting common guest stay durations or potential owner blocking patterns.
How Far in Advance Do Guests Book Airbnb in Nisporto?
Average Booking Lead Time by Month
Booking Lead Time Insights for Nisporto
- The overall average booking lead time for vacation rentals in Nisporto is 79 days.
- Guests book furthest in advance for stays during August (average 99 days), likely coinciding with peak travel demand or local events.
- The shortest booking windows occur for stays in November (average 1 days), indicating more last-minute travel plans during this time.
- Seasonally, Summer (88 days avg.) sees the longest lead times, while Winter (8 days avg.) has the shortest, reflecting typical travel planning cycles.
Recommendations for Hosts
- Use the overall average lead time (79 days) as a baseline for your pricing and availability strategy in Nisporto.
- For August stays, consider implementing length-of-stay discounts or slightly higher rates for bookings made less than 99 days out to capitalize on advance planning.
- During November, focus on last-minute booking availability and promotions, as guests book with very short notice (1 days avg.).
- Target marketing efforts for the Summer season well in advance (at least 88 days) to capture early planners.
- Monitor your own booking lead times against these Nisporto averages to identify opportunities for dynamic pricing adjustments.
What Is the Average Length of Stay for Airbnb in Nisporto?
Guests in Nisporto stay about 7.3 nights on average, generating roughly 459 reservations and 7.5 bookings per listing in the latest AirROI dataset. The most common check-in time is 4:00 PM and check-out is 10:00 AM.
Monthly Length of Stay in Nisporto
Check-in Time Distribution
Check-out Time Distribution
Stay Pattern Insights for Nisporto
- Longer stays mean fewer turnovers and lower cleaning costs per revenue dollar. This pattern also opens the door to monthly discount strategies that attract remote workers and extended-stay travelers.
- Stay lengths peak in Aug (8.6 nights) and shorten in Feb (1.3 nights). Adjust minimum-night requirements seasonally to match.
Recommendations for Hosts
- Leverage the longer-stay pattern by offering weekly discounts — even 5-10% off can convert browsing into bookings for guests considering an extended stay.
- Set your check-in time to match or beat the market standard of 4:00 PM. Offering early check-in flexibility can be a low-cost differentiator.
- Monitor length-of-stay seasonality to adjust minimum-night requirements — longer minimums during peak periods maximize revenue while shorter minimums fill gaps in shoulder seasons.
Nisporto Airbnb Minimum Stay Requirements Analysis
Distribution of Listings by Minimum Night Requirement
1 Night
4 listings
6.6% of total
4-6 Nights
8 listings
13.1% of total
7-29 Nights
11 listings
18% of total
30+ Nights
38 listings
62.3% of total
Key Insights
- The most prevalent minimum stay requirement in Nisporto is 30+ Nights, adopted by 62.3% of listings. This highlights the market's preference for longer commitments.
- Very short stays (1-2 nights) are less common (6.6%), suggesting hosts prefer slightly longer bookings to optimize turnover.
- A significant segment (62.3%) caters to monthly stays (30+ nights) in Nisporto, pointing to opportunities in the extended-stay market.
Recommendations
- Align with the market by considering a 30+ Nights minimum stay, as 62.3% of Nisporto hosts use this setting.
- If feasible, allowing 1-night stays, especially midweek or during low season, could capture last-minute bookings, as only 6.6% currently do.
- Explore offering discounts for stays of 30+ nights to attract the 62.3% of the market seeking extended stays.
- Adjust minimum nights based on seasonality – potentially shorter during low season and longer during peak demand periods in Nisporto.
Nisporto Airbnb Cancellation Policy Trends Analysis (2026)
Super Strict 30 Days
4 listings
6.6% of total
Limited
2 listings
3.3% of total
Super Strict 60 Days
11 listings
18% of total
Flexible
7 listings
11.5% of total
Moderate
10 listings
16.4% of total
Firm
24 listings
39.3% of total
Strict
3 listings
4.9% of total
Cancellation Policy Insights for Nisporto
- The prevailing Airbnb cancellation policy trend in Nisporto is Firm, used by 39.3% of listings.
- There's a relatively balanced mix between guest-friendly (27.9%) and stricter (44.2%) policies, offering choices for different guest needs.
- Strict cancellation policies are quite rare (4.9%), potentially making listings with this policy less competitive unless justified by high demand or property type.
Recommendations for Hosts
- Consider adopting a Firm policy to align with the 39.3% market standard in Nisporto.
- Using a Strict policy might deter some guests, as only 4.9% of listings use it. Evaluate if potential revenue protection outweighs possible lower booking rates.
- Regularly review your cancellation policy against competitors and market demand shifts in Nisporto.
How Much Are Airbnb Cleaning Fees in Nisporto?
Cleaning fees in Nisporto are meaningful operating levers, not just pass-through charges. What matters most is how often hosts charge them, how high they run relative to market norms, and how large a share of gross revenue they consume.
Cleaning Fee Insights for Nisporto
- 82.0% of listings charge a cleaning fee, making it standard practice in Nisporto. Guests expect it and factor it into their booking decisions.
- The gap between the average ($242) and median ($114) cleaning fee indicates some high-end properties are pulling the average up considerably.
- Cleaning fees represent 9.5% of gross revenue on average — a modest component of the overall booking price.
Recommendations for Hosts
- Price your cleaning fee competitively against the Nisporto median of $114. Fees significantly above market norms can deter bookings, especially for shorter stays.
- Monitor competitor cleaning fees regularly. Airbnb's search algorithm factors in total price, so a well-calibrated cleaning fee can improve your listing's ranking.
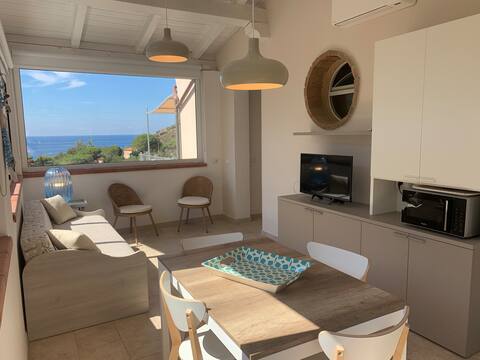
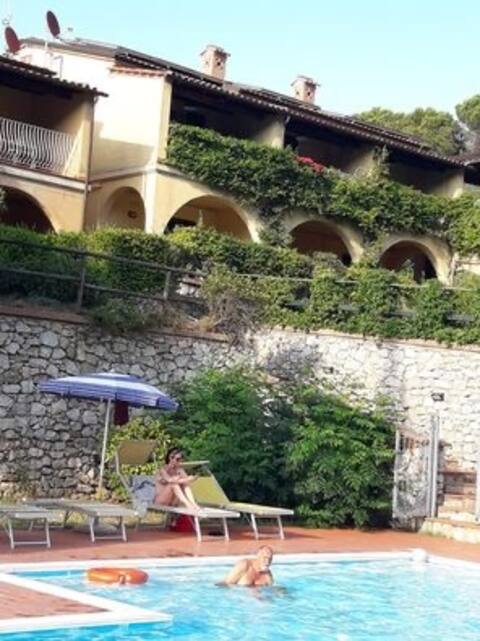
What Do the Top Airbnb Listings in Nisporto Look Like?
Benchmark your potential! Explore examples of top-performing Airbnb properties in Nisportobased on Trailing Twelve Month (TTM) revenue. Analyze their characteristics, revenue, occupancy rate, and ADR to understand what drives success in this market.
Villa Pietro 10, Emma Villas
Entire Place • 5 bedrooms
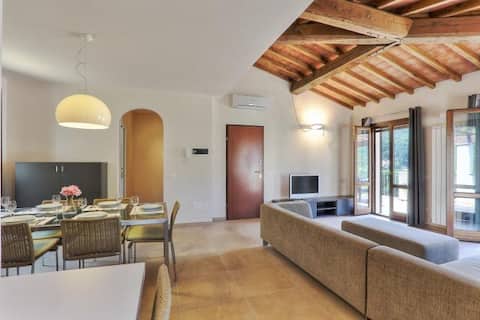
Villetta Natura House C
Entire Place • 3 bedrooms
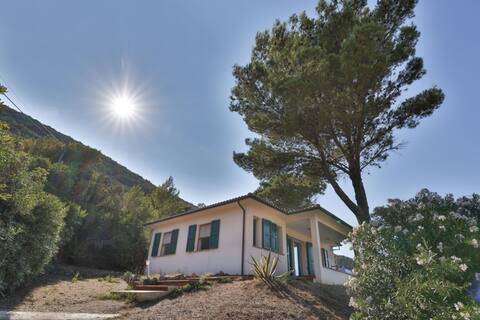
Villa Lorenzo
Entire Place • 3 bedrooms
Cota Quinta - Superior Studio
Entire Place • 1 bedroom
Nisportino apartments sea nature with view 73
Entire Place • 2 bedrooms
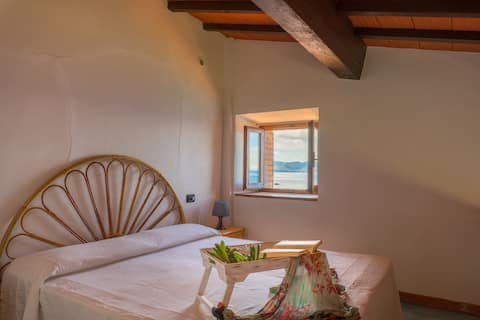
Sea apartment on Elba Island
Entire Place • 1 bedroom
Note: Performance varies based on location, size, amenities, seasonality, and management quality. Data reflects the past 12 months.
Who Are the Top Airbnb Hosts in Nisporto?
Learn from the best! This table showcases top-performing Airbnb hosts in Nisporto based on the number of properties managed and estimated total revenue over the past year. Analyze their scale and performance metrics.
| Host Name | Properties | Grossing Revenue | Stay Reviews | Avg Rating |
|---|---|---|---|---|
| Goelba | 7 | $64,873 | 22 | 3.94/5.0 |
| La Cota | 4 | $58,978 | 26 | 4.88/5.0 |
| Emma Villas Spa | 1 | $56,465 | 4 | 4.50/5.0 |
| Holidu | 2 | $55,191 | 12 | 3.61/5.0 |
| Cristiano | 4 | $49,029 | 65 | 4.91/5.0 |
| Alessandra - Interhome | 5 | $33,393 | 23 | 3.95/5.0 |
| Gloria | 3 | $32,790 | 52 | 4.65/5.0 |
| Cesare | 3 | $30,321 | 53 | 4.30/5.0 |
| Licia | 3 | $26,737 | 122 | 4.64/5.0 |
| Stefania | 2 | $26,344 | 43 | 4.77/5.0 |
Analyzing the strategies of top hosts, such as their property selection, pricing, and guest communication, can offer valuable lessons for optimizing your own Airbnb operations in Nisporto.
Who Are the Airbnb Hosts in Nisporto?
Nisporto leans more toward professional operations than casual hosting, which usually raises the competitive bar for new entrants.
Host Profile Insights for Nisporto
- Only 21.3% of hosts hold Superhost status, suggesting a relatively young or casual market where quality improvements can pay outsized dividends.
- 31.1% of listings are professionally managed, indicating a mature, competitive market with institutional players.
- 27.9% of listings have Instant Book enabled. Lower Instant Book adoption means many guests must request approval, which can slow conversions.
- 63.9% of listings use Airbnb's simplified pricing (host-only fee), where the host pays the entire platform service fee and the guest sees one all-in price with no separate Airbnb service charge. High adoption signals a professional, PMS-connected host base — Airbnb mandates simplified pricing for software-connected listings.
Recommendations for Hosts
- Earning Superhost status can significantly improve search ranking and guest trust. Focus on maintaining high response rates, low cancellations, and strong reviews.
- Consider enabling Instant Book — it reduces booking friction and Airbnb's algorithm tends to favor Instant Book listings in search results.
- Benchmark your host metrics against these Nisporto averages regularly and adjust your hosting strategy based on what top performers do differently.
Top Professional Management Companies in Nisporto
These are the highest-grossing professional property management operations in Nisporto, ranked by total revenue across their portfolio. Their performance metrics offer a benchmark for what institutional-level hosting looks like in this market.
| Company | Listings | Revenue | ADR | Occ. | Rating |
|---|---|---|---|---|---|
| Goelba | 7 | $64,873 | $140 | 49.3% | 3.94/5 |
| Emma Villas Spa | 1 | $56,465 | $1,099 | 31.6% | 4.50/5 |
| Alessandra - Interhome | 5 | $33,393 | $138 | 32.7% | 3.95/5 |
| Silvia | 1 | $17,890 | $440 | 22.3% | N/A |
| Ibookingelba.Com Di ARGONAUTIV | 2 | $12,368 | $118 | 39.3% | N/A |
| Sabine - Interhome | 4 | $9,597 | $103 | 21.5% | 4.29/5 |
| I.C. Immobiliare | 1 | $9,374 | $108 | 46.0% | N/A |
| Novasol | 1 | $4,883 | $70 | 11.6% | 4.25/5 |
| Renata | 1 | $4,802 | $171 | 21.6% | 4.83/5 |
Management Company Insights for Nisporto
- The leading management company, Goelba, operates 7 listings with $64,873 in gross revenue — a useful benchmark for what scale looks like in Nisporto.
- Top managers average 3 properties each, suggesting professional management in Nisporto still operates at a relatively boutique scale.
- Professionally managed listings in the top tier average 4.29/5 in guest ratings — suggesting room for quality improvement even among larger operators.
Recommendations
- Study how top management companies price, position, and maintain their portfolios — their ADR and occupancy rates reflect strategies refined across dozens of listings.
- If you're considering hiring a property manager, compare their portfolio performance against these benchmarks before committing.
How Does Nisporto's Airbnb Market Compare to Nearby Cities?
How does the Nisporto Airbnb market stack up against its neighbors? Compare key performance metrics like average monthly revenue, ADR, and occupancy rates in surrounding areas to understand the broader regional STR landscape.
Compared with Poltu Quatu, Nisporto has 6 percentage points lower occupancy and about $124 lower ADR. That helps frame whether this market is winning more on demand, pricing, or both.
| Market | Active Properties | Monthly Revenue | Daily Rate | Avg. Occupancy |
|---|---|---|---|---|
| Tignano | 12 | $3,801 | $425.03 | 44% |
| Marciano della Chiana | 17 | $3,318 | $553.48 | 30% |
| Porto Cervo | 180 | $3,107 | $595.56 | 40% |
| Castelfranco di Sotto | 51 | $3,022 | $359.83 | 35% |
| Buonconvento | 64 | $2,877 | $429.28 | 41% |
| Crespina | 14 | $2,610 | $444.91 | 40% |
| Poltu Quatu | 47 | $2,569 | $334.68 | 46% |
| Gaiole in Chianti | 220 | $2,564 | $390.64 | 35% |
| Florence | 10,974 | $2,563 | $234.20 | 46% |
| Monte San Savino | 96 | $2,537 | $406.38 | 36% |
Frequently Asked Questions About Airbnb in Nisporto
These quick answers summarize the most common investor and operator questions using AirROI's latest market data for Nisporto.
How much do Airbnb hosts make in Nisporto?
Nisporto hosts earn about $10,445 per year on average, with an average nightly rate of $210 and RevPAR of $85. Those figures describe the typical revenue environment for active listings in Nisporto, Tuscany, not the ceiling for the best operators. Source: AirROI 2026 data, Nisporto market, July 2025 to June 2026.
What is the average Airbnb occupancy rate in Nisporto?
The average Airbnb occupancy rate in Nisporto is 40.3%. August is the strongest month and February is the softest, so hosts should expect demand to move meaningfully throughout the year rather than stay flat.
What is the average Airbnb daily rate in Nisporto?
Listings in Nisporto average $210 per night. The broader pricing spread also matters: lower-performing listings cluster closer to the lower quartiles, while premium homes can price materially above the city average when demand spikes or listing quality stands out.
How many Airbnb listings are active in Nisporto?
Nisporto currently has about 61 active Airbnb listings in AirROI's market dataset. That supply count helps explain how competitive the market is, how much depth there is for benchmarking, and whether the market behaves like a niche destination or a scaled urban market.
How strict are short-term rental regulations in Nisporto?
AirROI currently classifies the short-term rental regulation level in Nisporto as High. The dataset also shows about 98.4% of listings with registration evidence. That is a market signal, not legal advice, so hosts should still confirm current licensing and compliance rules locally before listing.
What is the RevPAR for Airbnb in Nisporto?
RevPAR in Nisporto is about $85. That metric combines pricing and occupancy into one efficiency number, so it is often a better quick benchmark than ADR alone when investors want to compare how well listings convert nightly rates into realized revenue.
Is Airbnb profitable in Nisporto?
At 40.3% occupancy, Nisporto can be profitable — but margins depend heavily on operating costs, property acquisition price, and how well hosts optimize pricing across seasons. Average annual revenue is $10,445, but individual returns depend on property type, location within the city, and the host's operating efficiency.
How far in advance do guests book Airbnb in Nisporto?
The average booking lead time in Nisporto is about 79 days — a longer planning horizon typical of destination or vacation markets where travelers book well in advance. Hosts who understand their market's booking cadence can adjust minimum stays and pricing windows accordingly.
What are the best neighborhoods for Airbnb in Nisporto?
Based on AirROI's analysis, some of the top neighborhoods for short-term rentals in Nisporto include Nisporto Beach, Rio Marina, Porto Azzurro. Each area attracts different guest profiles — from business travelers to leisure visitors — so the best location depends on the property type and target audience a host is aiming for. See the full neighborhood breakdown above.
What type of property performs best on Airbnb in Nisporto?
entire_home listings make up 100.0% of the active supply in Nisporto. The most common configuration does not always mean the most profitable — operators who identify underserved property types or bedroom counts can sometimes outperform the market average by filling a gap in local supply.
How does Nisporto compare to nearby Airbnb markets?
Among neighboring markets, Tignano posts $45,607 in average annual revenue with 43.8% occupancy, compared to Nisporto's $10,445 and 40.3%. Comparing nearby markets helps investors understand whether a destination's performance reflects local demand or broader regional trends.
What is the average length of stay in Nisporto?
The average Airbnb stay length in Nisporto is about 7.3 nights. That matters for turnover, cleaning operations, and pricing strategy because shorter stays increase changeovers while longer stays can smooth occupancy and reduce operational friction.
What is the average Airbnb guest rating in Nisporto?
Airbnb listings in Nisporto average 4.5 out of 5 overall. About 8.2% of listings carry the guest favorite badge, which suggests a meaningful share of inventory is competing on review quality rather than price alone.
Which amenities boost Airbnb revenue in Nisporto?
Dishwasher and Baking sheet are among the strongest revenue-linked amenities in Nisporto. In AirROI's latest dataset, listings with these amenities outperform those without on average revenue, which makes amenities analysis useful for prioritizing investment and listing upgrades.
Do Airbnb hosts charge cleaning fees in Nisporto?
Yes. About 82.0% of active Airbnb listings in Nisporto charge a cleaning fee, and the average fee is $242. The more important operating benchmark is how much of gross revenue that fee consumes, not just the absolute dollar amount.
What percentage of Airbnb hosts are Superhosts in Nisporto?
At 21.3%, there is a healthy mix of experienced and newer hosts — earning Superhost status can still provide a meaningful visibility boost.
About AirROI Market Data
AirROI tracks over 20 million properties across 190+ countries and maintains 15+ years of historical performance data, making it one of the deepest Airbnb and STR intelligence platforms available. The analytics pipeline aggregates listing-level data monthly — revenue, occupancy, nightly rates, RevPAR, guest demographics, booking patterns, and competitive supply — so investors and operators can benchmark any market against its own history and against neighboring destinations.
Real estate investors, property managers, financial institutions, hedge funds, tourism boards, hospitality consultants, tech platforms, and academic researchers rely on AirROI data to underwrite acquisitions, optimize pricing, model macro trends, and conduct peer-reviewed research. Data is available through in-depth market reports like this one and the Airbnb API with 22 endpoints and an Airbnb MCP Server for AI agents.
AirROI proprietary analytics as of 2026-06-30. Metrics reflect trailing twelve-month aggregates from active listings. Revenue figures are market averages, not projections. Neighborhood descriptions are AI-generated and reviewed for accuracy. For full methodology, see the data methodology page.