Montego Bay, St. James Parish Airbnb Market Data 2025: STR Report & Statistics
How much can you earn on Airbnb in Montego Bay, St. James Parish? Based on AirROI's 2025 dataset (July 2024 – June 2025), the short answer is $34,719 per year — at a $322 nightly rate, 39.5% occupancy, and a N/A RevPAR.
Montego Bay's 208 active listings and moderate demand with room for well-positioned listings to outperform position it as a midsize vacation rental market. Supply grew 38.7% year over year, and the market is recalibrating around a new competitive baseline. This is the stage where hosts who invest in amenities, guest experience, and dynamic pricing build durable advantages that compound as the market matures.
Regulation is low with minimal registration requirements, pointing to an operator-friendly environment. In a tightening market, selectivity matters — focus on proven neighborhoods, competitive pricing, and guest experience to protect returns.

Table of Contents [hide] [show]
What Are the Key Airbnb Metrics in Montego Bay?
In Montego Bay, the headline Airbnb metrics are $34,719 in average annual revenue,39.5% occupancy, $322 ADR, and $0 in RevPAR, and guests book about 37 days in advance.
How Much Do Airbnb Hosts Earn Monthly in Montego Bay?
Understanding the monthly revenue variations for Airbnb listings in Montego Bay is key to maximizing your short term rental income potential. Seasonality significantly impacts earnings. Our analysis, based on data from the past 12 months, shows that the peak revenue month for STRs in Montego Bay is typically March, while September often presents the lowest earnings, highlighting opportunities for strategic pricing adjustments during shoulder and low seasons. Explore the typical Airbnb income in Montego Bay across different performance tiers:
- Best-in-class properties (Top 10%) achieve $8,815+ monthly, often utilizing dynamic pricing and superior guest experiences.
- Strong performing properties (Top 25%) earn $4,245 or more, indicating effective management and desirable locations/amenities.
- Typical properties (Median) generate around $2,007 per month, representing the average market performance.
- Entry-level properties (Bottom 25%) see earnings around $923, often with potential for optimization.
Average Monthly Airbnb Earnings Trend in Montego Bay
What Is the Monthly Airbnb Occupancy Rate in Montego Bay?
Maximize your bookings by understanding the Montego Bay STR occupancy trends. Seasonal demand shifts significantly influence how often properties are booked. Typically, Marchsees the highest demand (peak season occupancy), while September experiences the lowest (low season). Effective strategies, like adjusting minimum stays or offering promotions, can boost occupancy during slower periods. Here's how different property tiers perform in Montego Bay:
- Best-in-class properties (Top 10%) achieve 76%+ occupancy, indicating high desirability and potentially optimized availability.
- Strong performing properties (Top 25%) maintain 61% or higher occupancy, suggesting good market fit and guest satisfaction.
- Typical properties (Median) have an occupancy rate around 40%.
- Entry-level properties (Bottom 25%) average 22% occupancy, potentially facing higher vacancy.
Average Monthly Occupancy Rate Trend in Montego Bay
What Is the Average Airbnb Nightly Rate in Montego Bay?
Effective short term rental pricing strategy in Montego Bay involves understanding monthly ADR fluctuations. The Average Daily Rate (ADR) for Airbnb in Montego Bay typically peaks in February and dips lowest during April. Leveraging Airbnb dynamic pricing tools or strategies based on this seasonality can significantly boost revenue. Here's a look at the typical nightly rates achieved:
- Best-in-class properties (Top 10%) command rates of $735+ per night, often due to premium features or locations.
- Strong performing properties (Top 25%) achieve nightly rates of $271 or more.
- Typical properties (Median) charge around $157 per night.
- Entry-level properties (Bottom 25%) earn around $88 per night.
Average Daily Rate (ADR) Trend by Month in Montego Bay
What Is the RevPAR for Airbnb in Montego Bay?
RevPAR in Montego Bay is currently N/A. Because RevPAR combines nightly rates with realized occupancy, it is one of the cleanest ways to compare how efficiently listings turn demand into revenue across the market.
- Entry-level properties (Bottom 25%) see N/A RevPAR.
- Typical properties (Median) generate N/A RevPAR.
- Strong performers (Top 25%) earn N/A RevPAR.
- Best-in-class (Top 10%) achieve N/A RevPAR.
Average Monthly RevPAR Trend in Montego Bay
RevPAR Insights for Montego Bay
- RevPAR peaks in Jan and bottoms out in Jan, mirroring the broader seasonal demand pattern and suggesting opportunities for dynamic pricing.
Recommendations for Hosts
- Track your own RevPAR monthly against these Montego Bay benchmarks. If your RevPAR falls below the median of N/A, examine whether low occupancy or low ADR is the primary drag.
- Use RevPAR rather than revenue alone when comparing properties of different sizes — it normalizes for available nights and gives a more accurate picture of performance.
Get Live Montego Bay Market Intelligence 👇
Explore Real-time Analytics
When Is the Peak Season for Airbnb in Montego Bay?
Montego Bay's peak Airbnb season falls in March, February, January, while the softest stretch is June, September, November. Overall, the market shows moderate seasonality with distinct peak and low periods, which should guide pricing, minimum stays, and cash-flow planning.
Peak Season (March, February, January)
- Revenue averages $4,956 per month
- Occupancy rates average 47.2%
- Daily rates average $312
Shoulder Season
- Revenue averages $3,939 per month
- Occupancy maintains around 43.2%
- Daily rates hold near $302
Low Season (June, September, November)
- Revenue drops to average $3,103 per month
- Occupancy decreases to average 35.1%
- Daily rates adjust to average $298
Seasonality Insights for Montego Bay
- The Airbnb seasonality pattern in Montego Bay shows moderate seasonality with distinct peak and low periods. While the sections above show seasonal averages, it is also insightful to look at the extremes:
- During the high season, the absolute peak month showcases Montego Bay's highest earning potential, with monthly revenues climbing to $5,275, occupancy reaching 49.2%, and ADRs peaking at $326.
- Conversely, the slowest single month marks the market's lowest point — revenue may dip to $2,785, occupancy could drop to 31.3%, and ADRs may adjust to $285.
- Lower occupancy paired with meaningful seasonality means hosts in Montego Bay need to maximize every peak-season booking and seriously consider whether off-season pricing adjustments or minimum-stay changes can capture incremental revenue.
Seasonal Strategies for Maximizing Profit
- Peak Season: Maximize revenue through premium pricing and potentially longer minimum stays. Ensure high availability and consider tightening cancellation policies to reduce last-minute gaps.
- Low Season: Offer competitive pricing, extended-stay discounts, and flexible cancellation policies. Target off-season travelers like remote workers, budget-conscious guests, and travelers with flexible schedules.
- Shoulder Seasons: Implement dynamic pricing that bridges peak and low rates. Target weekend travelers, local events, and business visitors. Slightly more flexible terms than peak season can help maintain occupancy without deep discounting.
- Regularly analyze your own performance against these Montego Bay seasonality benchmarks and adjust your pricing and availability strategy accordingly.
Do You Need a License for Airbnb in Montego Bay?
Low regulation and minimal registration activity in Montego Bay, St. James Parish, Jamaica point to an operator-friendly environment. That said, even low-regulation markets may have tax collection requirements, safety standards, or HOA rules that affect short-term rental operations. Always verify the latest short-term rental regulations and Airbnb license requirements directly with local government authorities for Montego Bay to ensure full compliance before hosting.
(Source: AirROI data, 2026, based on 1% licensed listings)
What Are the Best Neighborhoods for Airbnb in Montego Bay?
Location within Montego Bay matters. Even in a midsize market, the difference between neighborhoods can mean a material gap in occupancy, nightly rate, and overall Airbnb revenue. Below are 8 areas where short-term rental activity and guest interest are concentrated — along with the reasons each neighborhood appeals to travelers.
| Neighborhood / Area | Why Host Here? (Target Guests & Appeal) | Key Attractions & Landmarks |
|---|---|---|
| Doctor's Cave Beach | Famous for its crystal-clear waters and powdery white sand, Doctor's Cave Beach is a top destination for tourists looking to relax and enjoy water activities. The beach is also close to local restaurants and attractions. | Doctor's Cave Beach, Aquasol Theme Park, Coral Cliff Entertainment Resort, Margaritaville, Montego Bay Marine Park |
| Hip Strip (Gloucester Avenue) | The lively Hip Strip is known for its vibrant atmosphere, bars, shops, and restaurants. It is a popular area for tourists to enjoy nightlife and local cuisine. | Rockland Bird Sanctuary, Harbor Street Craft Market, Royal Decameron Beach, Reggae Beach, Local street food vendors |
| Rose Hall | Home to the famous Rose Hall Great House and a number of luxury resorts, Rose Hall is a premium area attracting visitors looking for a luxurious stay and historical tours. | Rose Hall Great House, White Witch Golf Course, Half Moon Golf Course, Irie Blue Hole, Jamaica's North Coast beaches |
| Sandwich Point | A quieter area with beautiful beaches and resorts, ideal for families and those seeking a peaceful vacation experience while still being close to popular attractions. | Jamaica Zipline Adventure Tours, Secrets Wild Orchid Montego Bay, The Shore Restaurant & Bar, Sunset Beach Resort, Aquasol Beach Park |
| Montego Bay Marine Park | A protected marine area that offers excellent snorkeling and diving opportunities. This attracts eco-tourists and adventure lovers looking to explore underwater life. | Snorkeling tours, Diving excursions, Boat rides, Flamingo Beach, Coral reefs |
| Ironshore | A residential district that offers close proximity to the airport and several beaches and resorts, catering to both travelers and those seeking longer stays. | Blue Diamond Resort, Sunset Beach Resort, SuperClubs Breezes, Beach at Ironshore, Shopping at Whitter Village |
| Trelawny | Just outside Montego Bay, Trelawny boasts beautiful beaches and rich culture, providing an opportunity for a more authentic Jamaican experience. | Falmouth Historic District, Coral Springs Waterpark, Luminous Lagoon, Glistening Waters, Williamsfield Beach |
| Lucea | An emerging area that offers access to off-the-beaten-path beaches and cultural experiences, Lucea attracts tourists looking for a unique adventure. | Dolphin Cove, Half Moon Beach, Rastasafari, Lucea Old Harbor, Local markets and eateries |
With 8 distinct neighborhoods showing meaningful short-term rental activity, Montego Bay offers diversification within a single market. Investors can tailor their strategy — from high-turnover tourist zones to quieter residential areas that attract longer stays and remote workers.
What Types of Properties Are on Airbnb in Montego Bay?
Room Type Distribution
Property Type Distribution
Market Composition Insights for Montego Bay
- The Montego Bay Airbnb market composition is heavily skewed towards Entire Home/Apt listings, which make up 93.8% of the 208 active rentals. This indicates strong guest preference for privacy and space.
- Looking at the property type distribution in Montego Bay, Apartment/Condo properties are the most common (58.2%), reflecting the local real estate landscape.
- Houses represent a significant 38.5% portion, catering likely to families or larger groups.
- Smaller segments like others, hotel/boutique (combined 3.3%) offer potential for unique stay experiences.
Montego Bay Airbnb Room Capacity Analysis (2026): Bedroom Distribution
Distribution of Listings by Number of Bedrooms
Room Capacity Insights for Montego Bay
- The dominant room capacity in Montego Bay is 1 bedroom listings, making up 38.9% of the market. This suggests a strong demand for properties suitable for couples or solo travelers.
- Together, 1 bedroom and 2 bedrooms properties represent 63.9% of the active Airbnb listings in Montego Bay, indicating a high concentration in these sizes.
- A significant 30.8% of listings offer 3+ bedrooms, catering to larger groups and families seeking more space in Montego Bay.
Montego Bay Vacation Rental Guest Capacity Trends (2026)
Distribution of Listings by Guest Capacity
Guest Capacity Insights for Montego Bay
- The most common guest capacity trend in Montego Bay vacation rentals is listings accommodating 2 guests (26.9%). This suggests the primary traveler segment is likely couples or solo travelers.
- Properties designed for 2 guests and 8+ guests dominate the Montego Bay STR market, accounting for 48.1% of listings.
- 38.5% of properties accommodate 6+ guests, serving the market segment for larger families or group travel in Montego Bay.
- On average, properties in Montego Bay are equipped to host 4.4 guests.
What Amenities Do Airbnb Guests Expect in Montego Bay?
Amenity data is currently unavailable for Montego Bay.
Dive Deeper: Advanced Montego Bay STR Market Data (2026)
Ready to unlock more insights? AirROI provides access to advanced metrics and comprehensive Airbnb data for Montego Bay. Explore detailed analytics beyond this report to refine your investment strategy, optimize pricing, and maximize your vacation rental profits.
Explore Advanced MetricsMontego Bay Airbnb Guest Demographics & Profile Analysis (2026)
Guest Profile Summary for Montego Bay
- The typical guest profile for Airbnb in Montego Bay consists of predominantly international visitors (91%), with top international origins including Jamaica, typically belonging to the Post-2000s (Gen Z/Alpha) group (50%), primarily speaking English or Spanish.
- Domestic travelers account for 9.0% of guests.
- Key international markets include United States (71%) and Jamaica (9%).
- Top languages spoken are English (78.3%) followed by Spanish (9%).
- A significant demographic segment is the Post-2000s (Gen Z/Alpha) group, representing 50% of guests.
Recommendations for Hosts
- Focus marketing internationally, particularly towards travelers from Jamaica.
- Tailor amenities and listing descriptions to appeal to the dominant Post-2000s (Gen Z/Alpha) demographic (e.g., highlight fast WiFi, smart home features, local guides).
- Highlight unique local experiences or amenities relevant to the primary guest profile.
- Consider seasonal promotions aligned with peak travel times for key origin markets.
Montego Bay Airbnb Booking Patterns (2026): Available vs. Booked Days
Available Days Distribution
Booked Days Distribution
Booking Pattern Insights for Montego Bay
- The most common availability pattern in Montego Bay falls within the 271-366 days range, representing 45.2% of listings. This suggests many properties have significant open periods on their calendars.
- Approximately 83.2% of listings show high availability (181+ days open annually), indicating potential for increased bookings or specific owner usage patterns.
- For booked days, the 91-180 days range is most frequent in Montego Bay (41.8%), reflecting common guest stay durations or potential owner blocking patterns.
- A notable 17.8% of properties secure long booking periods (181+ days booked per year), highlighting successful long-term rental strategies or significant owner usage.
How Far in Advance Do Guests Book Airbnb in Montego Bay?
Average Booking Lead Time by Month
Booking Lead Time Insights for Montego Bay
- The overall average booking lead time for vacation rentals in Montego Bay is 37 days.
- Guests book furthest in advance for stays during June (average 48 days), likely coinciding with peak travel demand or local events.
- The shortest booking windows occur for stays in September (average 28 days), indicating more last-minute travel plans during this time.
- Seasonally, Winter (39 days avg.) sees the longest lead times, while Fall (34 days avg.) has the shortest, reflecting typical travel planning cycles.
Recommendations for Hosts
- Use the overall average lead time (37 days) as a baseline for your pricing and availability strategy in Montego Bay.
- For June stays, consider implementing length-of-stay discounts or slightly higher rates for bookings made less than 48 days out to capitalize on advance planning.
- Target marketing efforts for the Winter season well in advance (at least 39 days) to capture early planners.
- Monitor your own booking lead times against these Montego Bay averages to identify opportunities for dynamic pricing adjustments.
Montego Bay Airbnb Minimum Stay Requirements Analysis
Distribution of Listings by Minimum Night Requirement
1 Night
69 listings
34.8% of total
2 Nights
47 listings
23.7% of total
3 Nights
29 listings
14.6% of total
4-6 Nights
8 listings
4% of total
7-29 Nights
1 listings
0.5% of total
30+ Nights
44 listings
22.2% of total
Key Insights
- The most prevalent minimum stay requirement in Montego Bay is 1 Night, adopted by 34.8% of listings. This highlights the market's preference for shorter, flexible bookings.
- A significant segment (22.2%) caters to monthly stays (30+ nights) in Montego Bay, pointing to opportunities in the extended-stay market.
Recommendations
- Align with the market by considering a 1 Night minimum stay, as 34.8% of Montego Bay hosts use this setting.
- Explore offering discounts for stays of 30+ nights to attract the 22.2% of the market seeking extended stays.
- Adjust minimum nights based on seasonality – potentially shorter during low season and longer during peak demand periods in Montego Bay.
Montego Bay Airbnb Cancellation Policy Trends Analysis (2026)
Super Strict 60 Days
3 listings
1.5% of total
Super Strict 30 Days
11 listings
5.4% of total
Flexible
72 listings
35.3% of total
Moderate
46 listings
22.5% of total
Firm
42 listings
20.6% of total
Strict
30 listings
14.7% of total
Cancellation Policy Insights for Montego Bay
- The prevailing Airbnb cancellation policy trend in Montego Bay is Flexible, used by 35.3% of listings.
- There's a relatively balanced mix between guest-friendly (57.8%) and stricter (35.3%) policies, offering choices for different guest needs.
Recommendations for Hosts
- Consider adopting a Flexible policy to align with the 35.3% market standard in Montego Bay.
- Using a Strict policy might deter some guests, as only 14.7% of listings use it. Evaluate if potential revenue protection outweighs possible lower booking rates.
- Regularly review your cancellation policy against competitors and market demand shifts in Montego Bay.
What Do the Top Airbnb Listings in Montego Bay Look Like?
Benchmark your potential! Explore examples of top-performing Airbnb properties in Montego Baybased on Trailing Twelve Month (TTM) revenue. Analyze their characteristics, revenue, occupancy rate, and ADR to understand what drives success in this market.
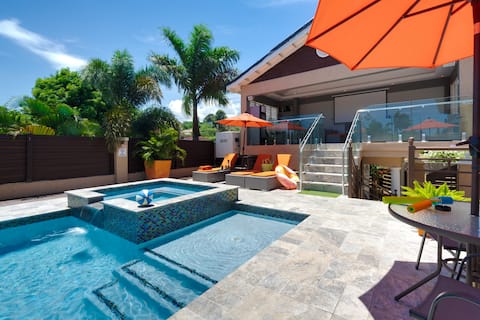
8BR Villa | Pool, Butler, Movie Nights & Free Meal
Entire Place • 8 bedrooms
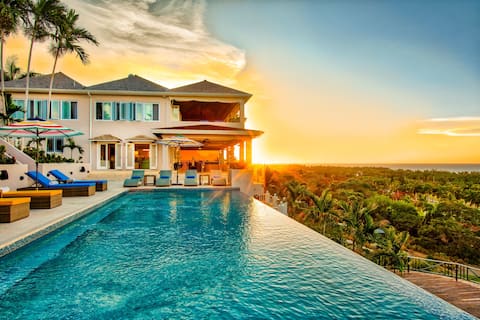
Lux 5bdr Resort Villa Beach Golf Chef Views
Entire Place • 5 bedrooms
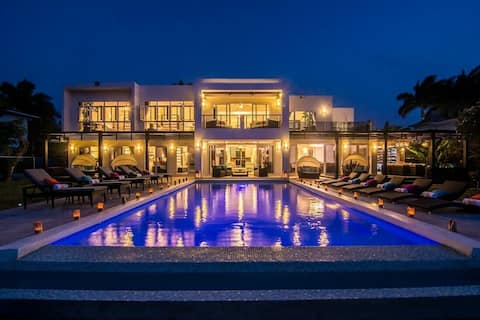
Dreamtime 7-Beach, Butler, Chef, Driver, Modern
Entire Place • 7 bedrooms

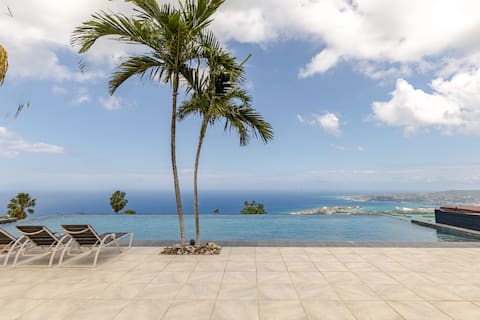
5 Brm Elegant Oceanview Villa, Private pool, Chef
Entire Place • 5 bedrooms
Exclusive 3 King & Queen Mansion
Entire Place • 7 bedrooms
Hospitality Expert EDEN: View, Pool, Beach & Chef
Entire Place • 5 bedrooms
Note: Performance varies based on location, size, amenities, seasonality, and management quality. Data reflects the past 12 months.
Who Are the Top Airbnb Hosts in Montego Bay?
Learn from the best! This table showcases top-performing Airbnb hosts in Montego Bay based on the number of properties managed and estimated total revenue over the past year. Analyze their scale and performance metrics.
| Host Name | Properties | Grossing Revenue | Stay Reviews | Avg Rating |
|---|---|---|---|---|
| Hospitality Expert | 10 | $680,804 | 2350 | 4.70/5.0 |
| Julie | 2 | $577,879 | 15 | 5.00/5.0 |
| Lisa | 2 | $496,953 | 5 | 5.00/5.0 |
| Aurora Suites | 1 | $425,782 | 79 | 4.95/5.0 |
| Deya-So Vacation Services By D | 8 | $250,637 | 192 | 4.88/5.0 |
| Kemar | 1 | $199,855 | 7 | 5.00/5.0 |
| Nicola | 2 | $187,873 | 88 | 4.78/5.0 |
| Ms Dee | 1 | $171,424 | 22 | 4.77/5.0 |
| Sherie & I Heart Travel Jamaic | 1 | $154,116 | 140 | 4.84/5.0 |
| Charmaine | 1 | $149,360 | 6 | 5.00/5.0 |
Analyzing the strategies of top hosts, such as their property selection, pricing, and guest communication, can offer valuable lessons for optimizing your own Airbnb operations in Montego Bay.
How Does Montego Bay's Airbnb Market Compare to Nearby Cities?
How does the Montego Bay Airbnb market stack up against its neighbors? Compare key performance metrics like average monthly revenue, ADR, and occupancy rates in surrounding areas to understand the broader regional STR landscape.
Compared with Barrett Town, Montego Bay has 13 percentage points lower occupancy and about $36 higher ADR. That helps frame whether this market is winning more on demand, pricing, or both.
| Market | Active Properties | Monthly Revenue | Daily Rate | Avg. Occupancy |
|---|---|---|---|---|
| Duncans | 25 | $4,115 | $596.91 | 34% |
| Ocho Rios | 17 | $3,636 | $411.23 | 32% |
| Barrett Town | 12 | $3,600 | $286.27 | 53% |
| West Bay | 32 | $3,501 | $381.06 | 43% |
| Mount Zion | 34 | $3,298 | $384.47 | 36% |
| Unity Hall | 31 | $3,044 | $355.28 | 29% |
| Davis Cove | 17 | $2,698 | $290.19 | 36% |
| Bruces Hill | 18 | $2,527 | $598.11 | 25% |
| Drapers | 39 | $2,250 | $417.41 | 32% |
| St. James Parish | 70 | $2,247 | $332.05 | 34% |
Frequently Asked Questions About Airbnb in Montego Bay
These quick answers summarize the most common investor and operator questions using AirROI's latest market data for Montego Bay.
How much do Airbnb hosts make in Montego Bay?
Montego Bay hosts earn about $34,719 per year on average, with an average nightly rate of $322 and RevPAR of N/A. Those figures describe the typical revenue environment for active listings in Montego Bay, St. James Parish, not the ceiling for the best operators. Source: AirROI 2025 data, Montego Bay market, July 2024 to June 2025.
What is the average Airbnb occupancy rate in Montego Bay?
The average Airbnb occupancy rate in Montego Bay is 39.5%. March is the strongest month and September is the softest, so hosts should expect demand to move meaningfully throughout the year rather than stay flat.
What is the average Airbnb daily rate in Montego Bay?
Listings in Montego Bay average $322 per night. The broader pricing spread also matters: lower-performing listings cluster closer to the lower quartiles, while premium homes can price materially above the city average when demand spikes or listing quality stands out.
How many Airbnb listings are active in Montego Bay?
Montego Bay currently has about 208 active Airbnb listings in AirROI's market dataset. That supply count helps explain how competitive the market is, how much depth there is for benchmarking, and whether the market behaves like a niche destination or a scaled urban market.
How strict are short-term rental regulations in Montego Bay?
AirROI currently classifies the short-term rental regulation level in Montego Bay as Low. The dataset also shows about 1.0% of listings with registration evidence. That is a market signal, not legal advice, so hosts should still confirm current licensing and compliance rules locally before listing.
What is the RevPAR for Airbnb in Montego Bay?
RevPAR in Montego Bay is about N/A. That metric combines pricing and occupancy into one efficiency number, so it is often a better quick benchmark than ADR alone when investors want to compare how well listings convert nightly rates into realized revenue.
Is Airbnb profitable in Montego Bay?
Occupancy of 39.5% means Montego Bay is a more selective market. Profitability is achievable but requires careful cost management, premium positioning, or targeting longer stays to reduce turnover. Average annual revenue is $34,719, but individual returns depend on property type, location within the city, and the host's operating efficiency.
How far in advance do guests book Airbnb in Montego Bay?
The average booking lead time in Montego Bay is about 37 days — a moderate lead time that gives hosts planning visibility while still benefiting from last-minute bookings. Hosts who understand their market's booking cadence can adjust minimum stays and pricing windows accordingly.
What are the best neighborhoods for Airbnb in Montego Bay?
Based on AirROI's analysis, some of the top neighborhoods for short-term rentals in Montego Bay include Doctor's Cave Beach, Hip Strip (Gloucester Avenue), Rose Hall. Each area attracts different guest profiles — from business travelers to leisure visitors — so the best location depends on the property type and target audience a host is aiming for. See the full neighborhood breakdown above.
What type of property performs best on Airbnb in Montego Bay?
entire_home listings make up 93.8% of the active supply in Montego Bay. The most common configuration does not always mean the most profitable — operators who identify underserved property types or bedroom counts can sometimes outperform the market average by filling a gap in local supply.
How does Montego Bay compare to nearby Airbnb markets?
Among neighboring markets, Duncans posts $49,380 in average annual revenue with 34.2% occupancy, compared to Montego Bay's $34,719 and 39.5%. Comparing nearby markets helps investors understand whether a destination's performance reflects local demand or broader regional trends.
When is the peak season for Airbnb in Montego Bay?
March is the highest-revenue month in Montego Bay, while September is the softest. The revenue spread between them indicates moderate seasonality with a clear peak period, giving hosts opportunities to maximize rates during high demand without facing dramatic off-season drops.
About AirROI Market Data
AirROI tracks over 20 million properties across 190+ countries and maintains 15+ years of historical performance data, making it one of the deepest Airbnb and STR intelligence platforms available. The analytics pipeline aggregates listing-level data monthly — revenue, occupancy, nightly rates, RevPAR, guest demographics, booking patterns, and competitive supply — so investors and operators can benchmark any market against its own history and against neighboring destinations.
Real estate investors, property managers, financial institutions, hedge funds, tourism boards, hospitality consultants, tech platforms, and academic researchers rely on AirROI data to underwrite acquisitions, optimize pricing, model macro trends, and conduct peer-reviewed research. Data is available through in-depth market reports like this one and the Airbnb API with 22 endpoints and an Airbnb MCP Server for AI agents.
AirROI proprietary analytics as of 2025-06-30. Metrics reflect trailing twelve-month aggregates from active listings. Revenue figures are market averages, not projections. Neighborhood descriptions are AI-generated and reviewed for accuracy. For full methodology, see the data methodology page.