
STR Demand Is Outpacing Hotels in 2026: AirROI Data Across 10 Markets Shows Where the Shift Hits Hardest
Short-term rental demand is outpacing hotels in 2026, and the numbers are not subtle. US hotel RevPAR fell 0.3% in 2025 -- the first non-recessionary decline ever recorded in the American hotel industry -- while STR demand rose 4.9% year-over-year. According to Reed Smith's analysis of the accommodation landscape, "the entire market gain accrued to the STR segment." More than half of consumers now compare vacation rental and hotel options before booking, and AirROI data across 10 major US markets reveals exactly where this structural shift is creating the widest gap between STR and hotel performance.
This is not a story about STR oversaturation. It is a story about hotels losing ground.
The Accommodation Market Just Tilted -- And Most Hosts Missed It
Hotel RevPAR -- the industry's benchmark metric combining pricing and occupancy -- fell 0.3% in 2025 to $100.02, according to CoStar. Annual occupancy slid 1.2 percentage points to 62.3%. ADR rose a modest 0.9% to $160.54, but the pricing gain was not enough to offset declining demand.
"Hotel demand has turned negative -- historically this only occurs during major recessions or crises." -- Reed Smith LLP, "Checking In: Key Trends Reshaping the Hotel Industry in 2026"
The 2026 outlook offers marginal improvement. CoStar's February 2026 forecast projects RevPAR growth of just 0.6%, with occupancy declining further to 62.1% and ADR rising only 1%. The hotel industry's own trade group, AHLA, projects guest spending reaching $805 billion in 2026 -- a 1.7% increase that barely outpaces inflation.
Meanwhile, STR demand grew 4.9% year-over-year while supply increased approximately 4% nationally to over 1.7 million properties. That demand-to-supply ratio favors operators. The global vacation rental market reached an estimated $154 billion in 2026, growing at an 11.3% compound annual growth rate -- a pace that dwarfs the hotel industry's sub-2% spending growth.
The divergence is starkest at the lower end of the hotel market. Economy and select-service hotels face flat to negative RevPAR, with demand falling particularly among price-sensitive travelers. Upper-tier luxury and full-service hotels remain more resilient, driven by business travel and group events. But even there, the structural headwinds are real: only 16 full-service hotels are currently under development in the entire United States.
More Than Half of Travelers Now Cross-Compare STR and Hotel Options
The demand shift is not happening in a vacuum. It reflects a fundamental change in how consumers shop for accommodation. According to Reed Smith's 2026 analysis, more than half of consumers now compare STR and hotel options before booking -- up from roughly 35% before the pandemic. Lighthouse research confirms that 45% of travelers explicitly evaluate both accommodation types during their booking process.
"The playing field regarding average daily rates has become more balanced between hotels and short-term rentals. Guests no longer distinguish sharply between accommodation types during initial booking searches." -- Lighthouse (formerly OTA Insight), hotel and STR market convergence analysis
Three forces drive this consumer shift:
Cost-of-living pressure. Rising housing, food, and transportation costs push price-sensitive travelers toward the accommodation option that delivers the most value per dollar. STRs provide a 25% discount compared to hotels in urban markets, according to Lighthouse data. In leisure markets, the gap widens further when calculated on a per-guest basis.
The market share numbers tell the story of a decade-long structural shift. STRs now account for approximately 15% of the US accommodation market, nearly double the 8% share held in 2018. That trajectory shows no sign of reversing.
AirROI Data Across 10 Markets: Where STR RevPAR Rivals Hotel Performance
National trends tell part of the story. Market-level data tells the rest. AirROI data across 10 major US markets reveals where the STR vs hotel demand gap is widest -- and where hotels still hold the edge.
| Market | Occupancy | ADR | RevPAR | Annual Revenue | Active Listings | Lead Time |
|---|---|---|---|---|---|---|
| Breckenridge, CO | 41% | $590 | $245 | $58,508 | 3,252 | 64.2 days |
| Sedona, AZ | 52% | $454 | $240 | $69,897 | 1,688 | 57.3 days |
| Scottsdale, AZ | 49% | $431 | $214 | $49,316 | 4,611 | 55.4 days |
| Destin, FL | 43% | $477 | $214 | $47,184 | 4,078 | 65.3 days |
| Gatlinburg, TN | 48% | $380 | $182 | $52,125 | 3,792 | 57.2 days |
| Miami Beach, FL | 47% | $380 | $176 | $44,703 | 3,945 | 43.2 days |
| Nashville, TN | 45% | $375 | $168 | $40,361 | 2,298 | 44.0 days |
| Austin, TX | 45% | $320 | $140 | $32,833 | 8,920 | 38.9 days |
| New York, NY | 51% | $270 | $154 | $27,078 | 7,939 | 50.6 days |
| Denver, CO | 55% | $238 | $131 | $30,823 | 3,789 | 43.6 days |
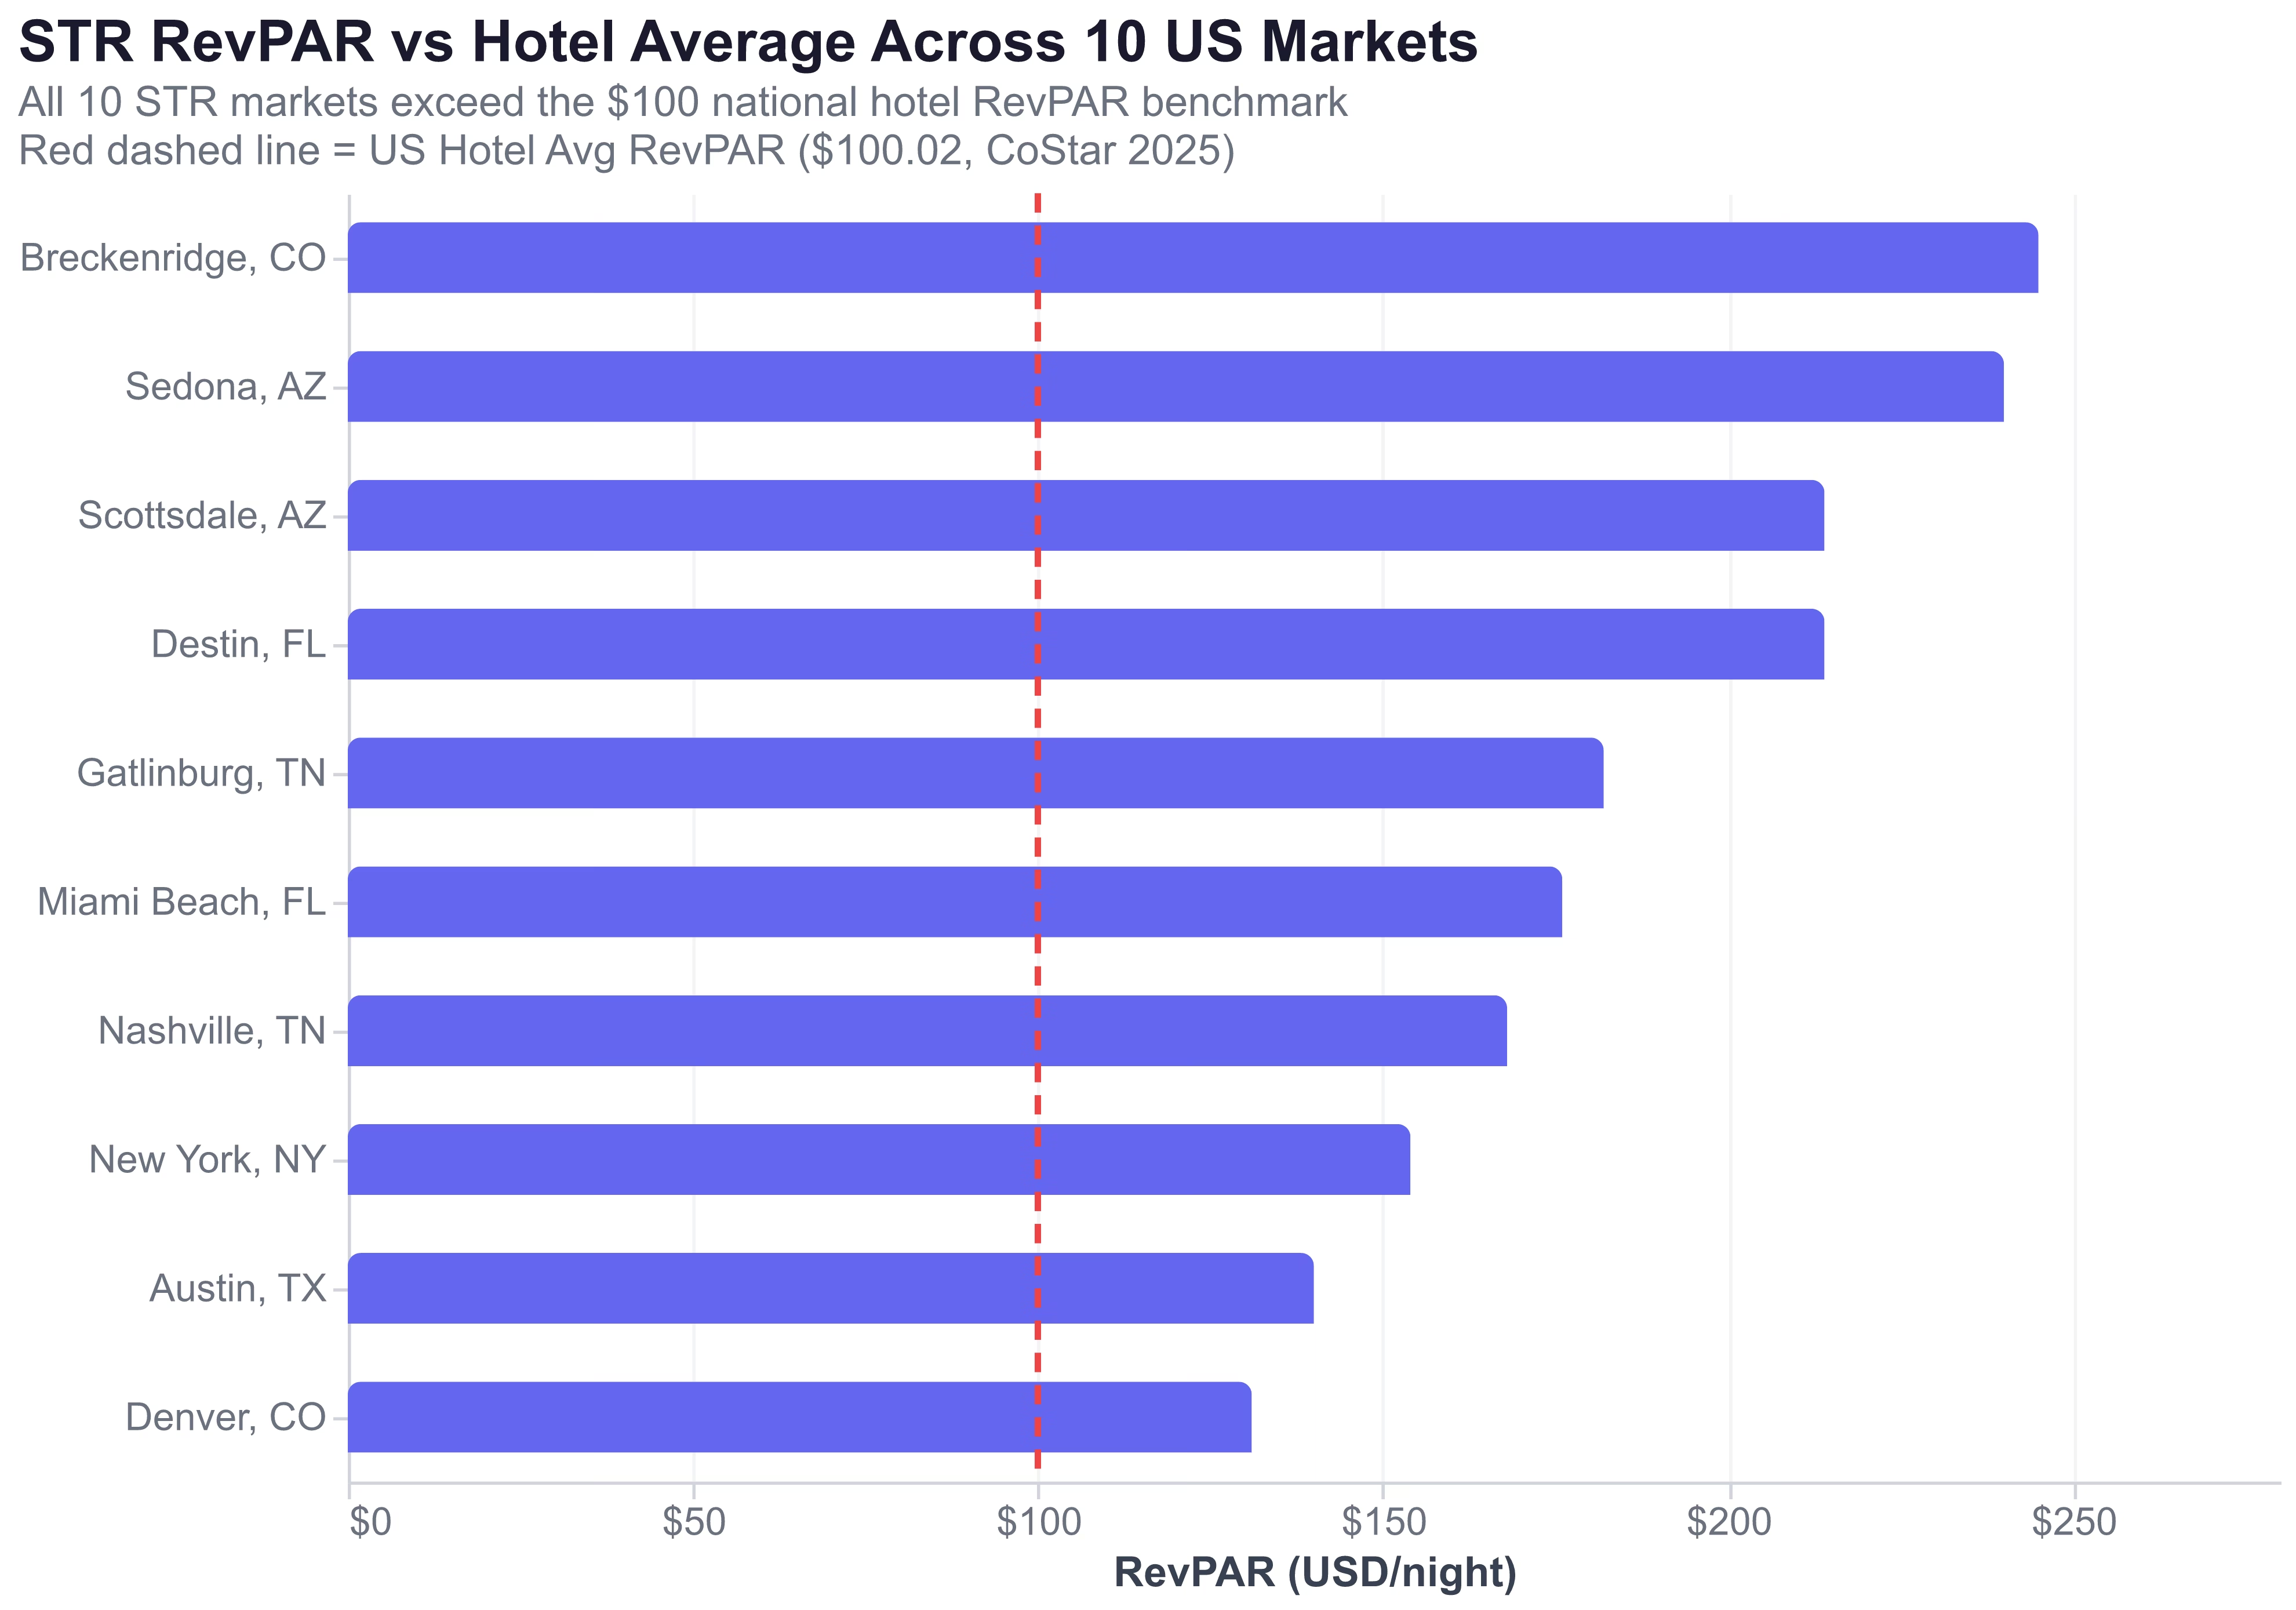
The headline finding: all 10 STR markets exceed the national hotel RevPAR of $100.02. Breckenridge STRs generate $245 RevPAR -- more than double the hotel average -- while even Denver's $131 STR RevPAR outpaces it by 31%.
But the comparison sharpens further when you segment by market type.
Leisure Markets: Where the STR Value Proposition Is Strongest
Leisure markets demonstrate the clearest STR advantage over hotels. Breckenridge commands a $590 ADR -- more than 3.6 times the national hotel ADR of $160.54. Destin runs at $477, Sedona at $454, and Gatlinburg at $380.
The math becomes compelling when calculated on a per-guest basis. A Gatlinburg 3-bedroom cabin sleeping 8 guests at $380 per night costs $48 per person. Three hotel rooms at $160 each ($480 total) costs $60 per person -- a 25% premium over the STR with less space, no kitchen, and no shared living area. More than half of travelers now run this calculation.
Urban Markets: Where Hotels Still Fight But STRs Gain Ground
Urban markets present a more competitive dynamic. Nashville STRs command $375 ADR and $168 RevPAR across 2,298 entire-home listings -- strong numbers, but hotels still win business travel and convention demand. Austin's 8,920 entire-home listings generate $140 RevPAR, reflecting high supply density that pressures individual operator returns.
Denver stands out with the highest STR occupancy in the dataset (55%) but the lowest ADR ($238), suggesting a market where STRs compete primarily on price rather than premium positioning. New York is the regulatory outlier: Local Law 18 reduced STR listings by over 90% since September 2023, but remaining operators command $270 ADR with 51% occupancy -- and annual revenue of $27,078 per listing, reflecting long minimum-night constraints imposed by the law.
Miami Beach illustrates how external headwinds can hit hotels harder than STRs. US inbound travel declined 5% overall in 2026, with a 25% drop from Canadian visitors -- a blow to hotel-dependent international tourism. STR operators in Miami Beach, with $380 ADR and 47% occupancy, benefit from domestic demand diversification that hotels concentrated in international arrivals do not have.
The 136% Mid-Term Rental Surge: STRs' Fastest-Growing Front Against Hotels
The fastest-growing competitive front between STRs and hotels is not the nightly booking. It is the extended stay.
Nights booked for stays of 28 days or more surged 136% between 2019 and 2025, rising from approximately 20 million to 46 million nights, according to AirDNA data reported by Short Term Rentalz. Monthly rentals now represent 19% of total rental demand, growing at 8% annually -- more than double the 3% growth rate for traditional short-term bookings.
The tenant composition reveals who is driving this shift: business travelers (30%), healthcare professionals (25%), relocating families and insurance placements (20%), academics (10%), and digital nomads (5%). These are segments that historically defaulted to extended-stay hotels.
The hotel industry recognizes the threat. Extended-stay brands dominate new hotel development: projects under $15 million represent the strongest pipeline category. Marriott's Residence Inn expanded into high-demand corporate hubs, while IHG's Staybridge Suites targeted growing tech and financial centers. Major hotel operators collectively hold approximately 40% of the extended-stay market.
But STRs hold structural advantages in this fight: residential neighborhoods, full kitchens, dedicated workspaces, and the authenticity of a real home. The 136% demand surge indicates that consumers agree.
The Professionalization Bridge: How STR Quality Is Approaching Hotel Standards
The consumer demand shift would not sustain if STR quality remained inconsistent. It has not. The professionalization of the STR industry bridges the quality gap with hotels while preserving the price and space advantages that drive consumer switching.
Three operational dimensions drive the professionalization premium:
Consistent guest experience. Smart locks, professional cleaning protocols, standardized amenity kits, and instant booking create a hotel-like reliability that reduces booking friction for first-time STR guests. When the experience is predictable, the 50%+ of cross-comparing consumers choose on value rather than risk.
Operational scale. Professional operators optimize turnovers, automate guest communication, and maintain quality across portfolios -- reducing the per-unit cost of hotel-grade service delivery.
The result: as STR quality converges with hotel standards, the quality gap narrows while the value gap widens. A professionally managed STR delivers hotel-like consistency at a per-guest cost that select-service hotels cannot match.
Hotels Are Fighting Back -- Here Is What Hosts Need to Watch
The hotel industry is not surrendering market share passively. Three strategic responses deserve attention from STR operators.
Extended-stay expansion. Hotels are building what STRs already have. Extended-stay projects dominate new development, with low-cost conversion and renovation projects hitting record highs. The hotel industry is betting that branded extended-stay products can recapture the 136% mid-term rental demand growth. STR operators should track competitive supply in this segment specifically.
Property conversions. With only 16 full-service hotels under development nationally, the hotel industry is repositioning existing assets rather than building new ones. Conversion projects offer faster turnaround and revenue timelines. For STR markets adjacent to repositioned hotel supply, this introduces new competitive pressure.
Capturing Hotel-Switching Demand: A 5-Point Playbook for STR Hosts
The macro data is clear: short-term rental demand is outpacing hotels, and the consumer comparison shift creates a capture opportunity. Here is how to position.
1. Price against hotel comps, not just STR comps. Calculate the per-guest cost of your property versus equivalent hotel rooms. A $380/night cabin sleeping 8 guests at $48/person beats three $160/night hotel rooms at $60/person by 25%. Make this calculation visible in your listing description.
2. Market the value proposition explicitly. Kitchen savings ($30-50/day for a family versus dining out), dedicated workspace, private outdoor space, and washer/dryer access are competitive advantages that hotel rooms cannot match. Mention them in the first three lines of your listing -- the lines that appear before "read more."
3. Target corporate and extended-stay bookings. The 136% growth in mid-term rentals represents your fastest-growing demand segment. List on Furnished Finder alongside Airbnb, offer 15-20% discounts for 30+ day stays, and highlight reliable Wi-Fi, a desk setup, and proximity to business centers.
4. Adopt hotel-like operational standards. Professional cleaning protocols, smart locks for seamless check-in, consistent amenity kits, and instant booking capability reduce friction for the 50%+ of travelers who cross-compare STR and hotel options. The quality gap is the primary barrier to conversion.
The accommodation market has tilted. The question for STR hosts is not whether the shift is real -- it is whether they are positioned to capture it.
Frequently Asked Questions
Yes. US hotel RevPAR declined 0.3% in 2025 -- the first non-recessionary decline in recorded history -- while STR demand grew 4.9% year-over-year. The 2026 hotel forecast projects only 0.6% RevPAR growth. AirROI data shows STR RevPAR ranges from $131 to $245 across 10 major US markets, with all 10 exceeding the $100 national hotel average.
More than 50% of consumers now compare STR and hotel options before booking, driven by cost-of-living pressures and improved STR quality. STRs offer a 25% discount over hotels in urban markets and superior space-per-dollar in leisure markets -- a 3-bedroom cabin sleeping 8 at $380 per night costs less than three hotel rooms at $160 each.
Economy and select-service hotels face the steepest declines. RevPAR in lower-tier segments remains flat to negative while upper-tier hotels show signs of recovery. The demand shift hits hardest in leisure markets where STRs offer family-sized accommodations that hotels cannot match.
Price against local hotel comps rather than just STR comps, highlight cost-per-guest savings in your listing, target corporate and extended-stay bookings on platforms like Furnished Finder, adopt hotel-like operational standards such as smart locks and professional cleaning, and use AirROI Atlas to benchmark your RevPAR against local hotel performance.
Evidence points to structural change rather than a cyclical blip. STR market share doubled from 8% to 15% since 2018, mid-term rental bookings surged 136% since 2019, and consumer cross-comparison behavior is now the default. Hotels are responding with extended-stay expansion and regulatory lobbying, but the value and space advantages of STRs persist.