Ainaloa CDP, Hawaii Airbnb Market Data 2026: STR Report & Statistics
How much can you earn on Airbnb in Ainaloa CDP, Hawaii? Based on AirROI's 2026 dataset (May 2025 – April 2026), the short answer is $16,473 per year — at a $127 nightly rate, 51.0% occupancy, and a $58 RevPAR that reflects moderate rate-to-revenue efficiency with room to optimize.
With just 22 active listings, Ainaloa CDP is a micro-market where solid booking activity throughout the year. Supply grew 83.3% and nightly rates have risen, creating an environment where the most bookable listings stand to capture outsized share. Hosts who pair competitive pricing with strong guest experience are well-positioned to convert the growing traveler base into consistent bookings.
Regulation data is limited for this market, and hosts should verify short-term rental rules with the local government. In a market this size, differentiated listings with strong reviews can capture outsized returns relative to the competition.

Table of Contents [hide] [show]
What Are the Key Airbnb Metrics in Ainaloa CDP?
In Ainaloa CDP, the headline Airbnb metrics are $16,473 in average annual revenue,51.0% occupancy, $127 ADR, and $58 in RevPAR, and guests book about 48 days in advance.
How Much Do Airbnb Hosts Earn Monthly in Ainaloa CDP?
Understanding the monthly revenue variations for Airbnb listings in Ainaloa CDP is key to maximizing your short term rental income potential. Seasonality significantly impacts earnings. Our analysis, based on data from the past 12 months, shows that the peak revenue month for STRs in Ainaloa CDP is typically October, while April often presents the lowest earnings, highlighting opportunities for strategic pricing adjustments during shoulder and low seasons. Explore the typical Airbnb income in Ainaloa CDP across different performance tiers:
- Best-in-class properties (Top 10%) achieve $3,575+ monthly, often utilizing dynamic pricing and superior guest experiences.
- Strong performing properties (Top 25%) earn $2,677 or more, indicating effective management and desirable locations/amenities.
- Typical properties (Median) generate around $1,768 per month, representing the average market performance.
- Entry-level properties (Bottom 25%) see earnings around $921, often with potential for optimization.
Average Monthly Airbnb Earnings Trend in Ainaloa CDP
What Is the Monthly Airbnb Occupancy Rate in Ainaloa CDP?
Maximize your bookings by understanding the Ainaloa CDP STR occupancy trends. Seasonal demand shifts significantly influence how often properties are booked. Typically, Julysees the highest demand (peak season occupancy), while April experiences the lowest (low season). Effective strategies, like adjusting minimum stays or offering promotions, can boost occupancy during slower periods. Here's how different property tiers perform in Ainaloa CDP:
- Best-in-class properties (Top 10%) achieve 87%+ occupancy, indicating high desirability and potentially optimized availability.
- Strong performing properties (Top 25%) maintain 75% or higher occupancy, suggesting good market fit and guest satisfaction.
- Typical properties (Median) have an occupancy rate around 55%.
- Entry-level properties (Bottom 25%) average 31% occupancy, potentially facing higher vacancy.
Average Monthly Occupancy Rate Trend in Ainaloa CDP
What Is the Average Airbnb Nightly Rate in Ainaloa CDP?
Effective short term rental pricing strategy in Ainaloa CDP involves understanding monthly ADR fluctuations. The Average Daily Rate (ADR) for Airbnb in Ainaloa CDP typically peaks in December and dips lowest during May. Leveraging Airbnb dynamic pricing tools or strategies based on this seasonality can significantly boost revenue. Here's a look at the typical nightly rates achieved:
- Best-in-class properties (Top 10%) command rates of $209+ per night, often due to premium features or locations.
- Strong performing properties (Top 25%) achieve nightly rates of $168 or more.
- Typical properties (Median) charge around $106 per night.
- Entry-level properties (Bottom 25%) earn around $73 per night.
Average Daily Rate (ADR) Trend by Month in Ainaloa CDP
What Is the RevPAR for Airbnb in Ainaloa CDP?
RevPAR in Ainaloa CDP is currently $58. Because RevPAR combines nightly rates with realized occupancy, it is one of the cleanest ways to compare how efficiently listings turn demand into revenue across the market.
- Entry-level properties (Bottom 25%) see $32 RevPAR.
- Typical properties (Median) generate $52 RevPAR.
- Strong performers (Top 25%) earn $88 RevPAR.
- Best-in-class (Top 10%) achieve $104 RevPAR.
Average Monthly RevPAR Trend in Ainaloa CDP
RevPAR Insights for Ainaloa CDP
- The average RevPAR in Ainaloa CDP is $58. This metric combines nightly rates with realized occupancy, making it one of the best single-number indicators of market efficiency.
- The gap between the top 10% ($104) and bottom 25% ($32) is $72, suggesting a relatively compressed market where operational differences yield moderate returns.
- RevPAR peaks in Oct and bottoms out in Apr, mirroring the broader seasonal demand pattern and suggesting opportunities for dynamic pricing.
Recommendations for Hosts
- Track your own RevPAR monthly against these Ainaloa CDP benchmarks. If your RevPAR falls below the median of $52, examine whether low occupancy or low ADR is the primary drag.
- Top-quartile listings achieve $88+ RevPAR through a combination of competitive pricing, strong reviews, and strategic amenities. Target this tier through incremental improvements.
- Use RevPAR rather than revenue alone when comparing properties of different sizes — it normalizes for available nights and gives a more accurate picture of performance.
Get Live Ainaloa CDP Market Intelligence 👇
Explore Real-time Analytics
When Is the Peak Season for Airbnb in Ainaloa CDP?
Ainaloa CDP's peak Airbnb season falls in October, July, February, while the softest stretch is April, May, June. Overall, the market shows moderate seasonality with distinct peak and low periods, which should guide pricing, minimum stays, and cash-flow planning.
Peak Season (October, July, February)
- Revenue averages $2,230 per month
- Occupancy rates average 60.5%
- Daily rates average $122
Shoulder Season
- Revenue averages $1,940 per month
- Occupancy maintains around 52.2%
- Daily rates hold near $124
Low Season (April, May, June)
- Revenue drops to average $1,624 per month
- Occupancy decreases to average 48.5%
- Daily rates adjust to average $118
Seasonality Insights for Ainaloa CDP
- The Airbnb seasonality pattern in Ainaloa CDP shows moderate seasonality with distinct peak and low periods. While the sections above show seasonal averages, it is also insightful to look at the extremes:
- During the high season, the absolute peak month showcases Ainaloa CDP's highest earning potential, with monthly revenues climbing to $2,374, occupancy reaching 64.0%, and ADRs peaking at $132.
- Conversely, the slowest single month marks the market's lowest point — revenue may dip to $1,479, occupancy could drop to 36.7%, and ADRs may adjust to $109.
- Understanding both the seasonal averages and these monthly peaks and troughs in revenue, occupancy, and ADR is crucial for maximizing your Airbnb profit potential in Ainaloa CDP.
Seasonal Strategies for Maximizing Profit
- Peak Season: Maximize revenue through premium pricing and potentially longer minimum stays. Ensure high availability and consider tightening cancellation policies to reduce last-minute gaps.
- Low Season: Offer competitive pricing, extended-stay discounts, and flexible cancellation policies. Target off-season travelers like remote workers, budget-conscious guests, and travelers with flexible schedules.
- Shoulder Seasons: Implement dynamic pricing that bridges peak and low rates. Target weekend travelers, local events, and business visitors. Slightly more flexible terms than peak season can help maintain occupancy without deep discounting.
- Regularly analyze your own performance against these Ainaloa CDP seasonality benchmarks and adjust your pricing and availability strategy accordingly.
Do You Need a License for Airbnb in Ainaloa CDP?
With 18% of listings showing registration in 2026, understanding potential Airbnb license requirements is crucial in Ainaloa CDP. Always verify the latest short-term rental regulations and Airbnb license requirements directly with local government authorities for Ainaloa CDP to ensure full compliance before hosting.
(Source: AirROI data, 2026, based on 18% licensed listings)
What Are the Best Neighborhoods for Airbnb in Ainaloa CDP?
With a compact short-term rental market, Ainaloa CDP gives early-mover hosts an advantage in the right neighborhoods. The areas listed below are where guest demand and local attractions converge — a useful lens for investors evaluating whether to enter this market and where to position their listing.
| Neighborhood / Area | Why Host Here? (Target Guests & Appeal) | Key Attractions & Landmarks |
|---|---|---|
| Ainaloa Estates | A peaceful suburban community offering spacious lots and tranquil surroundings. Attracts families and vacationers looking for a quiet getaway close to nature and outdoor activities. | Hawaii Volcanoes National Park, MacKenzie State Park, Puna Coast, Punalu’u Black Sand Beach, Kaimu Black Sand Beach, Kapoho Tide Pools |
| Pahoa | A charming small town with a laid-back vibe, known for its local shops and vibrant community. Popular with tourists seeking a more authentic Hawaiian experience, along with access to beautiful natural scenery. | Pahoa Village, Ahalanui Park, Lava Tree State Park, Kehena Black Sand Beach, Green Lake, Pohoiki Beach |
| Hilo | A historic town with rich Hawaiian culture and lush landscapes. Known for its bustling markets and beautiful waterfalls, Hilo is an excellent choice for travelers interested in nature and culture. | Rainbow Falls, Liliuokalani Gardens, Hilo Farmers Market, Imiloa Astronomy Center, Hawaii Tropical Botanical Garden, Panaewa Rainforest Zoo |
| Keaau | A growing community near Hilo, known for its access to both beach and forest adventures. It appeals to families and outdoor enthusiasts looking for a base for exploration. | Kea’au Shopping Center, Pana’ewa Rainforest Zoo, Hawaiian Paradise Park, Kilauea Volcano, Coconut Island |
| Kailua-Kona | A popular tourist destination known for its beaches, shopping, and nightlife. Offers a vibrant atmosphere for vacationers looking for relaxation and entertainment. | Kona Coffee Living History Farm, Hulihee Palace, Magic Sands Beach, Kona Brewing Company, Kona Farmers Market |
| Waimea (Kamuela) | A historical town in the heart of Hawaii, offering a unique blend of cowboy culture and lush landscapes. Ideal for travelers looking for an authentic experience with local farms and ranches. | Waimea Town Market, Kohala Mountain, Parker Ranch, Waimea Valley, Pololu Valley |
| North Kohala | A scenic area with stunning views and a slower pace of life, perfect for guests looking to explore Hawaii’s natural beauty and historical sites. | Pololu Valley Lookout, Mahana Beach, Kapa’au, King Kamehameha Statue, Kohala Historical Society |
| Captain Cook | A quaint town located near historical sites and beautiful beaches. A great spot for those who enjoy outdoor activities such as snorkeling and hiking. | Kealakekua Bay, Pu’uhonua O Hōnaunau National Historical Park, Greenwell Farms, Captain Cook Monument, Ka’awaloa Trail |
With 8 distinct neighborhoods showing meaningful short-term rental activity, Ainaloa CDP offers diversification within a single market. Investors can tailor their strategy — from high-turnover tourist zones to quieter residential areas that attract longer stays and remote workers.
What Types of Properties Are on Airbnb in Ainaloa CDP?
Room Type Distribution
Property Type Distribution
Market Composition Insights for Ainaloa CDP
- The Ainaloa CDP Airbnb market composition is heavily skewed towards Entire Home/Apt listings, which make up 68.2% of the 22 active rentals. This indicates strong guest preference for privacy and space.
- However, a notable 31.8% share for Private Rooms suggests opportunities for budget-conscious travelers or hosts renting out spare rooms.
- Looking at the property type distribution in Ainaloa CDP, House properties are the most common (81.8%), reflecting the local real estate landscape.
- Houses represent a significant 81.8% portion, catering likely to families or larger groups.
- The presence of 9.1% Hotel/Boutique listings indicates integration with traditional hospitality.
- Smaller segments like apartment/condo, others (combined 9.0%) offer potential for unique stay experiences.
Ainaloa CDP Airbnb Room Capacity Analysis (2026): Bedroom Distribution
Distribution of Listings by Number of Bedrooms
Room Capacity Insights for Ainaloa CDP
- The dominant room capacity in Ainaloa CDP is 1 bedroom listings, making up 31.8% of the market. This suggests a strong demand for properties suitable for couples or solo travelers.
- Together, 1 bedroom and 3 bedrooms properties represent 54.5% of the active Airbnb listings in Ainaloa CDP, indicating a high concentration in these sizes.
- A significant 22.7% of listings offer 3+ bedrooms, catering to larger groups and families seeking more space in Ainaloa CDP.
Ainaloa CDP Vacation Rental Guest Capacity Trends (2026)
Distribution of Listings by Guest Capacity
Guest Capacity Insights for Ainaloa CDP
- The most common guest capacity trend in Ainaloa CDP vacation rentals is listings accommodating 2 guests (27.3%). This suggests the primary traveler segment is likely couples or solo travelers.
- Properties designed for 2 guests and 4 guests dominate the Ainaloa CDP STR market, accounting for 54.6% of listings.
- 22.7% of properties accommodate 6+ guests, serving the market segment for larger families or group travel in Ainaloa CDP.
- On average, properties in Ainaloa CDP are equipped to host 3.1 guests.
How Do Listings in Ainaloa CDP Compare on Quality?
Listing quality in Ainaloa CDP can be approximated through presentation depth, bedroom count, and how often hosts disclose exact locations. These signals show how professionally the local supply base is merchandised.
Listing Quality Insights for Ainaloa CDP
- At 31.2 photos per listing on average, Ainaloa CDP hosts invest well in visual presentation. Listings with 20+ photos consistently outperform in search ranking and conversion.
- 4.5% of listings show their exact location. Lower disclosure rates can increase booking hesitation — guests want to know exactly where they are staying.
Recommendations for Hosts
- Enable exact location if possible — it removes a common source of guest uncertainty and can improve your listing's position in map-based searches.
- Use these quality indicators as a self-audit checklist. Listings that exceed the Ainaloa CDP averages across all three metrics are better positioned for premium pricing.
What Amenities Do Airbnb Guests Expect in Ainaloa CDP?
Amenity Prevalence
Amenity Insights for Ainaloa CDP
- Essential amenities in Ainaloa CDP that guests expect include: Hangers, Free parking on premises, Dishes and silverware, Wifi, Bed linens, Hot water, Coffee maker, Smoke alarm. Lacking these (any) could significantly impact bookings.
- Popular amenities like Refrigerator, Cooking basics are common but not universal. Offering these can provide a competitive edge.
Recommendations for Hosts
- Ensure your listing includes all essential amenities for Ainaloa CDP: Hangers, Free parking on premises, Dishes and silverware, Wifi, Bed linens, Hot water, Coffee maker, Smoke alarm.
- Prioritize adding missing essentials: Coffee maker, Smoke alarm.
- Consider adding popular differentiators like Refrigerator or Cooking basics to increase appeal.
- Highlight unique or less common amenities you offer (e.g., hot tub, dedicated workspace, EV charger) in your listing description and photos.
- Regularly check competitor amenities in Ainaloa CDP to stay competitive.
Which Airbnb Amenities Boost Revenue in Ainaloa CDP?
Not every amenity matters equally. This table focuses on the amenities most associated with higher revenue in Ainaloa CDP, which makes it more useful for prioritizing upgrades than a simple popularity list alone.
| Amenity | Prevalence | Revenue With | Revenue Without | Revenue Uplift |
|---|---|---|---|---|
Freezer | 54.5% | $21,466 | $10,481 | 104.8% |
Patio or balcony | 72.7% | $18,721 | $10,477 | 78.7% |
Drying rack for clothing | 22.7% | $24,618 | $14,077 | 74.9% |
Stove | 59.1% | $19,958 | $11,439 | 74.5% |
Extra pillows and blankets | 72.7% | $18,598 | $10,805 | 72.1% |
Beach essentials | 22.7% | $23,912 | $14,285 | 67.4% |
Room-darkening shades | 45.5% | $20,785 | $12,879 | 61.4% |
Air conditioning | 27.3% | $22,715 | $14,132 | 60.7% |
Coffee | 54.5% | $19,856 | $12,413 | 60.0% |
Portable fans | 27.3% | $22,629 | $14,164 | 59.8% |
Revenue Impact Insights for Ainaloa CDP
- Freezer tops the revenue impact list with a 104.8% uplift — listings with this amenity earn $21,466 vs. $10,481 without it.
Recommendations for Hosts
- Focus your upgrade budget on amenities in the top half of this table. Below-median amenities may improve guest experience but contribute less to revenue growth.
- Highlight revenue-impacting amenities prominently in your listing title, photos, and description — guests can't value what they don't notice.
Dive Deeper: Advanced Ainaloa CDP STR Market Data (2026)
Ready to unlock more insights? AirROI provides access to advanced metrics and comprehensive Airbnb data for Ainaloa CDP. Explore detailed analytics beyond this report to refine your investment strategy, optimize pricing, and maximize your vacation rental profits.
Explore Advanced MetricsAinaloa CDP Airbnb Guest Demographics & Profile Analysis (2026)
Guest Profile Summary for Ainaloa CDP
- The typical guest profile for Airbnb in Ainaloa CDP consists of primarily domestic travelers (81%), often arriving from nearby New York, typically belonging to the Post-2000s (Gen Z/Alpha) group (50%), primarily speaking English or Spanish.
- Domestic travelers account for 81.1% of guests.
- Key international markets include United States (81.1%) and Germany (3.9%).
- Top languages spoken are English (60.4%) followed by Spanish (9.9%).
- A significant demographic segment is the Post-2000s (Gen Z/Alpha) group, representing 50% of guests.
Recommendations for Hosts
- Target domestic marketing efforts towards travelers from New York and Seattle.
- Tailor amenities and listing descriptions to appeal to the dominant Post-2000s (Gen Z/Alpha) demographic (e.g., highlight fast WiFi, smart home features, local guides).
- Highlight unique local experiences or amenities relevant to the primary guest profile.
- Consider seasonal promotions aligned with peak travel times for key origin markets.
What Are Airbnb Guest Ratings in Ainaloa CDP?
Listings in Ainaloa CDP average 4.87 out of 5 overall, with about 68.8 reviews per active listing and 40.9% of listings carrying the Guest Favorite badge.
Rating Breakdown by Category
Guest Rating Insights for Ainaloa CDP
- With an overall rating of 4.87, Ainaloa CDP listings meet an exceptionally high bar. Guests consistently report strong satisfaction, which drives repeat bookings and referral traffic.
- The strongest subcategory is Communication (4.92), while Location (4.73) trails behind — a useful signal for hosts looking to prioritize upgrades.
- 40.9% of listings carry the Guest Favorite badge, a strong trust signal that can meaningfully lift click-through and booking rates.
Recommendations for Hosts
- Focus improvement efforts on Location — even small gains in the weakest subcategory can lift overall ratings and search ranking.
- Encourage guests to leave reviews after checkout. Listings with more reviews rank higher in search results and convert browsers into bookers more effectively.
Ainaloa CDP Airbnb Booking Patterns (2026): Available vs. Booked Days
Available Days Distribution
Booked Days Distribution
Booking Pattern Insights for Ainaloa CDP
- The most common availability pattern in Ainaloa CDP falls within the 181-270 days range, representing 40.9% of listings. This suggests many properties have significant open periods on their calendars.
- Approximately 72.7% of listings show high availability (181+ days open annually), indicating potential for increased bookings or specific owner usage patterns.
- For booked days, the 91-180 days range is most frequent in Ainaloa CDP (40.9%), reflecting common guest stay durations or potential owner blocking patterns.
- A notable 31.8% of properties secure long booking periods (181+ days booked per year), highlighting successful long-term rental strategies or significant owner usage.
How Far in Advance Do Guests Book Airbnb in Ainaloa CDP?
Average Booking Lead Time by Month
Booking Lead Time Insights for Ainaloa CDP
- The overall average booking lead time for vacation rentals in Ainaloa CDP is 48 days.
- Guests book furthest in advance for stays during April (average 89 days), likely coinciding with peak travel demand or local events.
- The shortest booking windows occur for stays in May (average 35 days), indicating more last-minute travel plans during this time.
- Seasonally, Spring (61 days avg.) sees the longest lead times, while Fall (40 days avg.) has the shortest, reflecting typical travel planning cycles.
Recommendations for Hosts
- Use the overall average lead time (48 days) as a baseline for your pricing and availability strategy in Ainaloa CDP.
- For April stays, consider implementing length-of-stay discounts or slightly higher rates for bookings made less than 89 days out to capitalize on advance planning.
- Target marketing efforts for the Spring season well in advance (at least 61 days) to capture early planners.
- Monitor your own booking lead times against these Ainaloa CDP averages to identify opportunities for dynamic pricing adjustments.
What Is the Average Length of Stay for Airbnb in Ainaloa CDP?
Guests in Ainaloa CDP stay about 7.1 nights on average, generating roughly 532 reservations and 24.2 bookings per listing in the latest AirROI dataset. The most common check-in time is 3:00 PM and check-out is 11:00 AM.
Monthly Length of Stay in Ainaloa CDP
Check-in Time Distribution
Check-out Time Distribution
Stay Pattern Insights for Ainaloa CDP
- Longer stays mean fewer turnovers and lower cleaning costs per revenue dollar. This pattern also opens the door to monthly discount strategies that attract remote workers and extended-stay travelers.
- At 24.2 bookings per listing, the turnover rate is high. Hosts with streamlined operations (self-check-in, automated messaging, reliable cleaners) have a structural advantage.
- Stay lengths peak in Jul (8.7 nights) and shorten in Nov (3.4 nights). Adjust minimum-night requirements seasonally to match.
Recommendations for Hosts
- Leverage the longer-stay pattern by offering weekly discounts — even 5-10% off can convert browsing into bookings for guests considering an extended stay.
- Set your check-in time to match or beat the market standard of 3:00 PM. Offering early check-in flexibility can be a low-cost differentiator.
- Monitor length-of-stay seasonality to adjust minimum-night requirements — longer minimums during peak periods maximize revenue while shorter minimums fill gaps in shoulder seasons.
Ainaloa CDP Airbnb Minimum Stay Requirements Analysis
Distribution of Listings by Minimum Night Requirement
1 Night
7 listings
31.8% of total
2 Nights
2 listings
9.1% of total
3 Nights
6 listings
27.3% of total
7-29 Nights
1 listings
4.5% of total
30+ Nights
6 listings
27.3% of total
Key Insights
- The most prevalent minimum stay requirement in Ainaloa CDP is 1 Night, adopted by 31.8% of listings. This highlights the market's preference for shorter, flexible bookings.
- A significant segment (27.3%) caters to monthly stays (30+ nights) in Ainaloa CDP, pointing to opportunities in the extended-stay market.
Recommendations
- Align with the market by considering a 1 Night minimum stay, as 31.8% of Ainaloa CDP hosts use this setting.
- Explore offering discounts for stays of 30+ nights to attract the 27.3% of the market seeking extended stays.
- Adjust minimum nights based on seasonality – potentially shorter during low season and longer during peak demand periods in Ainaloa CDP.
Ainaloa CDP Airbnb Cancellation Policy Trends Analysis (2026)
Flexible
6 listings
27.3% of total
Moderate
8 listings
36.4% of total
Firm
5 listings
22.7% of total
Strict
3 listings
13.6% of total
Cancellation Policy Insights for Ainaloa CDP
- The prevailing Airbnb cancellation policy trend in Ainaloa CDP is Moderate, used by 36.4% of listings.
- There's a relatively balanced mix between guest-friendly (63.7%) and stricter (36.3%) policies, offering choices for different guest needs.
Recommendations for Hosts
- Consider adopting a Moderate policy to align with the 36.4% market standard in Ainaloa CDP.
- Using a Strict policy might deter some guests, as only 13.6% of listings use it. Evaluate if potential revenue protection outweighs possible lower booking rates.
- Regularly review your cancellation policy against competitors and market demand shifts in Ainaloa CDP.
How Much Are Airbnb Cleaning Fees in Ainaloa CDP?
Cleaning fees in Ainaloa CDP are meaningful operating levers, not just pass-through charges. What matters most is how often hosts charge them, how high they run relative to market norms, and how large a share of gross revenue they consume.
Cleaning Fee Insights for Ainaloa CDP
- 81.8% of listings charge a cleaning fee, making it standard practice in Ainaloa CDP. Guests expect it and factor it into their booking decisions.
- The average cleaning fee of $97 is close to the median ($80), suggesting a relatively consistent fee structure across the market.
- Cleaning fees represent 9.6% of gross revenue on average — a modest component of the overall booking price.
Recommendations for Hosts
- Price your cleaning fee competitively against the Ainaloa CDP median of $80. Fees significantly above market norms can deter bookings, especially for shorter stays.
- Monitor competitor cleaning fees regularly. Airbnb's search algorithm factors in total price, so a well-calibrated cleaning fee can improve your listing's ranking.
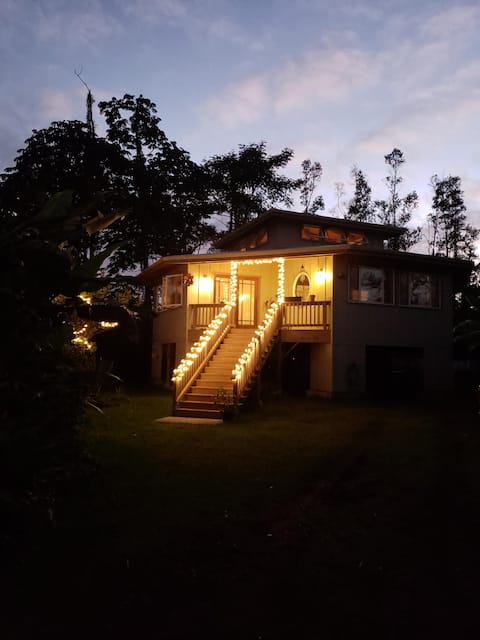
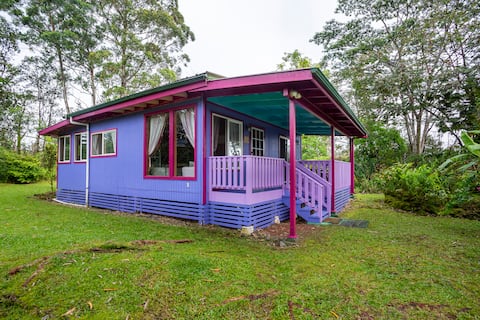
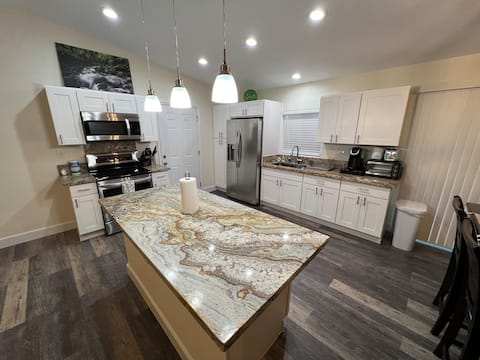
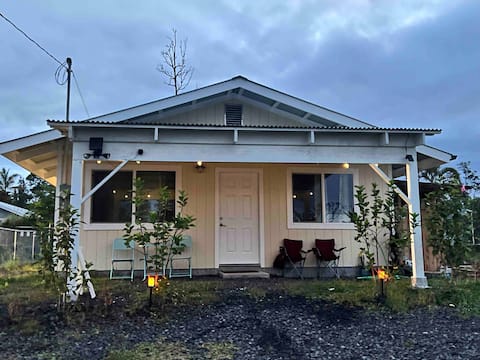
What Do the Top Airbnb Listings in Ainaloa CDP Look Like?
Benchmark your potential! Explore examples of top-performing Airbnb properties in Ainaloa CDPbased on Trailing Twelve Month (TTM) revenue. Analyze their characteristics, revenue, occupancy rate, and ADR to understand what drives success in this market.

“The Pahoa cabin”
Entire Place • 2 bedrooms
Bonsai Bungalow
Entire Place • 2 bedrooms
Hibiscus Cottage - Private Puna Rainforest
Entire Place • 1 bedroom
Home away from home
Entire Place • 3 bedrooms
KopeHale2 Tiny Coffee Farmhouse between Hilo & NPS
Entire Place • 1 bedroom
Aloha! Newer Home on Hawaii Island (Big Island)
Entire Place • 3 bedrooms
Note: Performance varies based on location, size, amenities, seasonality, and management quality. Data reflects the past 12 months.
Who Are the Top Airbnb Hosts in Ainaloa CDP?
Learn from the best! This table showcases top-performing Airbnb hosts in Ainaloa CDP based on the number of properties managed and estimated total revenue over the past year. Analyze their scale and performance metrics.
| Host Name | Properties | Grossing Revenue | Stay Reviews | Avg Rating |
|---|---|---|---|---|
| James | 3 | $44,721 | 30 | 4.78/5.0 |
| Ashley | 1 | $39,611 | 26 | 4.96/5.0 |
| Bodhi Land | 2 | $37,561 | 68 | 4.90/5.0 |
| Kimberly And Dallas | 1 | $35,837 | 223 | 4.97/5.0 |
| Emily | 1 | $32,351 | 199 | 4.87/5.0 |
| Justin | 1 | $31,936 | 82 | 4.83/5.0 |
| Ferdinand | 1 | $27,909 | 190 | 4.84/5.0 |
| Kj | 1 | $25,021 | 89 | 4.97/5.0 |
| Sharon | 3 | $16,473 | 83 | 4.83/5.0 |
| Erin | 1 | $15,908 | 44 | 4.80/5.0 |
Analyzing the strategies of top hosts, such as their property selection, pricing, and guest communication, can offer valuable lessons for optimizing your own Airbnb operations in Ainaloa CDP.
Who Are the Airbnb Hosts in Ainaloa CDP?
Ainaloa CDP has a relatively balanced host base.
Host Profile Insights for Ainaloa CDP
- A 31.8% Superhost share is healthy — enough experienced operators to anchor quality without making the market impenetrable for newcomers.
- 4.5% of listings are professionally managed, reflecting a market still dominated by individual hosts.
- 4.5% of listings have Instant Book enabled. Lower Instant Book adoption means many guests must request approval, which can slow conversions.
- 54.5% of listings use Airbnb's simplified pricing (host-only fee), where the host pays the entire platform service fee and the guest sees one all-in price with no separate Airbnb service charge. High adoption signals a professional, PMS-connected host base — Airbnb mandates simplified pricing for software-connected listings.
Recommendations for Hosts
- Earning Superhost status can significantly improve search ranking and guest trust. Focus on maintaining high response rates, low cancellations, and strong reviews.
- Consider enabling Instant Book — it reduces booking friction and Airbnb's algorithm tends to favor Instant Book listings in search results.
- With 22.7% cohosted listings, there may be a growing local market for property management services.
- Benchmark your host metrics against these Ainaloa CDP averages regularly and adjust your hosting strategy based on what top performers do differently.
Top Professional Management Companies in Ainaloa CDP
These are the highest-grossing professional property management operations in Ainaloa CDP, ranked by total revenue across their portfolio. Their performance metrics offer a benchmark for what institutional-level hosting looks like in this market.
| Company | Listings | Revenue | ADR | Occ. | Rating |
|---|---|---|---|---|---|
| Evolve | 1 | $1,049 | $105 | 16.7% | N/A |
Management Company Insights for Ainaloa CDP
- The leading management company, Evolve, operates 1 listings with $1,049 in gross revenue — a useful benchmark for what scale looks like in Ainaloa CDP.
- Top managers average 1 properties each, suggesting professional management in Ainaloa CDP still operates at a relatively boutique scale.
Recommendations
- With only 4.5% of listings professionally managed, there may be an opportunity to differentiate through more structured operations and consistent guest experiences.
- Study how top management companies price, position, and maintain their portfolios — their ADR and occupancy rates reflect strategies refined across dozens of listings.
- If you're considering hiring a property manager, compare their portfolio performance against these benchmarks before committing.
How Does Ainaloa CDP's Airbnb Market Compare to Nearby Cities?
How does the Ainaloa CDP Airbnb market stack up against its neighbors? Compare key performance metrics like average monthly revenue, ADR, and occupancy rates in surrounding areas to understand the broader regional STR landscape.
Compared with Honalo, Ainaloa CDP has 5 percentage points lower occupancy and about $326 lower ADR. That helps frame whether this market is winning more on demand, pricing, or both.
| Market | Active Properties | Monthly Revenue | Daily Rate | Avg. Occupancy |
|---|---|---|---|---|
| Waimea | 421 | $8,250 | $825.81 | 43% |
| Puakō | 64 | $7,797 | $941.80 | 43% |
| Honalo | 22 | $7,117 | $452.46 | 56% |
| Waikoloa Beach Resort | 27 | $6,538 | $561.90 | 47% |
| Kamuela | 92 | $5,615 | $1026.28 | 29% |
| Wainaku | 21 | $4,908 | $344.89 | 51% |
| Kailua-Kona | 361 | $4,812 | $451.86 | 51% |
| Kahaluu-Keauhou | 761 | $4,718 | $414.39 | 44% |
| Kapalaoa | 360 | $4,352 | $434.18 | 42% |
| Waikoloa Village | 283 | $4,189 | $399.25 | 42% |
Frequently Asked Questions About Airbnb in Ainaloa CDP
These quick answers summarize the most common investor and operator questions using AirROI's latest market data for Ainaloa CDP.
How much do Airbnb hosts make in Ainaloa CDP?
Ainaloa CDP hosts earn about $16,473 per year on average, with an average nightly rate of $127 and RevPAR of $58. Those figures describe the typical revenue environment for active listings in Ainaloa CDP, Hawaii, not the ceiling for the best operators. Source: AirROI 2026 data, Ainaloa CDP market, May 2025 to April 2026.
What is the average Airbnb occupancy rate in Ainaloa CDP?
The average Airbnb occupancy rate in Ainaloa CDP is 51.0%. October is the strongest month and April is the softest, so hosts should expect demand to move meaningfully throughout the year rather than stay flat.
What is the average Airbnb daily rate in Ainaloa CDP?
Listings in Ainaloa CDP average $127 per night. The broader pricing spread also matters: lower-performing listings cluster closer to the lower quartiles, while premium homes can price materially above the city average when demand spikes or listing quality stands out.
How many Airbnb listings are active in Ainaloa CDP?
Ainaloa CDP currently has about 22 active Airbnb listings in AirROI's market dataset. That supply count helps explain how competitive the market is, how much depth there is for benchmarking, and whether the market behaves like a niche destination or a scaled urban market.
How strict are short-term rental regulations in Ainaloa CDP?
AirROI currently classifies the short-term rental regulation level in Ainaloa CDP as Moderate. The dataset also shows about 18.2% of listings with registration evidence. That is a market signal, not legal advice, so hosts should still confirm current licensing and compliance rules locally before listing.
What is the RevPAR for Airbnb in Ainaloa CDP?
RevPAR in Ainaloa CDP is about $58. That metric combines pricing and occupancy into one efficiency number, so it is often a better quick benchmark than ADR alone when investors want to compare how well listings convert nightly rates into realized revenue.
Is Airbnb profitable in Ainaloa CDP?
At 51.0% occupancy, Ainaloa CDP can be profitable — but margins depend heavily on operating costs, property acquisition price, and how well hosts optimize pricing across seasons. Average annual revenue is $16,473, but individual returns depend on property type, location within the city, and the host's operating efficiency.
How far in advance do guests book Airbnb in Ainaloa CDP?
The average booking lead time in Ainaloa CDP is about 48 days — a longer planning horizon typical of destination or vacation markets where travelers book well in advance. Hosts who understand their market's booking cadence can adjust minimum stays and pricing windows accordingly.
What are the best neighborhoods for Airbnb in Ainaloa CDP?
Based on AirROI's analysis, some of the top neighborhoods for short-term rentals in Ainaloa CDP include Ainaloa Estates, Pahoa, Hilo. Each area attracts different guest profiles — from business travelers to leisure visitors — so the best location depends on the property type and target audience a host is aiming for. See the full neighborhood breakdown above.
What type of property performs best on Airbnb in Ainaloa CDP?
entire_home listings make up 68.2% of the active supply in Ainaloa CDP. The most common configuration does not always mean the most profitable — operators who identify underserved property types or bedroom counts can sometimes outperform the market average by filling a gap in local supply.
How does Ainaloa CDP compare to nearby Airbnb markets?
Among neighboring markets, Waimea posts $98,997 in average annual revenue with 42.5% occupancy, compared to Ainaloa CDP's $16,473 and 51.0%. Comparing nearby markets helps investors understand whether a destination's performance reflects local demand or broader regional trends.
What is the average length of stay in Ainaloa CDP?
The average Airbnb stay length in Ainaloa CDP is about 7.1 nights. That matters for turnover, cleaning operations, and pricing strategy because shorter stays increase changeovers while longer stays can smooth occupancy and reduce operational friction.
What is the average Airbnb guest rating in Ainaloa CDP?
Airbnb listings in Ainaloa CDP average 4.87 out of 5 overall. About 40.9% of listings carry the guest favorite badge, which suggests a meaningful share of inventory is competing on review quality rather than price alone.
Which amenities boost Airbnb revenue in Ainaloa CDP?
Freezer and Patio or balcony are among the strongest revenue-linked amenities in Ainaloa CDP. In AirROI's latest dataset, listings with these amenities outperform those without on average revenue, which makes amenities analysis useful for prioritizing investment and listing upgrades.
Do Airbnb hosts charge cleaning fees in Ainaloa CDP?
Yes. About 81.8% of active Airbnb listings in Ainaloa CDP charge a cleaning fee, and the average fee is $97. The more important operating benchmark is how much of gross revenue that fee consumes, not just the absolute dollar amount.
What percentage of Airbnb hosts are Superhosts in Ainaloa CDP?
At 31.8%, there is a healthy mix of experienced and newer hosts — earning Superhost status can still provide a meaningful visibility boost.
About AirROI Market Data
AirROI tracks over 20 million properties across 190+ countries and maintains 15+ years of historical performance data, making it one of the deepest Airbnb and STR intelligence platforms available. The analytics pipeline aggregates listing-level data monthly — revenue, occupancy, nightly rates, RevPAR, guest demographics, booking patterns, and competitive supply — so investors and operators can benchmark any market against its own history and against neighboring destinations.
Real estate investors, property managers, financial institutions, hedge funds, tourism boards, hospitality consultants, tech platforms, and academic researchers rely on AirROI data to underwrite acquisitions, optimize pricing, model macro trends, and conduct peer-reviewed research. Data is available through in-depth market reports like this one and the Airbnb API with 22 endpoints and an Airbnb MCP Server for AI agents.
AirROI proprietary analytics as of 2026-04-30. Metrics reflect trailing twelve-month aggregates from active listings. Revenue figures are market averages, not projections. Neighborhood descriptions are AI-generated and reviewed for accuracy. For full methodology, see the data methodology page.