
Summer 2026 Airbnb Pacing: The 95% of US Markets Without a World Cup Boost
If you host an Airbnb outside the 11 US World Cup cities, the tournament is not coming to save your summer. Summer 2026 airbnb pacing across non-host markets is tracking to a roughly flat year — not the monolithic World Cup boom that dominates every hospitality headline right now. CoStar and Tourism Economics, in their February 2026 forecast, project full-year US hotel RevPAR growth of 0.6%. The World Cup alone contributes 0.4 points of that number. Strip out the tournament effect, and the rest of the country is racing for 0.2% growth over last summer.
Here is the market-by-market pacing picture as it stands today, and what to do with each signal over the next six weeks.
The counter-narrative: 95% of US markets are on their own
Eleven US cities host World Cup matches. Roughly 3,500 US metros have active Airbnb inventory. The math on who benefits from a tournament-driven demand lift has always been narrow, but for most of 2026 the coverage has implied a broader halo. According to CoStar's February 2026 forecast, "without the World Cup, RevPAR growth would be 0.2%, meaning the 2026 World Cup is currently forecasted to contribute a full-year 0.4% RevPAR lift for the U.S." That 0.4-point lift is concentrated in the host cities, and the rest of the country absorbs none of it.
Those fundamentals, as the AirROI pacing data shows, break cleanly into four segments: beach, mountain/national-park, urban non-host, and Sun Belt. Each segment has its own story, and each requires its own pricing response.
Beach markets: holding steady, with no help from the World Cup
Beach markets are the only non-WC segment pacing strong for summer 2026 — and they're doing it the same way they always have. The four beach markets I analyzed show an average WC-window fill rate of 45.5% across Gulf Shores, Destin, Hilton Head Island, and Myrtle Beach, and 56.7% at Bar Harbor, Maine. These numbers are consistent with 2025's same-weeks-out comp, and they indicate that coastal summer demand is tracking its multi-year baseline without any detectable tournament overlay.
Here is the segment detail as of April 22:
| Market | Active listings | June 11-July 19 fill % | Booked ADR | Available ADR | Booked-vs-available gap |
|---|---|---|---|---|---|
| Bar Harbor, ME | 618 | 56.7% | $596 | $515 | +16% |
| Gulf Shores, AL | 5,564 | 53.9% | $685 | $540 | +27% |
| Destin, FL | 4,498 | 52.1% | $776 | $606 | +28% |
| Hilton Head, SC | 5,254 | 48.3% | $670 | $490 | +37% |
| Myrtle Beach, SC | 10,007 | 27.5% | $408 | $339 | +20% |
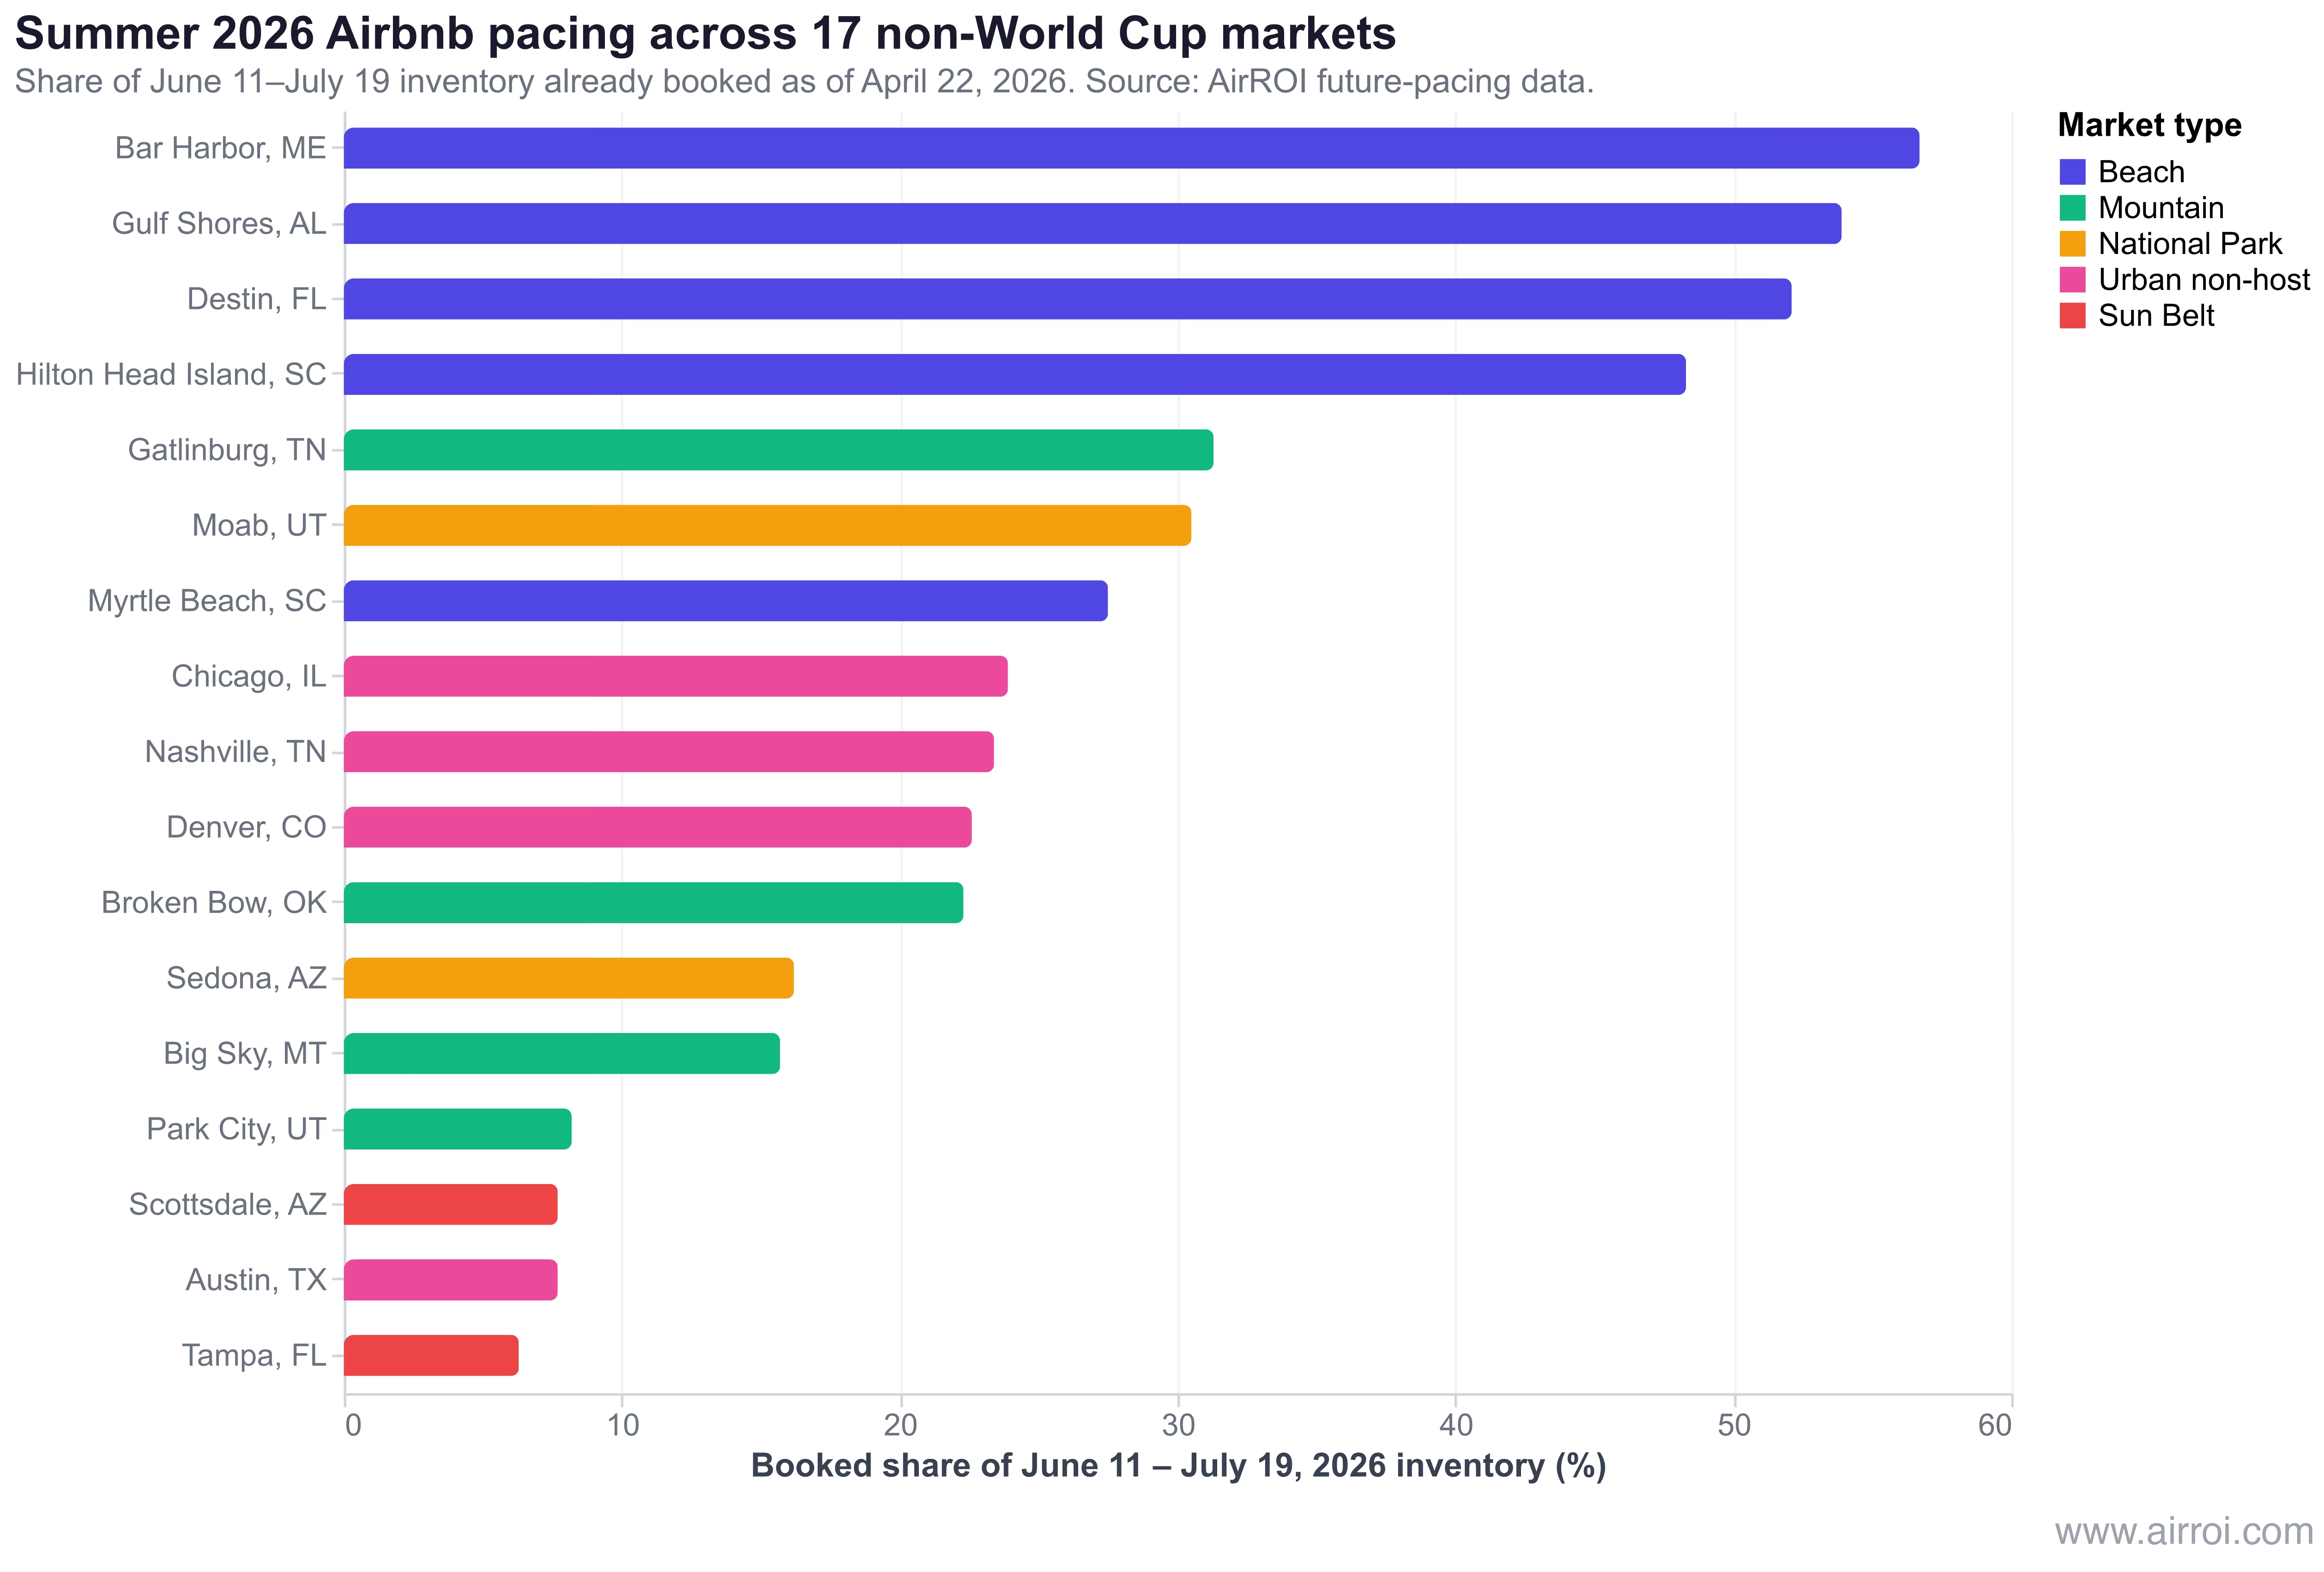
The consistent pattern across the top four beach markets: booked ADR sits 16-37% above the rate listed for remaining available inventory. That gap is the signal to watch. Hosts who priced aggressively in January and February — anchoring against 2025 realized peak — filled their calendars first. The inventory still open in late April is listed at lower rates, meaning the late-pricers are already competing on price against their own neighbors.
Destin illustrates this cleanly. The market has 4,498 active listings. Across the June 11-July 19 window, 52.1% of room-nights are already on the books at an average booked rate of $776. The roughly 3,100 room-nights still available on any given match-window night are priced at $606 — a 22% discount to what the already-filled calendar is pulling. For the typical five-condo operator in 32541, that means roughly 100 unbooked condo-nights across the 39-day window, priced below what comparable units nearby have already sold for.
Gulf Shores, Hilton Head, and Bar Harbor show the same shape. The one beach market that diverges is Myrtle Beach, where the 27.5% WC-window fill rate is well below the segment average. Myrtle Beach carries 10,007 active listings — nearly double the next-largest beach market in the sample — and the oversupply is visible in the weaker pacing. The gap between booked and available ADR is still positive at 20%, but on a much smaller absolute base ($408 booked vs $339 available), and the segment-wide takeaway is clear: supply still matters more than events.
The practical implication for beach hosts: if you are inside the 45-57% pacing band, you are running a normal summer. Hold premium anchors on the last 10 days of lead time. Discount the 30-45-day lead-time inventory by 8-12% if you are more than 3 points below your same-weeks-out 2025 number. Do not assume the World Cup changes anything — the data says it does not.
Mountain and national-park markets: summer is always thin
Mountain markets pace at 8-31% for the WC window because summer is their structural offseason — it's not a 2026 problem, it's a 2006, 2016, and 2036 problem. Park City is at 8.2%. Big Sky is at 15.7%. Broken Bow is at 22.3%. Gatlinburg — the warm-weather outlier in the segment — is at 31.3%. The national-park markets that cluster near these mountains are in the same range: Moab at 30.5%, Sedona at 16.2%.
Desert and alpine markets earn their revenue outside summer. Park City sells December through March. Moab sells March through May and September through October. Sedona peaks in April and October. The AirROI time-series shows this clearly — Moab's Memorial Day weekend (May 22-25) fill rate hits 83%, and Sedona's April week runs at 80-90% fill. But both collapse into summer: Moab drops from 83% Memorial Day to 30.5% WC window, and Sedona from 43.5% to 16.2%. That's not a demand failure. That's the calendar.
The practical trap: mountain and park hosts who benchmark against their own peak season — or against beach markets — read summer weakness as a crisis. It isn't. A Park City condo at 8.2% booked in late June is doing exactly what Park City condos have always done in late June. The segment-specific plays:
- Long-stay discounts over nightly discounts. Offer 15-20% off 7+ night reservations. Remote workers, family reunions, and pre-winter inspection visits account for most summer mountain revenue.
- Event capture over blanket rate cuts. Outdoor Retailer (Park City, June), Kimball Arts Festival (early August), and regional mountain-bike race weekends will spike 2-3 specific weekends. Price those at premium; leave the rest at base.
- Minimum-night adjustments. Most mountain markets can fill a higher share of calendar days by dropping the summer minimum from 3 nights to 2 — at the cost of some cleaning-fee amortization. Run the math for your property.
Gatlinburg sits apart from the rest of the segment because it is functionally a beach-like family-summer market without the beach. 31.3% WC-window pacing, booked ADR $560 vs available $418 (a 34% gap), and a consistent 2025 comp of ~56% summer occupancy. Gatlinburg hosts should price like Gulf Shores hosts, not like Park City hosts.
Broken Bow, Oklahoma — a lake/cabin market that has grown rapidly — paces at 22.3% with a 30% booked-vs-available gap. It's functioning like a Gatlinburg-lite: strong summer demand, but with enough supply growth in recent years that the fill rate lags traditional beach markets. Hosts there should focus on weekend-only pricing precision and resist the urge to discount the whole week.
Urban non-host markets: the halo that never arrived
The urban-halo thesis — that fans traveling to WC host cities would overflow into nearby non-host markets — is not visible in pacing data. Chicago is 500 miles from Kansas City and 600 from Philadelphia. Denver has no close WC-host city. Nashville is 550 miles from Atlanta. Austin is 200 miles from Dallas. If any of these markets were seeing a WC halo, it would show up as (a) elevated fill rates above the markets' organic summer baselines, or (b) a widening gap between booked ADR and available ADR as hosts raised rates. Neither is happening.
The segment numbers:
| Market | Active listings | June 11-July 19 fill % | Booked ADR | Available ADR | Booked-vs-available gap |
|---|---|---|---|---|---|
| Chicago, IL | 8,159 | 23.9% | $324 | $329 | -1% |
| Nashville, TN | 7,009 | 23.4% | $414 | $382 | +8% |
| Denver, CO | 5,275 | 22.6% | $222 | $232 | -4% |
| Austin, TX | 12,409 | 7.7% | $335 | $292 | +15% |
Chicago and Denver both show negative gaps: the average rate listed for remaining unbooked inventory is lower than what the already-booked calendar sold for. In pricing terminology, that is rate compression — and it means hosts are already quietly discounting to clear June-July inventory. That discounting began before April 22, because the data shows the state of things as of that date; it did not happen overnight.
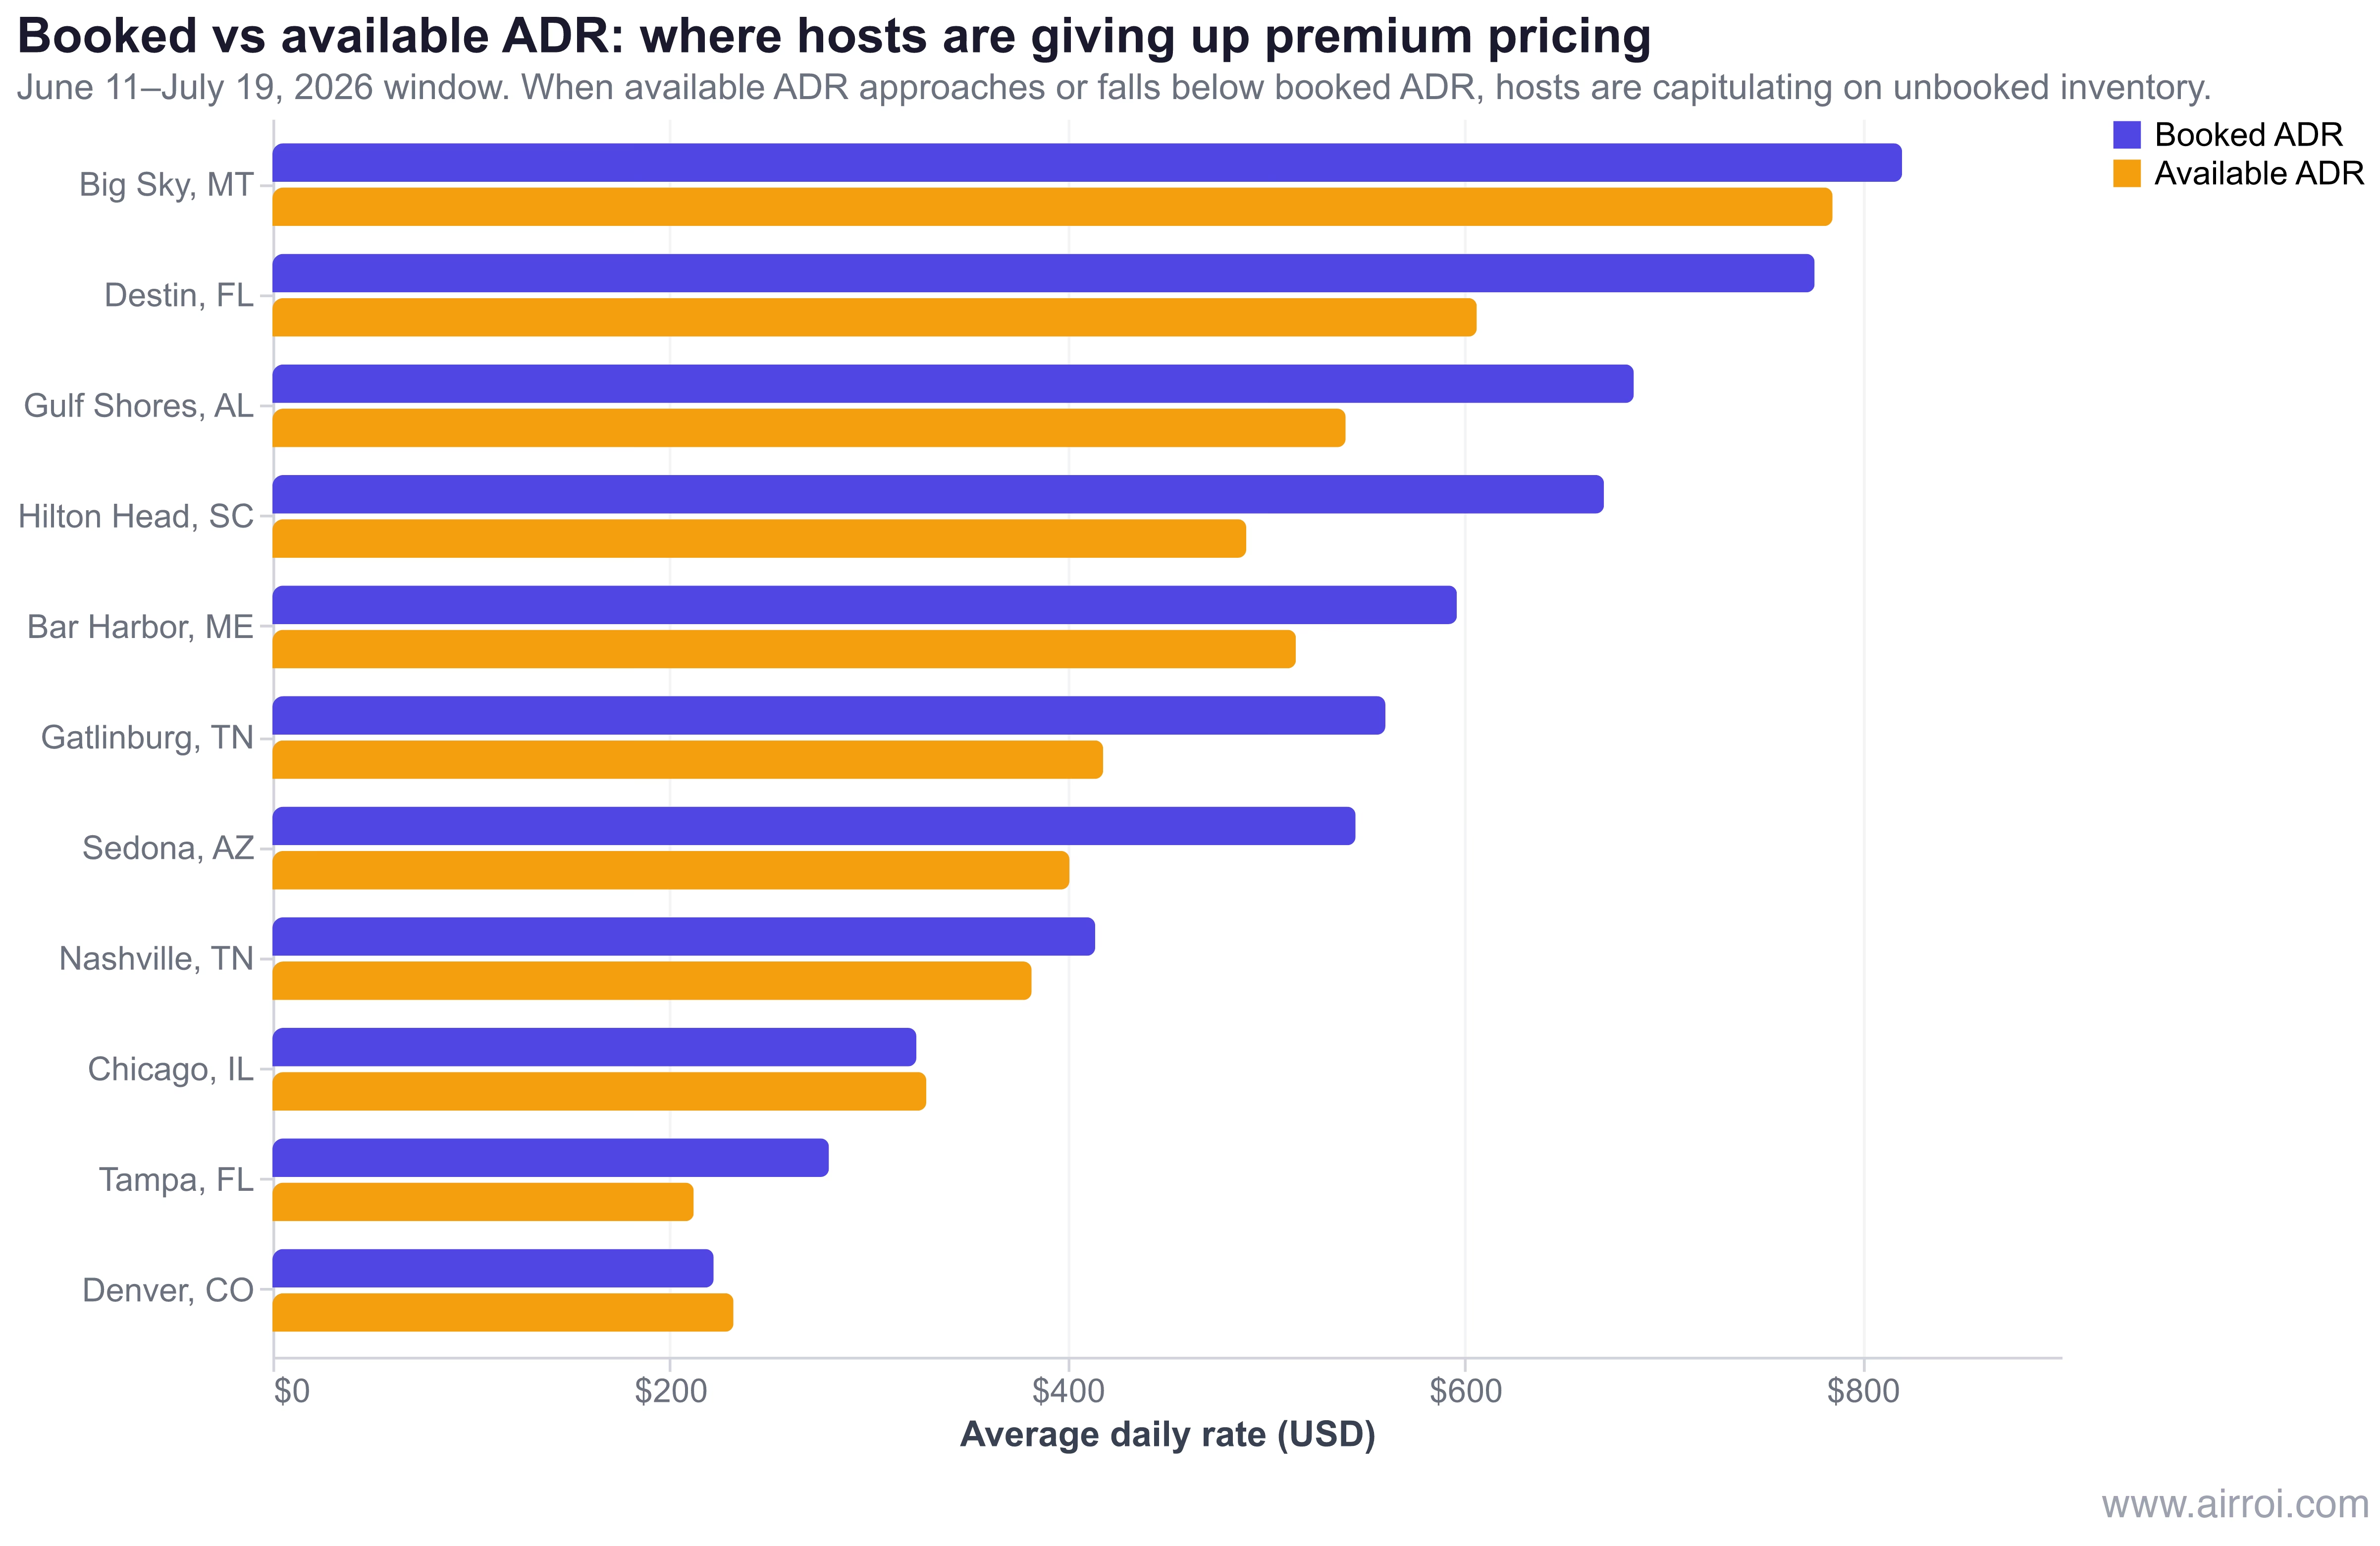
Nashville sits in a middle zone at 23.4% pacing and an 8% booked-vs-available gap. Unlike Chicago and Denver, Nashville's gap is still positive — the late-25% of inventory is not yet priced below what's already booked — but it is much tighter than the 27-37% gaps beach markets show. Nashville hosts should treat the next four weeks as the window to preserve their remaining pricing power; by mid-May, that gap will likely close to zero the same way Chicago's already has, and the opportunity to hold anchor rates will be gone.
Sun Belt markets: Tampa and Scottsdale are in summer offseason
Tampa at 6.3% and Scottsdale at 7.7% for the WC window are not pacing problems — they are calendar problems. Florida Gulf Coast summer is hot, humid, and priced for what it is. Arizona desert summer is 110°F in Scottsdale, and the snowbird population that drives the winter market has flown home. Both markets show their real season elsewhere: Scottsdale hit 25.8% over Memorial Day weekend (a pre-summer pulse) and will hit 40%+ in late October when winter bookings begin landing. Tampa runs best November through March.
The tell in the pacing data is the booked-vs-available ADR gap. Tampa shows a 32% premium on booked inventory ($280 vs $212), meaning the small cadre of hosts priced sharply for sports events, concerts, or downtown business travel are capturing the few bookings at premium rates while the rest of the market is listed cheap to attract anyone at all. Scottsdale shows a 16% gap, smaller but still indicating that the highest-priced inventory found bookings at the top, and the remaining inventory is now competing on rate.
The correct play for Sun Belt hosts is to acknowledge the offseason explicitly and optimize for it:
- Long-stay corporate and remote-worker capture. Tampa's medical-conference and cruise-terminal corporate demand is its summer base. Pricing 7+ night stays at a 15-20% discount captures that traveler and keeps the calendar generating cleaning-fee-amortized revenue.
- Winter-forward pricing discipline. The 4-6 month lead-time window for November-February is where Sun Belt summer revenue actually gets made. Hosts who cut summer rates aggressively to "chase bookings" often do so at the expense of the anchor rate the next season's dynamic pricing engine uses as a reference.
- Shoulder-season event alignment. Scottsdale Spring Training (pre-season) starts filling now for February 2027 — the booked rate on those January-February nights is already 60-80% above summer booked rates.
The quiet winner: Bar Harbor is running away with summer 2026
At 56.7% booked for the WC window and 48% filled across June-August overall, Bar Harbor, Maine is the non-WC market quietly crushing summer 2026. Acadia National Park's strict lodging cap keeps active Airbnb supply at 618 listings — a tiny number compared to any Southeast beach market. Demand growth every year has nowhere to go except into price and into earlier bookings, and that's what the pacing data captures.
The specific signal: Bar Harbor's booked ADR is $596, available ADR is $515, and the booked-vs-available gap is only 16%. That relatively narrow gap in a 57%-filled market means the remaining 43% of inventory has been priced realistically, not speculatively. Hosts who anchored high in January saw units sit; the market settled at $515 for the back-half of inventory, and that's now clearing at a healthy rate.
The other data point worth flagging: Bar Harbor's fill rate actually rises into the tournament window from Memorial Day (52.3%) to the WC window (56.7%), while every other non-WC market held flat or declined. That climb is the signature of a supply-constrained market where demand keeps filling calendar days as the window approaches.
Hosts with Bar Harbor-adjacent properties (Southwest Harbor, Boothbay Harbor, the rest of the mid-coast) should expect some spillover bookings in the final two weeks of lead time as guests find Bar Harbor booked out. Price the last week of lead time at a 10-15% premium over your current anchor, not a discount — this is the one non-WC submarket in the country where late-lead tightening is the right pricing posture.
Memorial Day tells you whether summer is building
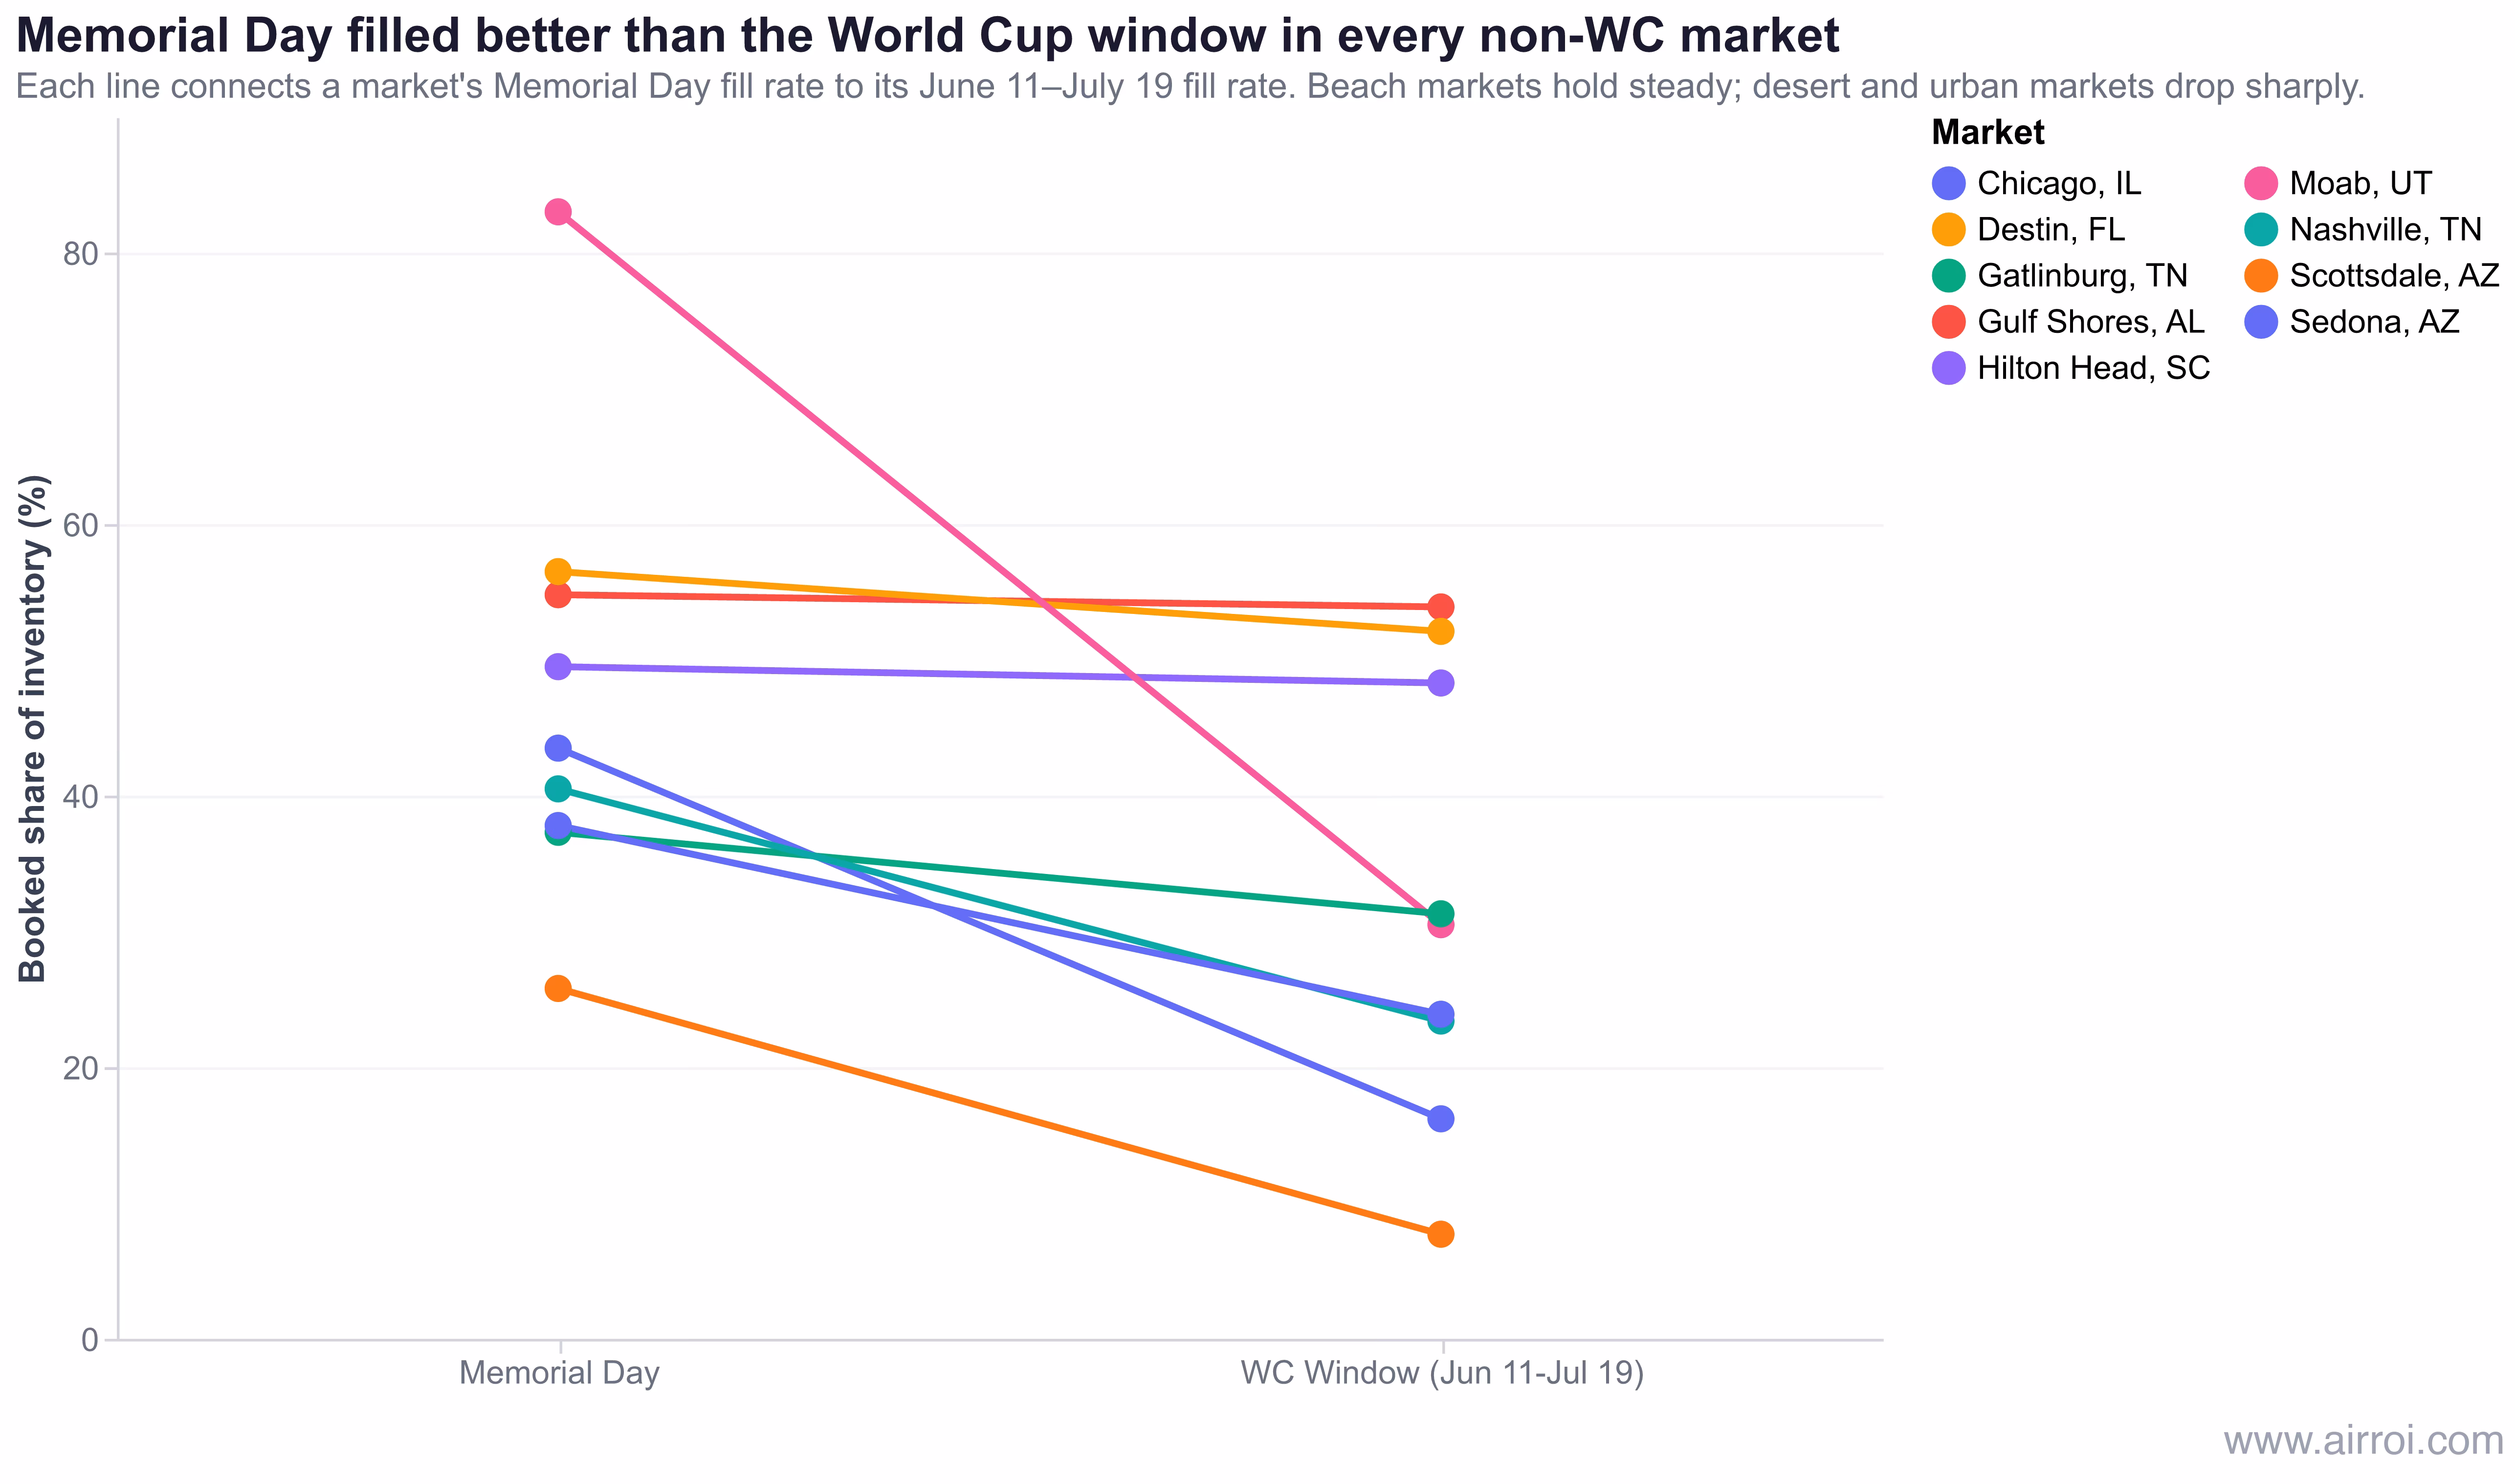
The cleanest signal in the entire AirROI dataset is the Memorial Day-to-WC-window delta. It strips out calendar-week noise and tells you whether summer is building in your market or fading. The pattern falls into three shapes:
- Flat (beach markets): Gulf Shores -0.9 pts, Destin -4.4 pts, Hilton Head -1.2 pts. Memorial Day and the WC window are pacing nearly identically. These are mature, evenly-demanded summer markets.
- Sharp drop (desert markets): Moab -52.5 pts, Sedona -27.3 pts, Scottsdale -18.1 pts. Memorial Day was near-peak; June-July is collapse into offseason.
- Normal summer decline (urban and mountain): Nashville -17.1, Chicago -13.9, Denver -8.9, Gatlinburg -6.0. Memorial Day is a strong pulse, the WC window is normal-summer baseline.
The direction of the delta tells you which pricing posture to run. Flat = hold. Sharp drop = offseason, pivot to the next season. Normal decline = your current demand, price against it. Read as a whole, the Memorial Day-to-WC-window delta is the single most useful summer 2026 airbnb pacing diagnostic in the dataset — it tells you, in one number, whether your market is building or fading.
Action framework: what to do if your market is pacing below 25%
For hosts outside the WC host cities with meaningful June-July inventory still open, the playbook reduces to a four-step decision tree. Run this for your market this week.
1. Pull your 90-day forward fill rate
2. Compare to same-weeks-out 2025
Pull the same window from 2025 at the same six-weeks-out reference date (which would have been April 29, 2025). If you are within 3 percentage points of the 2025 same-weeks-out number, you are pacing normally. If you are down 5+ points, you have a pacing problem — the kind of problem that does not fix itself by waiting.
3. Segment your remaining inventory by lead time
4. Price the brackets differently
For markets pacing below 25% with a 0-3 point 2025 delta (normal summer, weak market): hold 0-14 day rates flat, discount 15-45 day rates by 5-10%, discount 46+ day rates by 10-15%. This captures late bookers at normal margin while clearing the long-lead calendar that would otherwise sit empty.
For markets pacing 5+ points below 2025 same-weeks-out (genuine softness, like Austin or Tampa): apply the discount bracket more aggressively. 0-14 flat, 15-45 down 10%, 46+ down 15-20%. The opportunity cost of sitting is higher than the dollar loss from the discount.
For markets in structural offseason (Scottsdale, Park City, Sedona): don't discount the nightly rate. Instead, introduce or increase length-of-stay discounts for 7+ night reservations. This preserves your nightly rate anchor for the next peak season while capturing the traveler profile that actually books in summer.
The summer 2026 playbook, by segment
Summer 2026 airbnb pacing is not a monolithic event-driven story. It is bifurcated along the 11-city World Cup line, and then bifurcated again within the non-WC universe by market type. The correct host response depends on which segment your market is in:
- Beach markets: run them normally. 45-57% fill at six weeks out is on pace. Hold your anchor, discount only long-lead inventory if you're off your 2025 comp.
- Mountain and national-park markets: recognize summer is always thin. Shift to long-stay discounts and event-weekend pricing precision. Do not benchmark against beach markets.
- Urban non-host markets: abandon any WC-halo premium posture. Price for real demand, and watch the booked-vs-available gap — if it compresses to zero or negative, you're already late to discount.
- Sun Belt markets: acknowledge the offseason. Protect your winter anchor rate. Don't chase summer bookings at the expense of next season's dynamic-pricing reference.
- The one universal action: stop waiting for a tournament lift that is not arriving in your market. Six weeks from now, the calendar is fixed. Decisions made this week determine what your June-July looks like.
Frequently Asked Questions
Only hosts in the 11 US host cities see a meaningful tournament lift. AirROI future-pacing data across 17 non-host markets shows median WC-window fill rates of 19.4% in urban non-host metros, 18.4% in mountain markets, and 7.0% in Sun Belt cities — all well below what tournament-driven demand would produce. CoStar and Tourism Economics project non-WC US markets will contribute just 0.2% RevPAR growth in 2026 once the World Cup effect is stripped out.
Beach markets lead by a wide margin. Bar Harbor, Maine paces at 56.7% booked for the June 11-July 19 window. Gulf Shores, Alabama at 53.9%. Destin, Florida at 52.1%. Hilton Head Island at 48.3%. These four beach markets average 48.7% filled six weeks out, roughly matching their 2025 summer pacing at the same reference point.
Sun Belt urban markets and summer-offseason resorts are pacing weakest. Tampa sits at 6.3%, Scottsdale at 7.7%, Austin at 7.7%, and Park City at 8.2% for the WC window. For Park City and Scottsdale, summer is their structural offseason, so the number isn't an anomaly. For Tampa and Austin, sub-10% pacing signals genuine demand softness that hosts should price for now rather than wait out.
It tells you who got priced right and who didn't. In beach markets, booked ADR sits 20-37% above available ADR — meaning the premium inventory filled first and the remaining rooms are now listed cheaper. In urban markets like Chicago and Denver, the gap is zero or negative — hosts are now listing unbooked rooms below what already-booked rooms paid, a textbook capitulation-pricing signal.
For markets pacing below 25% with six weeks until the window opens, the probability of clearing inventory at posted rates drops sharply every week. AirROI lead-time data shows most summer bookings in non-resort markets land within 30 days of arrival, not 90. Hosts with substantial June-July inventory unbooked should hold a premium anchor price on the last 7-10 days of lead time and discount the 30-45 day lead-time window now by 8-15%.