
Pro Forma
Key Takeaways
- A pro forma projects gross revenue, operating expenses, NOI, debt service, and return metrics for a potential STR investment before purchase
- Accuracy depends on sourcing revenue assumptions from verified comparable-listing data — not seller claims or broad averages
- Always build three scenarios (conservative, moderate, optimistic) to understand the realistic range of outcomes, not a single point estimate
- Key outputs include cap rate, cash-on-cash return, DSCR, and break-even occupancy — each serves a different analytical purpose
- The revenue line is the highest-leverage assumption; validate it with actual STR performance data for 10+ comparable listings in the same market
How to Build an STR Pro Forma
A rigorous STR pro forma has four sections: acquisition costs, revenue projection, operating expenses, and return metrics. Each section feeds the next.
Section 1: Acquisition and Setup Costs
| Item | Amount |
|---|---|
| Purchase price | $475,000 |
| Closing costs (3%) | $14,250 |
| Renovation / repairs | $15,000 |
| Furnishing and setup | $25,000 |
| Total investment | $529,250 |
| Down payment (20%) | $95,000 |
| Cash to close (down payment + closing costs + setup) | $149,250 |
| Loan amount | $380,000 |
Section 2: Revenue Projection
Model revenue by season rather than as a single annual average — the difference can swing projected income by 20–35%.
| Season | Days | Avg Nightly Rate | Occupancy | Revenue |
|---|---|---|---|---|
| Peak (Jun–Aug) | 92 | $265 | 82% | $19,987 |
| Shoulder (Mar–May, Sep–Nov) | 183 | $195 | 68% | $24,271 |
| Off-season (Dec–Feb) | 90 | $145 | 48% | $6,264 |
| Annual nightly revenue | 365 | $50,522 | ||
| Cleaning fee income (avg 8 bookings/month) | $7,200 | |||
| Total gross revenue | $57,722 |
Section 3: Operating Expenses
| Expense | Annual Cost | % of Gross Revenue |
|---|---|---|
| Property management (20%) | $11,544 | 20.0% |
| Cleaning costs | $7,680 | 13.3% |
| Platform fees (3%) | $1,732 | 3.0% |
| Property taxes | $5,200 | 9.0% |
| Insurance | $2,400 | 4.2% |
| Utilities | $4,200 | 7.3% |
| Maintenance reserve (8%) | $4,618 | 8.0% |
| Supplies | $1,800 | 3.1% |
| WiFi / streaming | $1,440 | 2.5% |
| Landscaping | $1,200 | 2.1% |
| Total operating expenses | $41,814 | 72.4% |
Section 4: Key Return Metrics
| Metric | Value | Formula |
|---|---|---|
| Net operating income (NOI) | $15,908 | Revenue − Operating Expenses |
| Annual mortgage (P&I) | $28,800 | $2,400 / month × 12 |
| Annual cash flow | −$12,892 | NOI − Debt Service |
| Cap rate | 3.4% | NOI ÷ Purchase Price |
| Cash-on-cash return | −8.6% | Cash Flow ÷ Cash Invested |
| DSCR | 0.55 | NOI ÷ Annual Debt Service |
| Break-even occupancy | 91% | Total Annual Costs ÷ (Rate × 365) |
Verdict on this example: The property does not pencil at these assumptions. A DSCR of 0.55 is well below the 1.25 threshold most lenders require, and negative cash flow at 68% shoulder occupancy is unsustainable. The investor should negotiate a lower purchase price, plan to self-manage (eliminating the 20% management fee), or pass.
Real Revenue Inputs: What the Market Actually Produces
Reliable pro formas start with reliable revenue assumptions. AirROI's trailing-12-month data across 35,301 active listings in six US markets reveals the range of gross revenue a well-run STR can realistically generate:
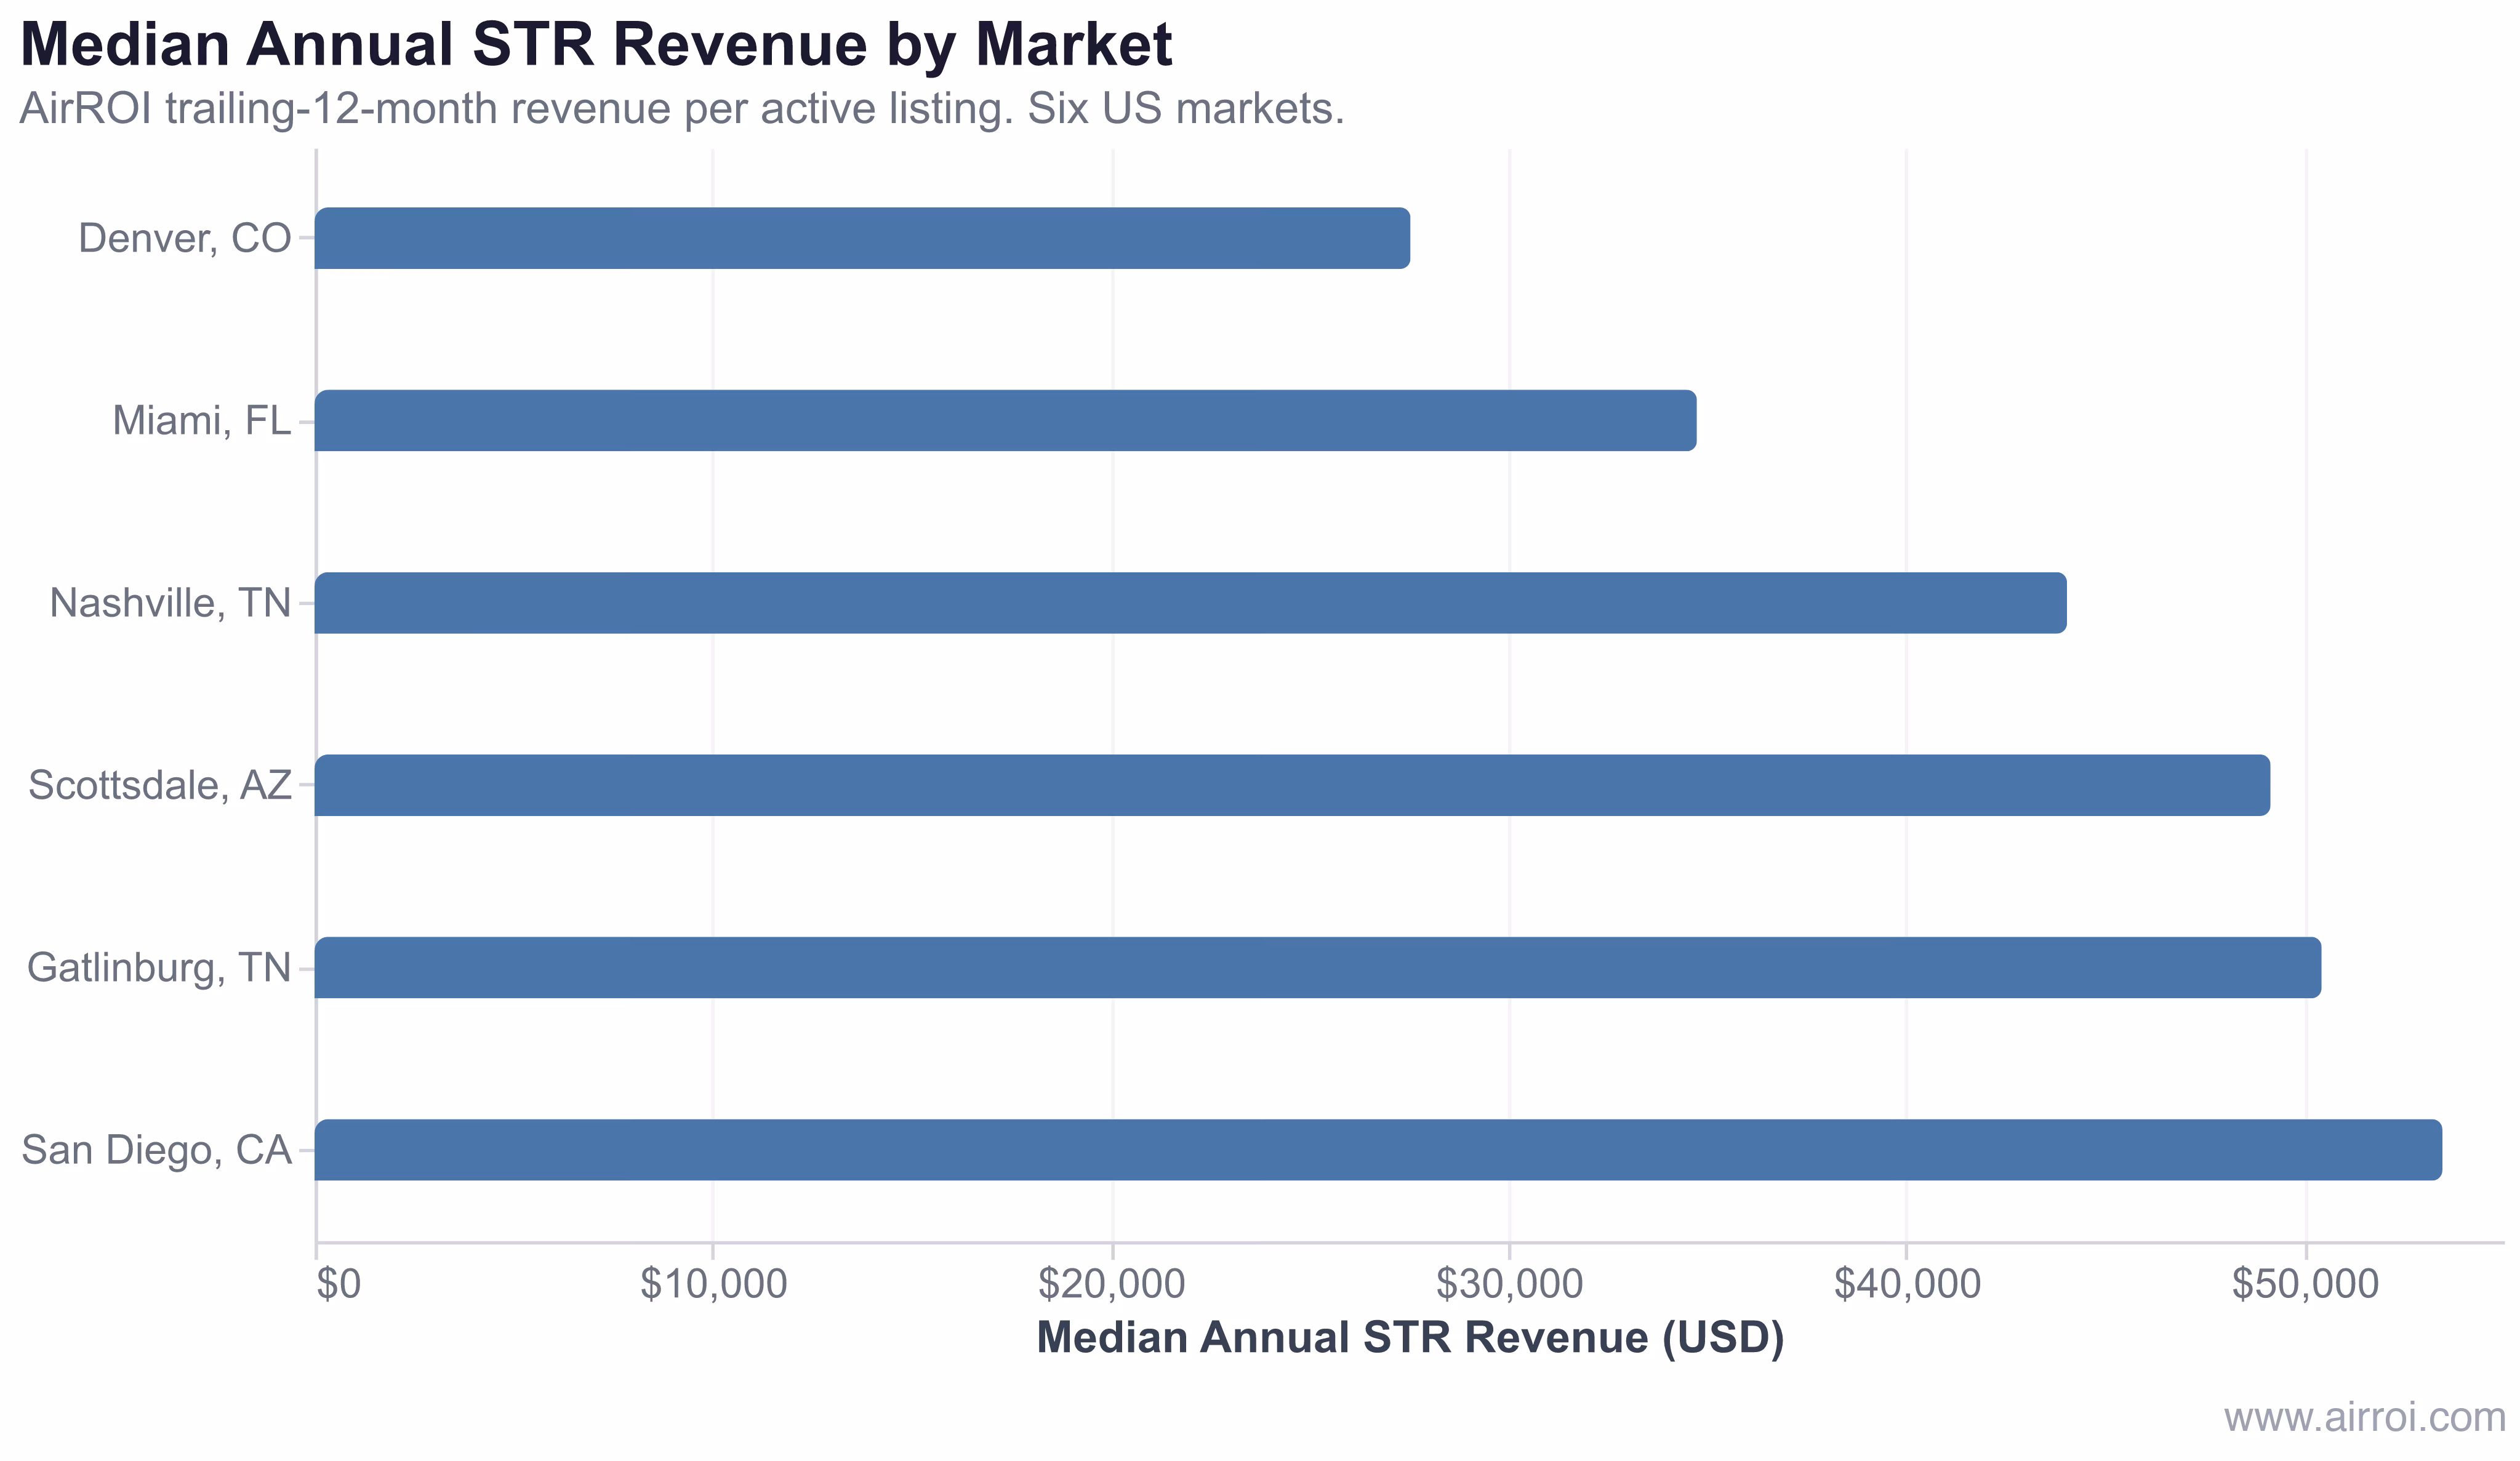
In AirROI's analysis of 35,301 active listings across San Diego, Scottsdale, Gatlinburg, Nashville, Miami, and Denver, median annual revenue ranges from $27,540 in Denver to $53,472 in San Diego. The spread — nearly 2× between the lowest and highest market — is the single most important reason to anchor pro forma revenue assumptions in local, verified data rather than national averages.
The revenue line is where bad investments hide. Most sellers optimize their pitch by selecting the best 3 months and extrapolating; a real pro forma models each season separately using the same data a competing buyer would pull.
Common Pro Forma Mistakes
| Mistake | Impact | Correction |
|---|---|---|
| Using peak-season rates year-round | Overestimates revenue 20–40% | Model each season separately |
| Omitting expense categories | Understates costs 10–20% | Use a comprehensive expense checklist |
| Ignoring platform fees (3–5%) | Missing $1,500–$3,000 annually | Include Airbnb and channel fees explicitly |
| No maintenance reserve | Unprepared for major repairs | Budget 5–10% of gross revenue |
| Accepting seller's revenue claims | Often cherry-picked or inflated | Verify with independent comparable data |
| Single-scenario analysis | False confidence in one outcome | Always run conservative / moderate / optimistic |
Why Pro Formas Matter Beyond the Purchase Decision
Building Reliable Revenue Assumptions
- Pull 10+ comparable listings: Filter by bedroom count, property type, and proximity in your target market. Median performance across 10+ comps is a defensible revenue assumption.
- Adjust for your listing quality: A property with above-median amenities and a professional listing earns above-median ADR. A bare-bones listing competes on price alone.
- Account for ramp-up: New listings typically underperform comps by 15–25% in months 1–3 as they accumulate reviews and search ranking. Build this lag into your first-year projection.
- Project 5 years forward: A multi-year model that accounts for 2–4% annual revenue growth and 2–3% expense inflation reveals whether a marginal deal improves over time or deteriorates.
- Stress-test the key drivers: Occupancy and nightly rate are the highest-leverage inputs. Run scenarios where each drops 10 percentage points independently to see which risk matters more for this specific property.
Frequently Asked Questions
A comprehensive STR pro forma must cover projected gross revenue (nightly rate × occupancy × 365), all operating expense categories, mortgage debt service, net operating income, annual cash flow, cap rate, cash-on-cash return, DSCR, and break-even occupancy. It should also account for total acquisition costs — purchase price, closing costs, renovation, and furnishing — plus sensitivity scenarios at conservative, moderate, and optimistic occupancy levels.
Pro forma accuracy depends entirely on input quality. Projections built on verified comparable-listing data are typically within 10–15% of actual results; those based on seller claims or broad market averages can miss by 30–50%. The most common errors are overestimating occupancy, omitting expense categories, and ignoring seasonality. Always stress-test with at least three scenarios to understand the full range of outcomes.
Treat seller and agent pro formas as a starting point, never as gospel. They frequently overestimate revenue using peak-season rates year-round, underestimate expenses by omitting platform fees and maintenance reserves, and rely on unrealistic occupancy assumptions. Always rebuild the model using independent market data, verified comparable listings, and your own expense research before committing capital.
Use market-median occupancy from a data source rather than guessing. AirROI data across six major US markets shows medians ranging from 42% (Las Vegas) to 55% (San Francisco), with most markets clustering between 47–54%. Build your conservative scenario at 5–8 percentage points below the market median to stress-test downside risk.