Airbnb market data · 202612 months to September 2026
Bongaree, QLD Airbnb Market Data: Revenue, Occupancy & Trends
The average Airbnb in Bongaree brought in A$24,443 over the 12 months through September 2026, across just 24 active listings, so a single property can move that figure.
The short answer
Bongaree Airbnb Market at a Glance
Bookings in Bongaree trail the Queensland average, at prices about 5% lower. Listings averaged A$365 a night and were booked on 34% of available nights, against A$385 and 46% for the Queensland average.
Timing matters: in December, the best month, the average listing earned about 2.3 times as much as in June, the slowest. With only 24 active listings, a few bookings can reorder the months.
With 24 active listings, Bongaree is the 111th-largest of 134 Queensland markets AirROI tracks.
 Browse the live Bongaree Airbnb market See Every Bongaree Listing
Revenue
How Much Do Airbnb Hosts Make in Bongaree?
Gross bookings per Bongaree listing averaged A$24,443 over the 12 months to September 2026 (Queensland average: A$48,565), before cleaning, platform and management costs and taxes.
The average Bongaree listing brought in A$5,150 in December, its best month, and A$2,220 in June, its slowest. The three strongest months bring in 34% of a full year's revenue, where an even calendar would give any three months 25%.
Across Bongaree's 24 active listings, monthly revenue by tier:
- Best-in-class properties (top 10%) earn A$6,950+ a month, about 2.2 times the typical property.
- Strong performers (top 25%) earn A$4,680 or more, roughly A$1,500 a month above the median.
- Typical properties (median) earn about A$3,150 a month.
- Entry-level properties (bottom 25%) earn A$1,970 or less, about 62% of the median.
These are monthly figures for listings active in each month. The annual average above also counts listings that operated for only part of the year, so it runs below twelve times these figures.
December earned about 2.3 times what June did
Average revenue per active listing, by month, September 2025 to August 2026
The dashed line is the average of the months shown, A$3,580.
Bongaree Airbnb Data by Month
Latest 12 months in the September 2026 data. September's figures are still coming in, so the rows run to August.
December 2025 led on revenue and nightly rate; bookings peaked in October 2025.
| Month | Avg. Revenue | Occupancy | Avg. Nightly Rate | RevPAR | Booking Lead Time | Avg. Length of Stay |
|---|---|---|---|---|---|---|
| Sep 2025 | A$3,664 | 38.3% | A$358 | A$122 | 38 days | 4.3 nights |
| Oct 2025 | A$4,793 | 50.7% | A$366 | A$155 | 68 days | 3.6 nights |
| Nov 2025 | A$4,065 | 43.7% | A$361 | A$136 | 75 days | 2.9 nights |
| Dec 2025 | A$5,146 | 45.8% | A$382 | A$166 | 36 days | 5.5 nights |
| Jan 2026 | A$3,562 | 33.5% | A$374 | A$115 | 38 days | 3.7 nights |
| Feb 2026 | A$2,665 | 31.6% | A$340 | A$95 | 27 days | 3.4 nights |
| Mar 2026 | A$2,872 | 30.4% | A$352 | A$93 | 47 days | 3.6 nights |
| Apr 2026 | A$4,264 | 36.7% | A$356 | A$142 | 42 days | 4.4 nights |
| May 2026 | A$2,458 | 28.4% | A$359 | A$79 | 55 days | 2.4 nights |
| Jun 2026 | A$2,215 | 22.9% | A$359 | A$74 | 32 days | 3.2 nights |
| Jul 2026 | A$4,584 | 43.7% | A$380 | A$148 | 51 days | 4.2 nights |
| Aug 2026 | A$2,721 | 35.9% | A$352 | A$88 | 61 days | 5.1 nights |
Averages per active listing in each month. Highlighted: the highest-revenue month of the 12. RevPAR is the month's revenue spread over its nights, booked or not. Booking lead time is the days between booking and check-in, and length of stay the nights per booking, for stays in that month.
For a figure on one home rather than the whole Bongaree market, enter its address and size in the Airbnb profit calculator, which compares it with similar listings nearby.
Profit
Is an Airbnb in Bongaree Profitable?
Yes, when it's run well. The average Bongaree Airbnb took in A$24,443 in the 12 months to September 2026, and run by its owner at everyday costs, about A$1,260 a month of that is left after running costs, so a home that costs less than that to own or rent makes money. A listing in the top quarter leaves about A$1,890 a month.
Cleaning it yourself keeps the A$3,620 a year guests pay in cleaning fees, for about A$1,560 a month. Handing the listing to a co-host at about 10% of nightly bookings still leaves about A$1,090 a month.
These amounts come before housing costs. Where the mortgage or rent is less each month, the difference is profit; a home owned outright keeps it all after property tax, home insurance and any building or condo fees.
Bongaree Airbnb Income, Expenses and Profit per Year
| Line | Average listing | Top-quarter listing |
|---|---|---|
| Money in | ||
| Nightly bookings | A$20,823 | A$30,930 |
| Cleaning fees guests pay15% of Bongaree bookings | A$3,620 | A$5,380 |
| Gross bookings | A$24,443 | A$36,310 |
| Running costs | ||
| Airbnb's feeAbout 12%: 15.5% for the 71% of Bongaree listings on Simplified Pricing, 3% for the rest | −A$2,900 | −A$4,300 |
| Cleaning and laundryPaid for by the cleaning fee; A$0 if you clean yourself | −A$3,620 | −A$5,380 |
| Utilities and internetAbout 5% of bookings | −A$1,220 | −A$1,820 |
| Guest suppliesToiletries, coffee, paper goods: about 2% | −A$490 | −A$730 |
| Repairs and upkeepIncluding linens and small replacements: about 3% | −A$730 | −A$1,090 |
| Short-term rental insuranceOne policy, on top of Airbnb's free AirCover | −A$240 | −A$240 |
| Permit and registrationWhere one is required | −A$120 | −A$120 |
| ManagementA$0 when you run it; co-hosts charge from about 10% of nightly bookings | A$0 | A$0 |
| Pricing and messaging toolsOptional; Airbnb's own tools are free | A$0 | A$0 |
| Lodging taxesAdded to the guest's bill and passed on | A$0 | A$0 |
| Total running costsAbout 23% of bookings, plus cleaning paid for by the cleaning fee | −A$9,320 | −A$13,680 |
| Left for housing costs, then profit | A$15,123about A$1,260 a month | A$22,630about A$1,890 a month |
| Housing costs | ||
| Mortgage or rent, property tax, home insurance, building or condo fees | Depend on the home | |
Estimate Your Own Bongaree Airbnb Profit
The estimate starts from Bongaree's average listing, run by its owner. Change how the listing performs, who runs it and who cleans to see what is left for the mortgage or rent.
To work out the profit on one Bongaree home, with its price, its mortgage or rent and your own costs, use the Airbnb income calculator. It starts from the comparable listings around the address.
How Bongaree's Top Earners Get There
- More nights booked. The busiest quarter of Bongaree listings are booked on 47% or more of their nights, against 33% for the median listing. Ten more booked nights a year at the median rate of A$305 adds about A$3,040 in bookings.
- Prices that follow demand. Ranked by price, the top quarter charge A$450 a night or more, against a median of A$305. That is a separate ranking from the busiest quarter, so the two marks don't multiply into one listing's takings. For the average listing, a 10% higher rate on the nights it already books adds about A$2,080 a year.
- Open for the busy months. December brought the average listing about A$5,150, against A$2,220 in June, so a calendar that is open and full in the busy months carries the year.
- Reviews that stand out. Bongaree listings average 4.89 stars, and 46% carry Airbnb's Guest Favorite badge, which guests can filter for.
What a listing keeps comes down to the figures this page measures: nightly rate, nights booked and the months it's open. A listing at the top-quarter mark takes in about A$3,030 a month, against A$2,040 for the average one.
Occupancy
What Is the Airbnb Occupancy Rate in Bongaree?
Bongaree listings were booked on 34% of the nights they were open over the past year, 12 percentage points below the Queensland average (46%) and 9 points below the Australia average (43%). Occupancy swings from 23% in June to 51% in October.
Across Bongaree's 24 active listings, the share of open nights booked by tier:
- Best-in-class properties (top 10%) are booked 71%+ of open nights, 38 points above the median.
- Strong performers (top 25%) fill 47% or more, roughly three nights a week.
- Typical properties (median) fill about 33% of open nights.
- Entry-level properties (bottom 25%) fill 16% or less, under two nights a week.
October was the busiest month in Bongaree, June the quietest
Share of open nights booked, by month, September 2025 to August 2026
The 12-month rate of 34% averages each listing's whole year, slow months included; each month here counts only the listings booked in it.
Nightly rates
How Much Does an Airbnb Cost per Night in Bongaree?
The average nightly rate in Bongaree, known as ADR (average daily rate), was A$365 over the past year, about 5% below the Queensland and Australia averages (both about A$385). Rates peak in July and December at about A$380 and bottom out in February at about A$340.
Across Bongaree's 24 active listings, nightly rates by tier:
- Best-in-class properties (top 10%) charge A$595+ a night, about twice the median.
- Strong performers (top 25%) charge A$450 or more, about A$150 above the median.
- Typical properties (median) charge about A$305 a night.
- Entry-level properties (bottom 25%) charge A$225 or less, about three-quarters of the median.
December rates ran 12% above February's
Average nightly rate (ADR), by month, September 2025 to August 2026
The dashed line is the average of the months shown, A$362.
What Is the RevPAR for Airbnb in Bongaree?
RevPAR, or revenue per available night, divides a listing's income by every night it was open to book, so it rises with both price and bookings. In Bongaree it averaged A$118 over the past year, from about A$74 in June to about A$166 in December.
Across Bongaree's 24 active listings, RevPAR by tier:
- Best-in-class properties (top 10%) earn A$175+ per open night, about 1.5 times the median.
- Strong performers (top 25%) earn A$141 or more, about A$25 a night above the median.
- Typical properties (median) earn about A$114 per open night.
- Entry-level properties (bottom 25%) earn A$85 or less, about three-quarters of the median.
December RevPAR was about 2.2 times June's
Revenue per open night (RevPAR), by month, September 2025 to August 2026
The dashed line is the average of the months shown, A$118.
Seasonality
Best and Worst Months for Airbnb in Bongaree
With only 24 active listings, the monthly pattern in Bongaree is noisy, since a few long or pricey stays can lift a month; revenue peaked in December and bottomed out in June.
How Far in Advance Do Guests Book Airbnb in Bongaree?
Guests book Bongaree stays 49 days ahead on average (about seven weeks). November stays are booked furthest out, about 75 days ahead, and February stays closest to arrival, about 27 days. A typical November booking is made in early September.
November stays are booked furthest ahead
Average days between booking and check-in, by month of stay, September 2025 to August 2026
Permits
Airbnb Permits and Registration in Bongaree
None of the 24 active listings in Bongaree display a registration, permit or license number. That doesn't mean no rules apply: some places don't ask hosts to show a number on the listing, and listing data doesn't capture every scheme.
Registration, permit, zoning and tourist-tax rules vary by address and change often, so confirm them with the local authority before buying or listing in Bongaree.
Neighborhoods
Best Neighborhoods for Airbnb in Bongaree
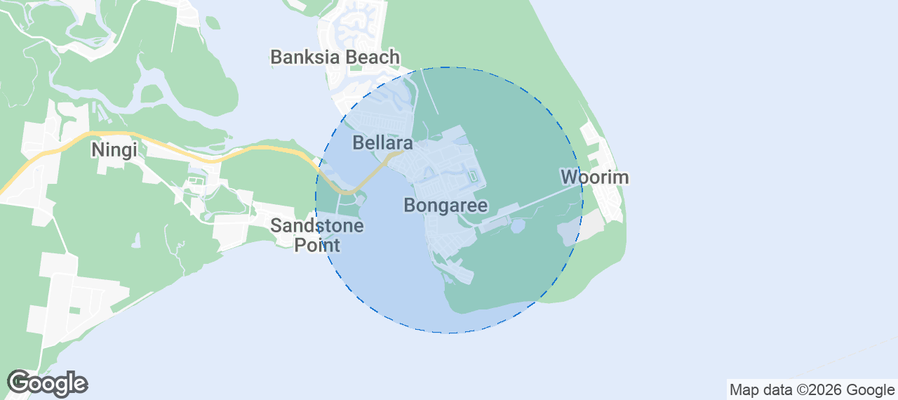
AirROI's area guide picks eight Bongaree neighborhoods that draw short-term rental guests, led by Bongaree Beach, Red Beach and Woorim. The picks reflect guest appeal, not earnings data or permit eligibility, so check local permit rules for a specific address before buying.
| Area | Who it suits | Landmarks nearby |
|---|---|---|
| Bongaree Beach | Beautiful sandy beach known for its family-friendly atmosphere and calm waters. An ideal location for tourists looking to relax by the shore or engage in water activities. | Bongaree Jetty, Bribie Island National Park, Bongaree Beach Foreshore, Settlers Park, Bribie Island Seaside Museum |
| Red Beach | Secluded and peaceful beach perfect for families and those looking for a tranquil getaway. Red Beach is less crowded than other nearby beaches, making it a favorite among locals. | Red Beach, Ningi Creek, Bribie Island, Wildlife viewing, Nature walks |
| Woorim | Known for its surf beach, Woorim attracts a younger crowd and surfers looking for waves. The area also offers great walking and cycling paths along the beach. | Woorim Beach, Bribie Island Surf Life Saving Club, Woorim Park, Cycling paths, Fishing spots |
| Bribie Island | Offers a laid-back lifestyle with a variety of outdoor activities. A perfect spot for nature lovers and those who appreciate coastal living. | Bribie Island National Park, Pumicestone Passage, Nature reserves, Bird watching, Fishing and boating spots |
| Bongaree Foreshore | A lovely waterfront area great for picnics, walking, and enjoying the view of Moreton Bay. Suitable for families and groups looking for leisure activities. | Bongaree Foreshore Park, Waterfront dining, Playgrounds, Picnic areas, Walking paths |
| Bribie Island Golf Club | A popular destination for golf enthusiasts, offering a well-maintained course and great facilities. Attracts both serious golfers and casual players looking to enjoy the sport. | Golf course, Clubhouse, Events and tournaments, Dining facilities, Pro shop |
| Bribie Island Markets | A vibrant market scene that draws both locals and tourists looking for unique crafts, food, and entertainment. The markets provide a great way to experience local culture. | Local artisan stalls, Food vendors, Live entertainment, Community events, Craft goods |
| Sandstone Point | Conveniently located near Bongaree, Sandstone Point is known for its beautiful waterfront and nearby resort-style accommodations. It's popular for events and gatherings. | Sandstone Point Hotel, Waterfront dining, Events and festivals, Picnic spots, Fishing areas |
Area descriptions are AI-assisted from public sources and are not checked against zoning.
Nearby markets
Bongaree vs. Nearby Airbnb Markets
Of the eight nearby markets in the table, all within 44 km, Greater Brisbane (41 km away) earned the most per listing, about 74% more than Bongaree. Hamilton was the busiest, booked on 55% of nights against 34% in Bongaree.
| Market | Listings | Avg. annual revenue | Avg. nightly rate | Occupancy |
|---|---|---|---|---|
| Golden Beach 29 km | 33 | A$32,911 | A$344 | 44% |
| Caloundra 30 km | 72 | A$22,111 | A$306 | 34% |
| Kings Beach 31 km | 73 | A$24,659 | A$350 | 36% |
| Hamilton 41 km | 40 | A$34,028 | A$284 | 55% |
| Greater Brisbane 41 km | 4,480 | A$42,505 | A$331 | 47% |
| Buddina 42 km | 31 | A$42,252 | A$369 | 46% |
| Fortitude Valley 44 km | 151 | A$39,238 | A$284 | 52% |
| Mooloolaba 44 km | 104 | A$39,955 | A$404 | 42% |
Other Airbnb Markets in Queensland
- Gold Coast City Airbnb data 4,348 listings
- Sunshine Coast Regional Airbnb data 2,836 listings
- Noosa Heads Airbnb data 1,028 listings
- Cairns Airbnb data 843 listings
- Surfers Paradise Airbnb data 735 listings
- Port Douglas Airbnb data 668 listings
- Airlie Beach Airbnb data 407 listings
- Whitsunday Regional Airbnb data 397 listings
See all 134 Queensland Airbnb markets
Markets Similar to Bongaree
Markets elsewhere in Australia with a similar nightly rate and occupancy to Bongaree:
- Mid-Coast Council Airbnb data NSW · A$367/night · 34.2%
- Bermagui Airbnb data NSW · A$361/night · 32.8%
- Narooma Airbnb data NSW · A$345/night · 34.0%
- Eurobodalla Shire Council Airbnb data NSW · A$391/night · 34.3%
- Lakes Entrance Airbnb data VIC · A$335/night · 33.8%
- Apollo Bay Airbnb data VIC · A$393/night · 34.7%
FAQ
Bongaree Airbnb FAQ
How much do Airbnb hosts make in Bongaree?
An active Bongaree Airbnb grossed A$24,443 on average in the 12 months to September 2026, according to AirROI's tracking of 24 active listings. That is before cleaning, management, taxes and financing. Busier, better-run listings do far better: the top quarter took in A$4,680 or more in a typical month.
How much can I make on Airbnb in Bongaree?
It depends most on the home's size, location and how it's run. The middle half of Bongaree listings earn between A$1,970 and A$4,680 in a typical month, and the top tenth A$6,950 or more. For one home, enter its address and bedroom count in the Airbnb calculator: it compares the home with similar listings nearby.
What is the average Airbnb occupancy rate in Bongaree?
Listings in Bongaree were booked on 34% of available nights over the past year. That compares with 46% for the Queensland average. October was the busiest month.
How much does an Airbnb cost per night in Bongaree?
The average booked night in Bongaree cost A$365 before fees. Half of listings charge between A$225 and A$450, so bedroom count and location move the price more than the average suggests.
Do you need a permit for an Airbnb in Bongaree?
None of the active Bongaree listings display a registration, permit or license number. That doesn't mean no rules apply, so confirm registration, permit and tourist-tax rules with the local authority before buying.
Is Airbnb profitable in Bongaree?
Yes, when it's run well. The average Bongaree Airbnb grossed A$24,443 in the 12 months to September 2026, 50% below the Queensland average of A$48,565, though with only 24 active listings a single property can move that figure. Run by its owner, with the cleaning fee covering the cleaner and everyday costs for Airbnb's fee, utilities, supplies, upkeep and insurance, A$15,123 a year (about A$1,260 a month) is left before the mortgage or rent. A home that costs less than that to own or rent makes a profit, and a listing at the top-quarter mark leaves about A$1,890 a month. Check a specific home in the Airbnb estimator.
When is Airbnb peak season in Bongaree?
December paid best over the past year, at A$5,150 per active listing, and June paid least. The month-by-month table above shows how rates and bookings each move.
What is the Airbnb RevPAR in Bongaree?
Each night a Bongaree listing was open to book earned A$118 on average over the past year, booked or not. That figure, revenue per available night (RevPAR), folds price and occupancy into one number; the top 10% of listings made A$175 or more.
How far in advance do guests book Airbnbs in Bongaree?
Bongaree stays were booked 49 days (about seven weeks) before arrival on average over the past year, so most of a month is booked well before it starts.
How long do guests stay at Airbnbs in Bongaree?
The average Bongaree Airbnb stay lasted 4.6 nights over the past year. A listing took 18 reservations over the year on average.
How are Airbnbs in Bongaree rated?
Guests rate Bongaree Airbnbs 4.89 out of 5 on average. Guests score location highest and value lowest.
What are the best neighborhoods for Airbnb in Bongaree?
Bongaree Beach, Red Beach and Woorim draw the most short-term rental interest in Bongaree. The neighborhood guide explains what brings guests to each.
How many Airbnbs are there in Bongaree?
AirROI counted 24 active Airbnb listings in Bongaree as of September 2026. The closest tracked market is Golden Beach, 29 km away.
How much are Airbnb cleaning fees in Bongaree?
In Bongaree, more than eight in ten listings add a cleaning fee. The median fee is A$212, and some higher fees lift the average to A$342.
Method
About This Data
Figures on this page cover 24 active Airbnb listings in Bongaree from October 2025 to September 2026 (trailing twelve months). AirROI refreshes them monthly from listing-level booking and calendar data covering 20+ million properties worldwide. AirROI measures bookings in US dollars; this page shows them in Australian dollars at A$1.44 per US$, the typical rate from October 2025 to September 2026. Annual revenue averages every listing active during the period, including those listed for only part of it; monthly figures average the listings active in each month; the tier lists show the spread. Neighborhood descriptions are AI-assisted. See the methodology for definitions.
Need this programmatically? The same metrics are available through the AirROI Airbnb Data API and bulk downloads in the data portal.