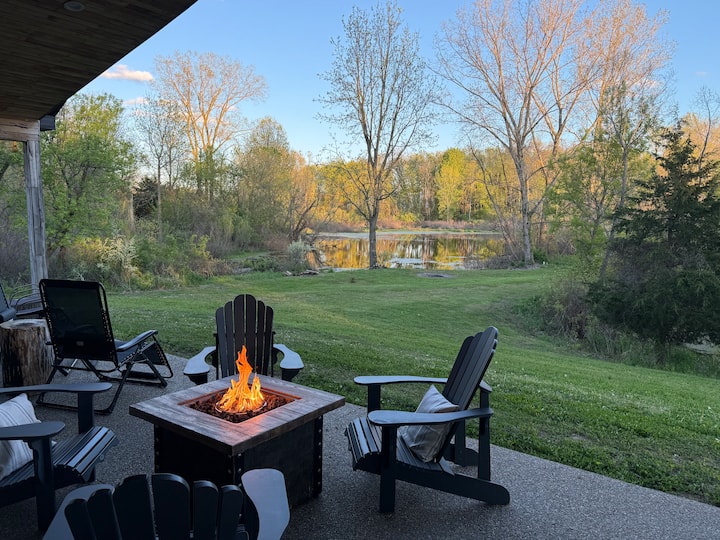
 Private 90-Acre Retreat w/ Trails, Firepit & Dogs Entire home · 2 bedrooms Rated 4.98
- Revenue
- $73,921
- Occupancy
- 75.8%
- Daily rate
- $233
Airbnb market data · 202612 months to October 2026
The average Airbnb in Marshall brought in $22,749 over the 12 months through October 2026, about 38% less than the Michigan average of $36,729.
The short answer
Marshall is priced below the Michigan average. Listings averaged $230 a night, about 32% less than that average of $340, and were booked on 41% of available nights, close to its 40% occupancy.
Timing matters: in July, usually the best month, the average listing earns about 2.7 times as much as in February, usually the slowest. With only 40 active listings, a few bookings can reorder the months.
With 40 active listings, Marshall is the 153rd-largest of 386 Michigan markets AirROI tracks.
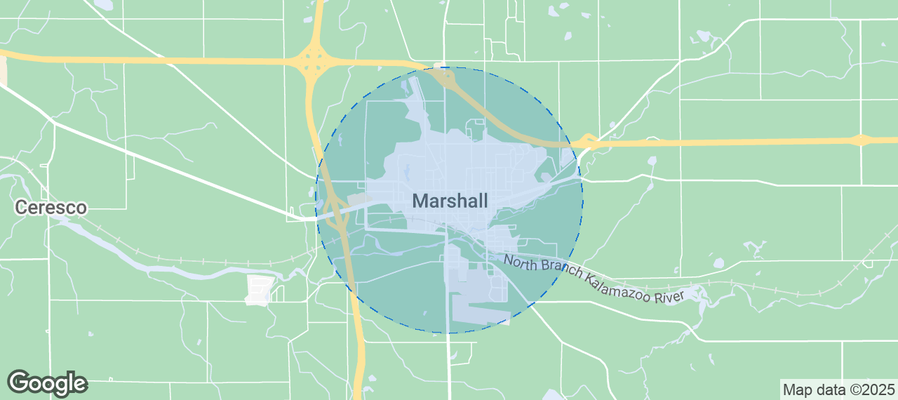 Browse the live Marshall Airbnb market See Every Marshall Listing
Revenue
Gross bookings per Marshall listing averaged $22,749 over the 12 months to October 2026 (Michigan average: $36,729), before cleaning, platform and management costs and taxes.
In a typical year, the average Marshall listing brings in $5,370 in July, its best month, and $2,000 in February, its slowest. The three strongest months bring in 36% of a full year's revenue, where an even calendar would give any three months 25%.
In a typical month, a top-quarter listing earns at least three times as much as a bottom-quarter one.
These are monthly figures for listings active in each month. The annual average above also counts listings that operated for only part of the year, so it runs below twelve times these figures.
July earns about 2.7 times what February does
Average revenue per active listing, by month, October 2024 to September 2026
Each point is one month as recorded, averaged over the listings active in it. The best and slowest months in the text average each calendar month over the past two years, so they can differ from the highest and lowest points here.
Latest 12 months in the October 2026 data. October's figures are still coming in, so the rows run to September.
July 2026 led on revenue and bookings; nightly rates peaked in May 2026.
| Month | Avg. Revenue | Occupancy | Avg. Nightly Rate | RevPAR | Booking Lead Time | Avg. Length of Stay |
|---|---|---|---|---|---|---|
| Oct 2025 | $2,791 | 37.1% | $226 | $90 | 59 days | 4 nights |
| Nov 2025 | $2,431 | 49.8% | $222 | $81 | 30 days | 3.3 nights |
| Dec 2025 | $2,581 | 42.3% | $223 | $83 | 50 days | 7.1 nights |
| Jan 2026 | $2,406 | 38.6% | $219 | $78 | 26 days | 5.8 nights |
| Feb 2026 | $2,148 | 33.4% | $219 | $77 | 47 days | 5.4 nights |
| Mar 2026 | $2,051 | 36.9% | $219 | $66 | 24 days | 6.7 nights |
| Apr 2026 | $2,535 | 41.7% | $227 | $84 | 45 days | 6.8 nights |
| May 2026 | $3,496 | 43.3% | $233 | $113 | 72 days | 3.4 nights |
| Jun 2026 | $4,008 | 51.0% | $231 | $134 | 61 days | 5.1 nights |
| Jul 2026 | $5,088 | 51.4% | $224 | $164 | 61 days | 7 nights |
| Aug 2026 | $2,915 | 49.1% | $222 | $94 | 60 days | 5.3 nights |
| Sep 2026 | $2,297 | 37.8% | $218 | $77 | 90 days | 2.7 nights |
Averages per active listing in each month. Highlighted: the highest-revenue month of the 12. RevPAR is the month's revenue spread over its nights, booked or not. Booking lead time is the days between booking and check-in, and length of stay the nights per booking, for stays in that month.
These are market-wide figures. To see what one particular Marshall home could earn, enter its address, bedrooms and guests in the Airbnb calculator; it compares the home with similar listings nearby.
Profit
Yes, when it's run well. The average Marshall Airbnb took in $22,749 in the 12 months to October 2026, and run by its owner at everyday costs, about $1,250 a month of that is left after running costs, so a home that costs less than that to own or rent makes money. A listing in the top quarter leaves about $2,130 a month.
Cleaning it yourself keeps the $1,780 a year guests pay in cleaning fees, for about $1,400 a month. Handing the listing to a co-host at about 10% of nightly bookings still leaves about $1,070 a month.
These amounts come before housing costs. Where the mortgage or rent is less each month, the difference is profit; a home owned outright keeps it all after property tax, home insurance and any HOA or condo fees.
| Line | Average listing | Top-quarter listing |
|---|---|---|
| Money in | ||
| Nightly bookings | $20,969 | $35,470 |
| Cleaning fees guests pay8% of Marshall bookings | $1,780 | $3,010 |
| Gross bookings | $22,749 | $38,480 |
| Running costs | ||
| Airbnb's feeAbout 15%: 15.5% for the 95% of Marshall listings on Simplified Pricing, 3% for the rest | −$3,380 | −$5,720 |
| Cleaning and laundryPaid for by the cleaning fee; $0 if you clean yourself | −$1,780 | −$3,010 |
| Utilities and internetAbout 5% of bookings | −$1,140 | −$1,920 |
| Guest suppliesToiletries, coffee, paper goods: about 2% | −$450 | −$770 |
| Repairs and upkeepIncluding linens and small replacements: about 3% | −$680 | −$1,150 |
| Short-term rental insuranceOne policy, on top of Airbnb's free AirCover | −$230 | −$230 |
| Permit and registrationWhere one is required | −$110 | −$110 |
| Management$0 when you run it; co-hosts charge from about 10% of nightly bookings | $0 | $0 |
| Pricing and messaging toolsOptional; Airbnb's own tools are free | $0 | $0 |
| Lodging taxesAdded to the guest's bill and passed on | $0 | $0 |
| Total running costsAbout 26% of bookings, plus cleaning paid for by the cleaning fee | −$7,770 | −$12,910 |
| Left for housing costs, then profit | $14,979about $1,250 a month | $25,570about $2,130 a month |
| Housing costs | ||
| Mortgage or rent, property tax, home insurance, HOA or condo fees | Depend on the home | |
The estimate starts from Marshall's average listing, run by its owner. Change how the listing performs, who runs it and who cleans to see what is left for the mortgage or rent.
To work out the profit on one Marshall home, with its price, its mortgage or rent and your own costs, use the Airbnb profit calculator. It starts from the comparable listings around the address.
What a listing keeps comes down to the figures this page measures: nightly rate, nights booked and the months it's open. A listing at the top-quarter mark takes in about $3,210 a month, against $1,900 for the average one.
Occupancy
Marshall listings were booked on 41% of the nights they were open over the past year, in line with the Michigan average and in line with the U.S. average. In a typical year, occupancy climbs to 57% in July and falls to 34% in February.
The busiest tenth of listings are booked about 3.9 times as often as the bottom quarter.
July is usually the busiest month in Marshall, February the quietest
Share of open nights booked, by month, October 2024 to September 2026
The 12-month rate of 41% averages each listing's whole year, slow months included; each month here counts only the listings booked in it.
Nightly rates
The average nightly rate in Marshall, known as ADR (average daily rate), was $230 over the past year, about 32% below the Michigan and U.S. averages ($340 and $335). Averaged month by month over the past two years, rates barely change through the year, staying between about $215 and $230.
The top 10% charge about 2.2 times the rate of the bottom quarter.
Average nightly rate by month in Marshall
Average nightly rate (ADR), by month, October 2024 to September 2026
RevPAR, or revenue per available night, divides a listing's income by every night it was open to book, so it rises with both price and bookings. In Marshall it averaged $91 over the past year, from about $70 in a typical March to about $173 in a typical July.
Per open night, by tier:
July RevPAR is about 2.5 times March's
Revenue per open night (RevPAR), by month, October 2024 to September 2026
Seasonality
With only 40 active listings, the monthly pattern in Marshall is noisy, since a few long or pricey stays can lift a month; revenue has tended to peak in July and bottom out in February.
Average revenue by month in Marshall
Average revenue per active listing, each calendar month averaged over the past two years
| Month | Revenue per listing |
|---|---|
| January | $2,560 |
| February | $2,000 |
| March | $2,160 |
| April | $2,270 |
| May | $3,310 |
| June | $3,660 |
| July | $5,370 |
| August | $3,120 |
| September | $2,770 |
| October | $2,710 |
| November | $2,170 |
| December | $2,340 |
Guests book Marshall stays 50 days ahead on average (about seven weeks). September stays are booked furthest out, about 94 days ahead, and January stays closest to arrival, about 21 days. A typical September booking is made in mid-June.
September stays are booked furthest ahead
Average days between booking and check-in, by month of stay, October 2024 to September 2026
The 12-month figure of 50 days averages each listing's year as a whole; each month here averages only the listings with stays in it.
Permits
None of the 40 active listings in Marshall display a registration, permit or license number. That doesn't mean no rules apply: some places don't ask hosts to show a number on the listing, and listing data doesn't capture every scheme.
Registration, permit, zoning and occupancy-tax rules vary by address and change often, so confirm them with the city or county before buying or listing in Marshall.
Neighborhoods
AirROI's area guide picks eight Marshall neighborhoods that draw short-term rental guests, led by Downtown Marshall, Lakeview Park and Kalamazoo River Area. The picks reflect guest appeal, not earnings data or permit eligibility, so check local permit rules for a specific address before buying.
| Area | Who it suits | Landmarks nearby |
|---|---|---|
| Downtown Marshall | Historic downtown area with charming shops, cafes, and restaurants. Close to local attractions and provides a nice small-town feel that appeals to tourists. | Marshall Historical Society, Honors Golf Club, Brooks Memorial Fountain, Kellogg's Cereal City, Marshall Music Festival |
| Lakeview Park | A beautiful lakeside area popular for outdoor activities and relaxation. Ideal for families and nature lovers looking for a scenic getaway. | Lake Marshall, Marshalls Beach, Fishing and boating activities, Picnic areas, Trails for walking and biking |
| Kalamazoo River Area | A scenic area along the Kalamazoo River that offers beautiful views and opportunities for outdoor recreation. It's great for those who love nature and peace. | Kalamazoo River, Riverwalk, Nature trails, Wildlife observation, Fishing spots |
| Historic neighborhoods | Marshall has several historic neighborhoods with beautiful architecture and a sense of charm. Great for those who appreciate history and culture. | Victorian Heritage, Historic homes tours, Around the World in 80 Days Skit, Michigan's Historic Sites, Marshall Depot |
| Broadway Street | A vibrant street known for its eateries and local shops, attracting visitors looking for a taste of local flavor and a quick stop to shop. | Unique boutiques, Local eateries, Street festivals, Art galleries |
| Nearby Battle Creek | Just a short drive away, Battle Creek offers more urban amenities and attractions, making it a good base for exploring both cities. | Kellogg's World Headquarters, Battle Creek's historic district, Full Blast Water Park, Binder Park Zoo |
| Local Parks | Marshall has many parks that are appealing for outdoor enthusiasts and families, making it a great place for short-term rentals. | Homer Stryker Field, Marshall City Park, Schuler Park, Parks with playgrounds, Sporting facilities |
| Cultural Events | Marshall hosts various cultural events throughout the year, attracting tourists for both historic and festive experiences. | Marshall Music Festival, Lakeview Community Band, Art shows, Seasonal festivals |
Area descriptions are AI-assisted from public sources and are not checked against zoning.
Listings
Entire homes make up 70% of listings in Marshall, alongside 12 private-room listings (30%). Apartments or condos (43%) and houses (43%) split the stock almost evenly.
Mostly entire homes, with a private-room segment
Marshall Airbnb listings by room type
| Room type | Share of listings | Listings |
|---|---|---|
| Entire home | 70.0% | 28 |
| Private room | 30.0% | 12 |
Apartments and houses split the stock
Marshall Airbnb listings by property type
| Property type | Share of listings | Listings |
|---|---|---|
| Apartment/Condo | 42.5% | 17 |
| House | 42.5% | 17 |
| Hotel/Boutique | 15.0% | 6 |
The most common size among Marshall's 28 entire homes with a bedroom count is one bedroom (11 homes).
Marshall entire homes by number of bedrooms
Entire homes with each number of bedrooms, of those with a bedroom count on file
| Bedrooms | Share of entire homes with a bedroom count | Entire homes |
|---|---|---|
| Studio | 10.7% | 3 |
| 1 bedroom | 39.3% | 11 |
| 2 bedrooms | 32.1% | 9 |
| 3 bedrooms | 14.3% | 4 |
| 4 bedrooms | 3.6% | 1 |
Most Marshall listings are sized for couples and small families: 77% sleep four guests or fewer, and just 3% take eight or more. Shares are of the 30 listings with a guest capacity on file (75% of the market).
Marshall listings by guest capacity
Share of listings by the number of guests they sleep, of those with a capacity on file
| Guest capacity | Share of listings with a capacity on file | Listings |
|---|---|---|
| 2 guests | 33.3% | 10 |
| 3 guests | 10.0% | 3 |
| 4 guests | 33.3% | 10 |
| 5 guests | 6.7% | 2 |
| 6 guests | 10.0% | 3 |
| 7 guests | 3.3% | 1 |
| 8+ guests | 3.3% | 1 |
Marshall hosts set up an average of 2.1 beds per listing, close to one bed per bedroom. Only 43% of listings show their exact location on the listing map; the rest show an approximate area.
Dedicated workspaces are common in Marshall: 68% of listings have one, and 65% offer self check-in.
Share of Marshall listings with each common amenity
Guests
Marshall draws mostly domestic guests: 94% of those who left reviews live in the United States. No single city dominates: Seattle is the largest source, at about 4% of reviews. Of the 6% from abroad, most come from Canada and the United Kingdom. Guests speak a mix of languages: English leads at 59%, followed by French and Spanish.
94% of Marshall guests are domestic
Where guests who left reviews live
Where Marshall guests come from: top cities
Share of guests who left reviews
| Origin city | Share of guests |
|---|---|
| Seattle | 3.7% |
| Michigan | 3.1% |
| Chicago | 2.5% |
| Fort Wayne | 2.2% |
| Indianapolis | 2.2% |
Where Marshall guests come from: top countries
Share of guests who left reviews
| Origin country | Share of guests |
|---|---|
| United States | 93.5% |
| Canada | 2.5% |
| United Kingdom | 1.5% |
| Denmark | 0.9% |
| Germany | 0.3% |
Languages spoken by Marshall guests
Share of guests who left reviews
| Language | Share of guests |
|---|---|
| English | 58.5% |
| French | 11.9% |
| Spanish | 10.4% |
| Italian | 8.1% |
| Polish | 3.0% |
Marshall Airbnbs average 4.94 stars, and 63% of listings hold Airbnb's Guest Favorite badge. The category scores are tightly bunched, and value for money is the lowest, at 4.89. Listings here carry long review histories, about 81 reviews each on average.
Communication scores highest in Marshall; value is lowest
Average guest rating out of 5 by category; the bars start at 4.0
| Category | Average rating (out of 5) |
|---|---|
| Accuracy | 4.92 |
| Cleanliness | 4.95 |
| Communication | 4.97 |
| Location | 4.93 |
| Check-in | 4.95 |
| Value | 4.89 |
Booking patterns
More than eight in ten Marshall listings are open to guests more than 180 days a year, but only 18% are booked or blocked that many days. The most common booked-or-blocked total is 91 to 180 days a year, covering 33% of listings; blocked nights include any the host closes off.
Days a year Marshall listings are open to guests
Share of listings by days a year
| Days a year | Share of listings | Listings |
|---|---|---|
| 271-366 days | 50.0% | 20 |
| 181-270 days | 32.5% | 13 |
| 91-180 days | 12.5% | 5 |
| 31-90 days | 5.0% | 2 |
Days a year Marshall listings are booked or blocked
Share of listings by days a year
| Days a year | Share of listings | Listings |
|---|---|---|
| 271-366 days | 5.0% | 2 |
| 181-270 days | 12.5% | 5 |
| 91-180 days | 32.5% | 13 |
| 31-90 days | 32.5% | 13 |
| 1-30 days | 17.5% | 7 |
The average Marshall booking lasts 6.2 nights, longest in January and shortest in September. Listings took about 21 bookings each over the year. About seven in ten listings that give a check-in time set it at 3 p.m., with check-out usually at 11 a.m.
Average length of stay by month in Marshall
Average nights per booking, by month of stay
Two-year average by calendar month.
More than eight in ten listings in Marshall accept stays of one or two nights. A smaller group, 8%, takes only stays of 30 nights or more.
Minimum stay set by Marshall listings
Share of listings by the shortest stay they accept, from one night to 30 or more
Firm is the most common cancellation policy in Marshall, used by 33% of listings; it refunds guests in full only if they cancel at least 30 days before check-in. Hosts here lean flexible: 55% of listings offer Flexible or Moderate terms, against 33% on Firm or stricter ones.
Cancellation policies of Marshall listings, from most to least flexible
Share of listings by the policy they use
About seven in ten Marshall listings charge a cleaning fee. The typical fee is $75, and some higher fees lift the average to $100. Spread over the average stay of 6.2 nights, that adds roughly $12 a night to what guests pay. For listings that charge one, cleaning fees make up about 8% of gross revenue.
Top earners
The top-grossing listing, a private room at $1,740 a night (about 6.1 times the $285 that puts a listing in the top 10% here), is left out below: a price like that usually means it covers several rooms or units, or that it is misrecorded. Leaving it out, the top earner in Marshall, a two-bedroom unit, took in $73,900 over the past year, about 3.2 times the city's average of $22,700. Three of the six listings below have two bedrooms or fewer, so size alone doesn't explain the top of this market.
Private 90-Acre Retreat w/ Trails, Firepit & Dogs Entire home · 2 bedrooms Rated 4.98 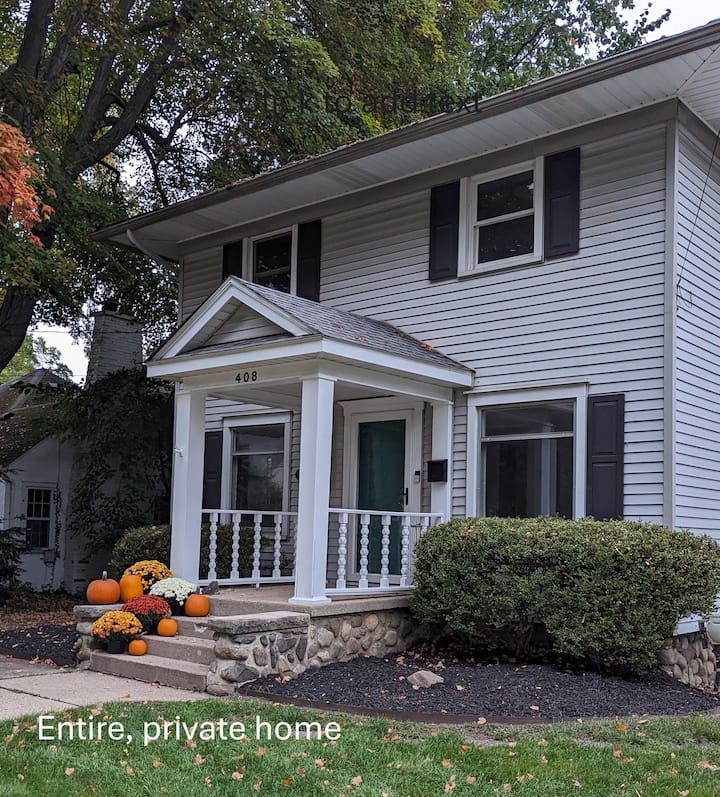 Madison Street Place Entire home · 3 bedrooms Rated 4.99
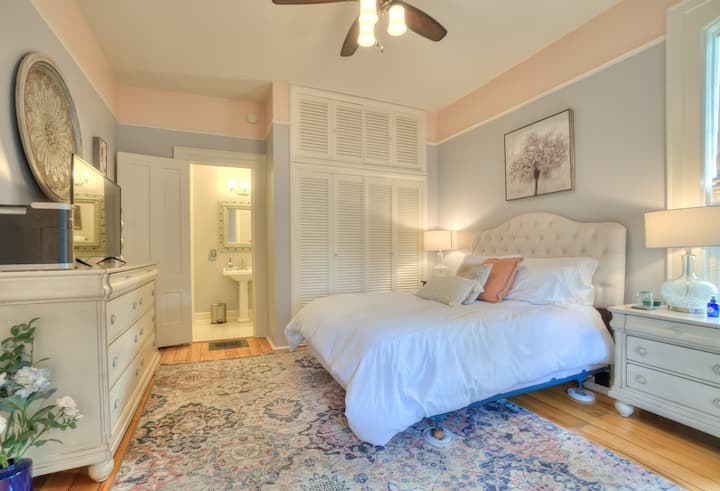 Three King Rooms at Marshall Boutique Hotel Private room · 3 bedrooms
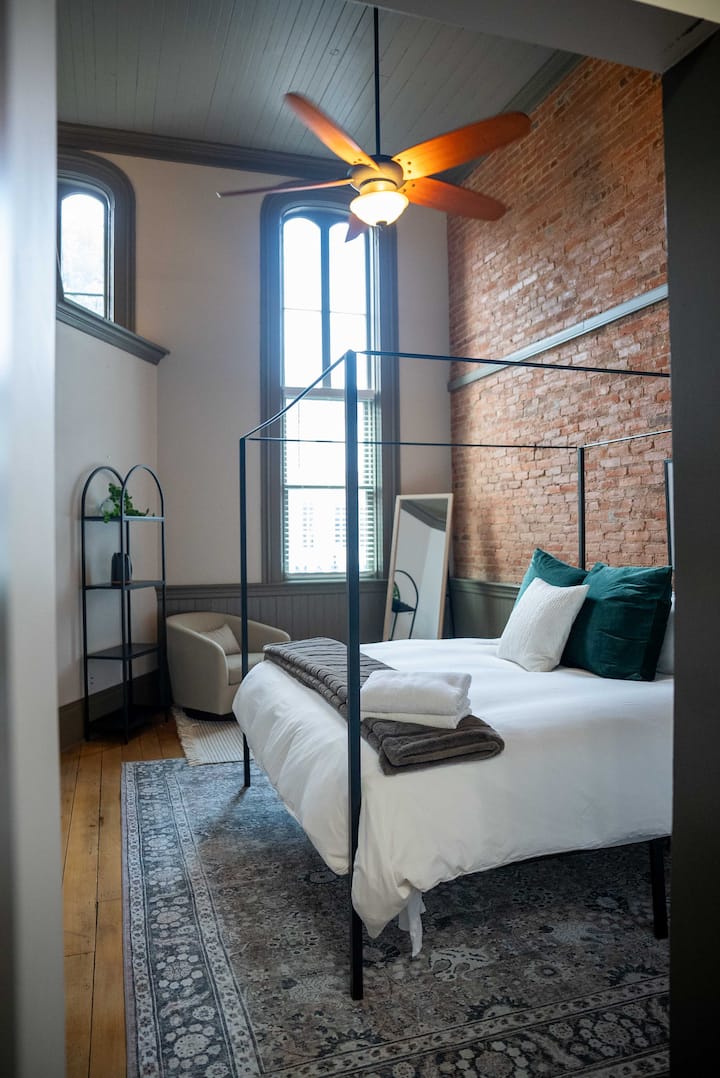 2 Bedroom Huge Marshall Apartment Entire home · 2 bedrooms Rated 4.93
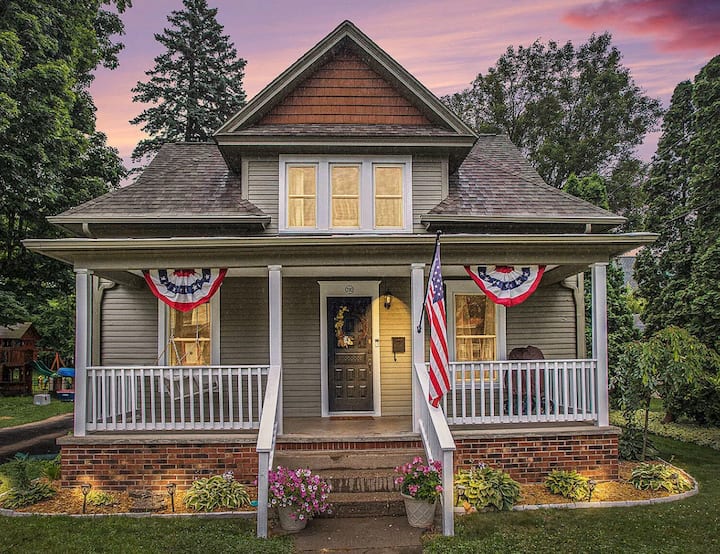 Liberty House Entire home · 3 bedrooms Rated 5.00
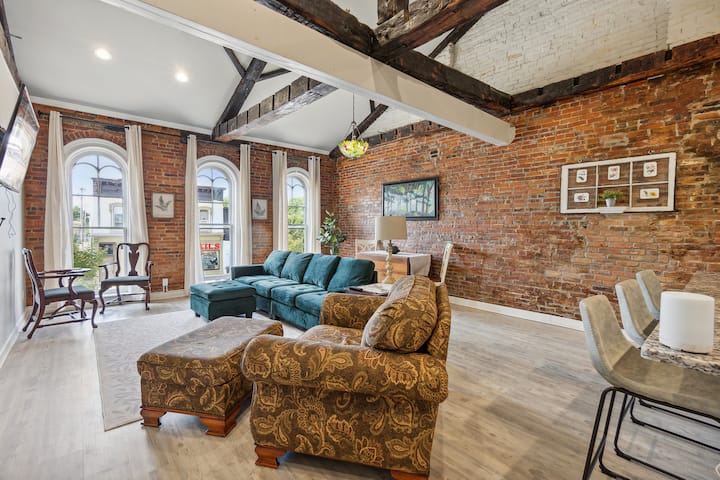 Rosie's Loft Entire home · 2 bedrooms Rated 4.98
Fewer than 1% of Marshall listings are classed as professionally managed, though 30% of listings have a co-host. 63% of listings are run by Superhosts, so a strong review record is the norm here rather than an edge. Most hosts still vet their guests: only 25% of listings accept Instant Book. Airbnb's Simplified Pricing, where the host pays the whole service fee and guests see one price with no separate Airbnb charge, covers 95% of listings.
Nearby markets
Of the eight nearby markets in the table, all within 66 km, Columbia Township (14 km away, 45 listings) earned the most per listing, about 2.2 times as much as Marshall. Battle Creek was the busiest, booked on 49% of nights against 41% in Marshall.
| Market | Listings | Avg. annual revenue | Avg. nightly rate | Occupancy |
|---|---|---|---|---|
| Columbia Township 14 km | 45 | $49,088 | $383 | 40% |
| Battle Creek 18 km | 55 | $24,874 | $173 | 49% |
| Jackson 47 km | 49 | $25,632 | $256 | 44% |
| Hillsdale 48 km | 46 | $31,285 | $254 | 41% |
| Kalamazoo 52 km | 158 | $19,071 | $159 | 42% |
| Lansing 61 km | 289 | $17,533 | $159 | 42% |
| Rollin Township 64 km | 35 | $28,382 | $388 | 30% |
| East Lansing 66 km | 46 | $22,008 | $162 | 48% |
See all 386 Michigan Airbnb markets
Markets elsewhere in the United States with a similar nightly rate and occupancy to Marshall:
FAQ
An active Marshall Airbnb grossed $22,749 on average in the 12 months to October 2026, according to AirROI's tracking of 40 active listings. That is before cleaning, management, taxes and financing. Busier, better-run listings do far better: the top quarter took in $3,580 or more in a typical month.
It depends most on the home's size, location and how it's run. The middle half of Marshall listings earn between $1,170 and $3,580 in a typical month, and the top tenth $5,680 or more. For one home, enter its address and bedroom count in the Airbnb income calculator: it compares the home with similar listings nearby.
Listings in Marshall were booked on 41% of available nights over the past year. That compares with 40% for the Michigan average. July is usually the busiest month.
The average booked night in Marshall cost $230 before fees. Half of listings charge between $130 and $215; a few high-priced homes pull the average above that range.
None of the active Marshall listings display a registration, permit or license number. That doesn't mean no rules apply, so confirm registration, permit and occupancy-tax rules with the city or county before buying.
Yes, when it's run well. The average Marshall Airbnb grossed $22,749 in the 12 months to October 2026, 38% below the Michigan average of $36,729. Run by its owner, with the cleaning fee covering the cleaner and everyday costs for Airbnb's fee, utilities, supplies, upkeep and insurance, $14,979 a year (about $1,250 a month) is left before the mortgage or rent. A home that costs less than that to own or rent makes a profit, and a listing at the top-quarter mark leaves about $2,130 a month. Check a specific home in the Airbnb estimator.
July usually pays best, averaging $5,370 per active listing over the past two years, and February usually pays least. The month-by-month table above shows how the latest 12 months played out.
Each night a Marshall listing was open to book earned $91 on average over the past year, booked or not. That figure, revenue per available night (RevPAR), folds price and occupancy into one number; the top 10% of listings made $155 or more.
Marshall stays were booked 50 days (about seven weeks) before arrival on average over the past year, so most of a month is booked well before it starts.
The average Marshall Airbnb stay lasted 6.2 nights over the past year. A listing took 21 reservations over the year on average.
Guests rate Marshall Airbnbs 4.94 out of 5 on average. Guests score communication highest and value lowest.
Downtown Marshall, Lakeview Park and Kalamazoo River Area draw the most short-term rental interest in Marshall. The neighborhood guide explains what brings guests to each.
AirROI counted 40 active Airbnb listings in Marshall as of October 2026. The closest tracked market is Columbia Township, 14 km away.
In Marshall, about seven in ten listings add a cleaning fee. The median fee is $75, and some higher fees lift the average to $100.
All of Michigan had 131.2 million visitors in 2024, Travel Michigan, part of the Michigan Economic Development Corporation reports. AirROI estimates 833 Airbnb stays in Marshall, MI in the 12 months to October 2026, which counts bookings and not tourists. See Michigan tourism statistics.
Method
Figures on this page cover 40 active Airbnb listings in Marshall from November 2025 to October 2026 (trailing twelve months). AirROI refreshes them monthly from listing-level booking and calendar data covering 20+ million properties worldwide. Money figures are in U.S. dollars. Annual revenue averages every listing active during the period, including those listed for only part of it; monthly figures average the listings active in each month; the tier lists show the spread. Neighborhood descriptions are AI-assisted. See the methodology for definitions.
Need this programmatically? The same metrics are available through the AirROI Airbnb Data API and bulk downloads in the data portal.