Airbnb market data · 202512 months to May 2025
Berkeley Heights, NJ Airbnb Market Data: Revenue, Occupancy & Trends
The average Airbnb in Berkeley Heights brought in $26,100 over the 12 months through May 2025, across just 28 active listings, so a single property can move that figure.
AirROI's latest figures for Berkeley Heights run through May 2025.
The short answer
Berkeley Heights Airbnb Market at a Glance
Listings averaged $578 a night and were booked on 22% of available nights.
Timing matters: in May, the best month, the average listing earned about five times as much as in January, the slowest. With only 28 active listings, a few bookings can reorder the months.
With 28 active listings, Berkeley Heights is the 91st-largest of 128 New Jersey markets AirROI tracks.
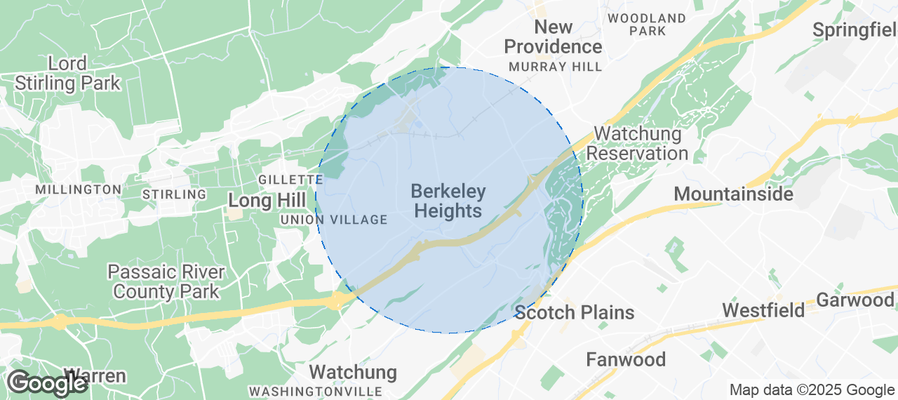 Browse the live Berkeley Heights Airbnb market See Every Berkeley Heights Listing
Revenue
How Much Do Airbnb Hosts Make in Berkeley Heights?
Gross bookings per Berkeley Heights listing averaged $26,100 over the 12 months to May 2025 (New Jersey average: $37,378), before cleaning, platform and management costs and taxes.
The average Berkeley Heights listing brought in $6,310 in May, its best month, and $1,270 in January, its slowest. The three strongest months bring in 43% of a full year's revenue, where an even calendar would give any three months 25%.
Across Berkeley Heights's 28 active listings, monthly revenue by tier:
- Best-in-class properties (top 10%) earn $5,880+ a month, about 2.7 times the typical property.
- Strong performers (top 25%) earn $4,180 or more, roughly $2,000 a month above the median.
- Typical properties (median) earn about $2,200 a month.
- Entry-level properties (bottom 25%) earn $1,540 or less, about two-thirds of the median.
These are monthly figures for listings active in each month. The annual average above also counts listings that operated for only part of the year, so it runs below twelve times these figures.
May earned about five times what January did
Average revenue per active listing, by month
Berkeley Heights Airbnb Data by Month
Latest 12 months in the May 2025 data.
May led on revenue and nightly rate; bookings peaked in December.
| Month | Avg. Revenue | Occupancy | Avg. Nightly Rate | Booking Lead Time |
|---|---|---|---|---|
| Jun 2024 | $1,733 | 13.3% | $510 | 20 days |
| Jul 2024 | $4,929 | 24.9% | $525 | 10 days |
| Aug 2024 | $4,186 | 28.4% | $490 | 21 days |
| Sep 2024 | $4,091 | 28.0% | $494 | 15 days |
| Oct 2024 | $1,429 | 10.4% | $515 | 29 days |
| Nov 2024 | $1,316 | 46.7% | $499 | 43 days |
| Dec 2024 | $1,687 | 56.5% | $474 | 53 days |
| Jan 2025 | $1,275 | 40.3% | $536 | 20 days |
| Feb 2025 | $2,163 | 52.4% | $570 | 22 days |
| Mar 2025 | $2,361 | 16.3% | $578 | 8 days |
| Apr 2025 | $4,002 | 26.3% | $602 | 12 days |
| May 2025 | $6,307 | 27.6% | $772 | 31 days |
Averages per active listing in each month. Highlighted: the highest-revenue month. Booking lead time is the days between booking and check-in for stays in that month.
For a figure on one home rather than the whole Berkeley Heights market, enter its address and size in the Airbnb calculator, which compares it with similar listings nearby.
Profit
Is an Airbnb in Berkeley Heights Profitable?
Yes, when it's run well. The average Berkeley Heights Airbnb took in $26,100 in the 12 months to May 2025, and run by its owner at everyday costs, about $1,590 a month of that is left after running costs, so a home that costs less than that to own or rent makes money. A listing in the top quarter leaves about $3,050 a month.
These amounts come before housing costs. Where the mortgage or rent is less each month, the difference is profit; a home owned outright keeps it all after property tax, home insurance and any HOA or condo fees.
Berkeley Heights Airbnb Income, Expenses and Profit per Year
| Line | Average listing | Top-quarter listing |
|---|---|---|
| Money in | ||
| Gross bookings | $26,100 | $49,690 |
| Running costs | ||
| Airbnb's fee15.5% of bookings, Airbnb's standard host-only fee | −$4,050 | −$7,700 |
| Utilities and internetAbout 5% of bookings | −$1,310 | −$2,480 |
| Guest suppliesToiletries, coffee, paper goods: about 2% | −$520 | −$990 |
| Repairs and upkeepIncluding linens and small replacements: about 3% | −$780 | −$1,490 |
| Short-term rental insuranceOne policy, on top of Airbnb's free AirCover | −$260 | −$260 |
| Permit and registrationWhere one is required | −$130 | −$130 |
| Management$0 when you run it; co-hosts charge from about 10% of nightly bookings | $0 | $0 |
| Pricing and messaging toolsOptional; Airbnb's own tools are free | $0 | $0 |
| Lodging taxesAdded to the guest's bill and passed on | $0 | $0 |
| Total running costsAbout 27% of bookings | −$7,050 | −$13,050 |
| Left for housing costs, then profit | $19,050about $1,590 a month | $36,640about $3,050 a month |
| Housing costs | ||
| Mortgage or rent, property tax, home insurance, HOA or condo fees | Depend on the home | |
Estimate Your Own Berkeley Heights Airbnb Profit
The estimate starts from Berkeley Heights's average listing, run by its owner. Change how the listing performs, who runs it and who cleans to see what is left for the mortgage or rent.
To work out the profit on one Berkeley Heights home, with its price, its mortgage or rent and your own costs, use the Airbnb profit calculator. It starts from the comparable listings around the address.
How Berkeley Heights's Top Earners Get There
- More nights booked. The busiest quarter of Berkeley Heights listings are booked on 36% or more of their nights, against 29% for the median listing. Ten more booked nights a year at the median rate of $370 adds about $3,700 in bookings.
- Prices that follow demand. Ranked by price, the top quarter charge $845 a night or more, against a median of $370. That is a separate ranking from the busiest quarter, so the two marks don't multiply into one listing's takings. For the average listing, a 10% higher rate on the nights it already books adds about $2,610 a year.
- Open for the busy months. May brought the average listing about $6,310, against $1,270 in January, so a calendar that is open and full in the busy months carries the year.
What a listing keeps comes down to the figures this page measures: nightly rate, nights booked and the months it's open. A listing at the top-quarter mark takes in about $4,140 a month, against $2,180 for the average one.
Occupancy
What Is the Airbnb Occupancy Rate in Berkeley Heights?
Berkeley Heights listings were booked on 22% of the nights they were open over the past year, 20 percentage points below the New Jersey average (42%) and 19 points below the U.S. average (41%). Occupancy swings from 10% in October to 56% in December.
Across Berkeley Heights's 28 active listings, the share of open nights booked by tier:
- Best-in-class properties (top 10%) are booked 41%+ of open nights, 12 points above the median.
- Strong performers (top 25%) fill 36% or more, roughly two and a half nights a week.
- Typical properties (median) fill about 29% of open nights.
- Entry-level properties (bottom 25%) fill 24% or less, under two nights a week.
December was the busiest month in Berkeley Heights, October the quietest
Share of open nights booked, by month
The 12-month rate of 22% averages each listing's whole year, slow months included; each month here counts only the listings booked in it.
Nightly rates
How Much Does an Airbnb Cost per Night in Berkeley Heights?
The average nightly rate in Berkeley Heights, known as ADR (average daily rate), was $578 over the past year, about 61% above the New Jersey average of $360 and about 73% above the U.S. average of $335. Rates swing with the seasons, from about $475 in December to about $770 in May.
Across Berkeley Heights's 28 active listings, nightly rates by tier:
- Best-in-class properties (top 10%) charge $1,150+ a night, about 3.1 times the median.
- Strong performers (top 25%) charge $845 or more, about $480 above the median.
- Typical properties (median) charge about $370 a night.
- Entry-level properties (bottom 25%) charge $310 or less, about 16% below the median.
May rates ran 63% above December's
Average nightly rate (ADR), by month
The 12-month ADR of $578 averages each listing's own rate across its whole year; the monthly points average listings month by month, so the two differ.
Seasonality
Best and Worst Months for Airbnb in Berkeley Heights
With only 28 active listings, the monthly pattern in Berkeley Heights is noisy, since a few long or pricey stays can lift a month; revenue peaked in May and bottomed out in January.
How Far in Advance Do Guests Book Airbnb in Berkeley Heights?
Guests book Berkeley Heights stays 18 days ahead on average (about three weeks), so many trips are booked close to arrival. December stays are booked furthest out, about 53 days ahead, and March stays closest to arrival, about 8 days. A typical December booking is made in late October.
December stays are booked furthest ahead
Average days between booking and check-in, by month of stay
The 12-month figure of 18 days averages each listing's year as a whole; each month here averages only the listings with stays in it.
Permits
Airbnb Permits and Registration in Berkeley Heights
None of the 28 active listings in Berkeley Heights display a registration, permit or license number. That doesn't mean no rules apply: some places don't ask hosts to show a number on the listing, and listing data doesn't capture every scheme.
Registration, permit, zoning and occupancy-tax rules vary by address and change often, so confirm them with the city or county before buying or listing in Berkeley Heights.
Neighborhoods
Best Neighborhoods for Airbnb in Berkeley Heights
AirROI's area guide picks eight Berkeley Heights neighborhoods that draw short-term rental guests, led by Downtown Berkeley Heights, Watchung Reservation and Mountainside. The picks reflect guest appeal, not earnings data or permit eligibility, so check local permit rules for a specific address before buying.
| Area | Who it suits | Landmarks nearby |
|---|---|---|
| Downtown Berkeley Heights | This area is the heart of the town, providing easy access to shopping, dining, and community events. It attracts both travelers and those visiting family and friends in the area. | Berkeley Heights Farmer's Market, Cedar Street Park, Local Restaurants, The Berkeley Heights Public Library, Cranford Canoe Club |
| Watchung Reservation | A beautiful natural area highlighting outdoor activities like hiking and biking, perfect for nature enthusiasts and those looking for a peaceful retreat. | Watchung Reservation Trails, The Loop Playground, Cranford Canoe Club, Nature Center, Nomahegan Park |
| Mountainside | Surrounding suburb with easy access to both urban conveniences and natural settings, attracting families and business travelers, especially near the mountains. | Echo Lake Park, Mountainside Historic District, Local Shops and Cafes, Nearby skiing and hiking trails, The Loop Trail |
| Chatham Borough | A charming neighboring town with a quaint downtown area and a vibrant community atmosphere, popular for its upscale homes and boutique shopping. | Chatham Historical Society, The Great Swamp National Wildlife Refuge, Local Events and Festivals, Chatham Circle Park, The Main Street Shops |
| New Providence | A lovely suburb with great local amenities, attracting families and young professionals looking for a suburban lifestyle with easy access to NYC. | New Providence Public Library, Local Coffee Shops, Crisman Park, The New Providence Historical Society, Recreation Fields |
| Summit | A trendy area with a vibrant downtown, known for its shopping and dining scene, appealing to both young professionals and families. | Summit Village Green, Reeves-Reed Arboretum, Local Restaurants, Buy Local Summit, Summit Farmers Market |
| South Orange | A culturally rich area with diverse dining and entertainment options, drawing many visitors, especially from nearby universities. | South Orange Performing Arts Center, Seton Hall University, local bars and pubs, South Orange Community Pool, Sorrel Garden |
| Short Hills | An upscale neighborhood known for its luxury homes and proximity to high-end shopping, making it desirable for affluent travelers and business people. | The Mall at Short Hills, Coyote Hill Park, Hyatt Regency hotel, Local Fine Dining, Short Hills Train Station |
Area descriptions are AI-assisted from public sources and are not checked against zoning.
Nearby markets
Berkeley Heights vs. Nearby Airbnb Markets
Of the eight nearby markets in the table, all within 17 km, Plainfield (5 km away, 34 listings) earned the most per listing, about 25% more than Berkeley Heights. Linden was the busiest, booked on 45% of nights against 22% in Berkeley Heights.
| Market | Listings | Avg. annual revenue | Avg. nightly rate | Occupancy |
|---|---|---|---|---|
| Plainfield 5 km | 34 | $32,590 | $235 | 44% |
| Union 10 km | 60 | $25,841 | $243 | 42% |
| Rahway 14 km | 46 | $15,389 | $144 | 39% |
| Woodbridge Township 15 km | 37 | $10,529 | $232 | 32% |
| Edison 15 km | 44 | $11,663 | $171 | 36% |
| Linden 15 km | 40 | $26,690 | $208 | 45% |
| Maplewood 15 km | 35 | $29,912 | $284 | 41% |
| Hillside 17 km | 161 | $8,488 | $106 | 33% |
Other Airbnb Markets in New Jersey
- Jersey City Airbnb data 1,538 listings
- Newark Airbnb data 1,410 listings
- Wildwood Airbnb data 874 listings
- Ocean City Airbnb data 784 listings
- Atlantic City Airbnb data 745 listings
- Lower Township Airbnb data 582 listings
- Seaside Heights Airbnb data 550 listings
- North Bergen Airbnb data 512 listings
See all 128 New Jersey Airbnb markets
Markets Similar to Berkeley Heights
Markets elsewhere in the United States with a similar nightly rate and occupancy to Berkeley Heights:
- Oxford Airbnb data MS · $623/night · 26.2%
- Sunland Estates Airbnb data WA · $504/night · 24.9%
- Boyne Valley Township Airbnb data MI · $566/night · 28.3%
- Concan Airbnb data TX · $501/night · 25.8%
- Tuscaloosa Airbnb data AL · $489/night · 25.4%
- Kingsland Airbnb data TX · $663/night · 27.2%
FAQ
Berkeley Heights Airbnb FAQ
How much do Airbnb hosts make in Berkeley Heights?
An active Berkeley Heights Airbnb grossed $26,100 on average in the 12 months to May 2025, according to AirROI's tracking of 28 active listings. That is before cleaning, management, taxes and financing. Busier, better-run listings do far better: the top quarter took in $4,180 or more in a typical month.
How much can I make on Airbnb in Berkeley Heights?
It depends most on the home's size, location and how it's run. The middle half of Berkeley Heights listings earn between $1,540 and $4,180 in a typical month, and the top tenth $5,880 or more. For one home, enter its address and bedroom count in the Airbnb income calculator: it compares the home with similar listings nearby.
What is the average Airbnb occupancy rate in Berkeley Heights?
Listings in Berkeley Heights were booked on 22% of available nights over the past year. That compares with 42% for the New Jersey average. December was the busiest month.
How much does an Airbnb cost per night in Berkeley Heights?
The average booked night in Berkeley Heights cost $578 before fees. Half of listings charge between $310 and $845, so bedroom count and location move the price more than the average suggests.
Do you need a permit for an Airbnb in Berkeley Heights?
None of the active Berkeley Heights listings display a registration, permit or license number. That doesn't mean no rules apply, so confirm registration, permit and occupancy-tax rules with the city or county before buying.
Is Airbnb profitable in Berkeley Heights?
Yes, when it's run well. The average Berkeley Heights Airbnb grossed $26,100 in the 12 months to May 2025, 30% below the New Jersey average of $37,378, though with only 28 active listings a single property can move that figure. Run by its owner, with everyday costs for Airbnb's fee, utilities, supplies, upkeep and insurance, $19,050 a year (about $1,590 a month) is left before the mortgage or rent. A home that costs less than that to own or rent makes a profit, and a listing at the top-quarter mark leaves about $3,050 a month. Check a specific home in the Airbnb estimator.
When is Airbnb peak season in Berkeley Heights?
May paid best over the past year, at $6,310 per active listing, and January paid least. The month-by-month table above shows how rates and bookings each move.
How far in advance do guests book Airbnbs in Berkeley Heights?
Berkeley Heights stays were booked 18 days (about three weeks) before arrival on average over the past year, so a listing can still fill close to the date.
What are the best neighborhoods for Airbnb in Berkeley Heights?
Downtown Berkeley Heights, Watchung Reservation and Mountainside draw the most short-term rental interest in Berkeley Heights. The neighborhood guide explains what brings guests to each.
How many Airbnbs are there in Berkeley Heights?
AirROI counted 28 active Airbnb listings in Berkeley Heights as of May 2025. The closest tracked market is Plainfield, 5 km away.
Method
About This Data
Figures on this page cover 28 active Airbnb listings in Berkeley Heights from June 2024 to May 2025 (trailing twelve months). AirROI refreshes them monthly from listing-level booking and calendar data covering 20+ million properties worldwide. Money figures are in U.S. dollars. Annual revenue averages every listing active during the period, including those listed for only part of it; monthly figures average the listings active in each month; the tier lists show the spread. Neighborhood descriptions are AI-assisted. See the methodology for definitions.
Need this programmatically? The same metrics are available through the AirROI Airbnb Data API and bulk downloads in the data portal.