
Airbnb Q1 2026 Earnings Recap: 4 of 5 Host Predictions Hit, 3 New Strategic Threads
The 60-Second Host Reframe
The Q1 2026 earnings results confirm the rate-driven, supply-tightening pattern we documented across major US markets in our preview — but with three meaningful shifts every host needs to internalize before Q2. Aggregate Airbnb revenue grew 18% to $2.68B; gross booking value grew 19% to $29.2B; nights and seats booked grew 9% to 156.2M; ADR grew 9% (4% excluding foreign exchange). At platform scale, that is rate-driven growth confirmed. CFO Ellie Mertz noted on the call that ADR rose 9% year-over-year while nights and seats grew 9% — the GBV–nights gap of roughly 10 percentage points indicates pricing power is still the dominant lever. The April 14 piece predicted exactly this divergence.
What changed: management now describes hotels as a "much bigger" strategic priority, not an opportunistic adjacent-category test. The 15.5% single host service fee structure is no longer a 2026 target — over 25% of active listings have already migrated, with CFO Mertz guiding to "modest upside" on take rate from the rollout plus a new insurance program. And the war in the Middle East has joined the macro bucket of forecast adjustments, knocking roughly 1 percentage point off Q2 nights and seats growth. Three analyst firms — Susquehanna ($170 PT), Oppenheimer ($180 PT, May 4), and Wells Fargo ($178 PT, April 22) — moved off neutral or upgraded into earnings, betting that Street consensus underprices these catalysts.
"Hotels could be a multibillion-dollar revenue business without anyone intending to come to us to book a hotel." — Brian Chesky, CEO, Airbnb Q1 2026 earnings call
The headline is fine. The structural shifts beneath it are what hosts need to price into Q2 decisions.
Five Q1 2026 Metrics Revisited — The Prediction Track Record
Metric 1 — Gross Booking Value: predicted "low teens," actual +19%
GBV grew 19% to $29.2B, exceeding both Airbnb's own guidance for low-teens growth and the $27.79B consensus. The predicted direction was correct, the predicted magnitude undershot the actual. More importantly for hosts, the GBV-nights gap widened: GBV grew 19% while nights and seats grew 9%, a 10-percentage-point spread that confirms higher transaction values are doing the heavy lifting; demand volume is contributing roughly half as much.
Metric 2 — Nights and Seats Booked: predicted "high single digit," actual +9%
Nights and seats grew 9% to 156.2 million — center of the predicted range. Without the approximate 100 basis point headwind from the Middle East conflict, the print would have been closer to 10%. App nights specifically grew 22% YoY, taking app share of total nights from 58% to 63%. First-time bookers grew 10%, the highest growth rate since 2022, led by Brazil, Japan, and India.
For hosts: demand volume is fine but no longer accelerating. The 9% growth print includes structural product tailwinds (Reserve Now Pay Later adoption, expanded inventory categories) that mask softening organic demand. Watch Q2 closely — a deceleration to 7-8% nights growth excluding World Cup tailwinds would signal demand-side fragility worth pricing into your forecast.
Metric 3 — Average Daily Rate: predicted "moderate" (Airbnb), AirROI predicted +11–37% by-market range; actual platform +9%, AirROI 8-market range +9–23%
The April 14 piece predicted ADR would surprise to the upside given AirROI's by-market data. It did. Airbnb's reported +9% platform ADR (or +4% excluding foreign exchange) sits at the bottom edge of AirROI's 8-market range of +9% to +23%. Every market we sampled exceeded or matched the platform headline.
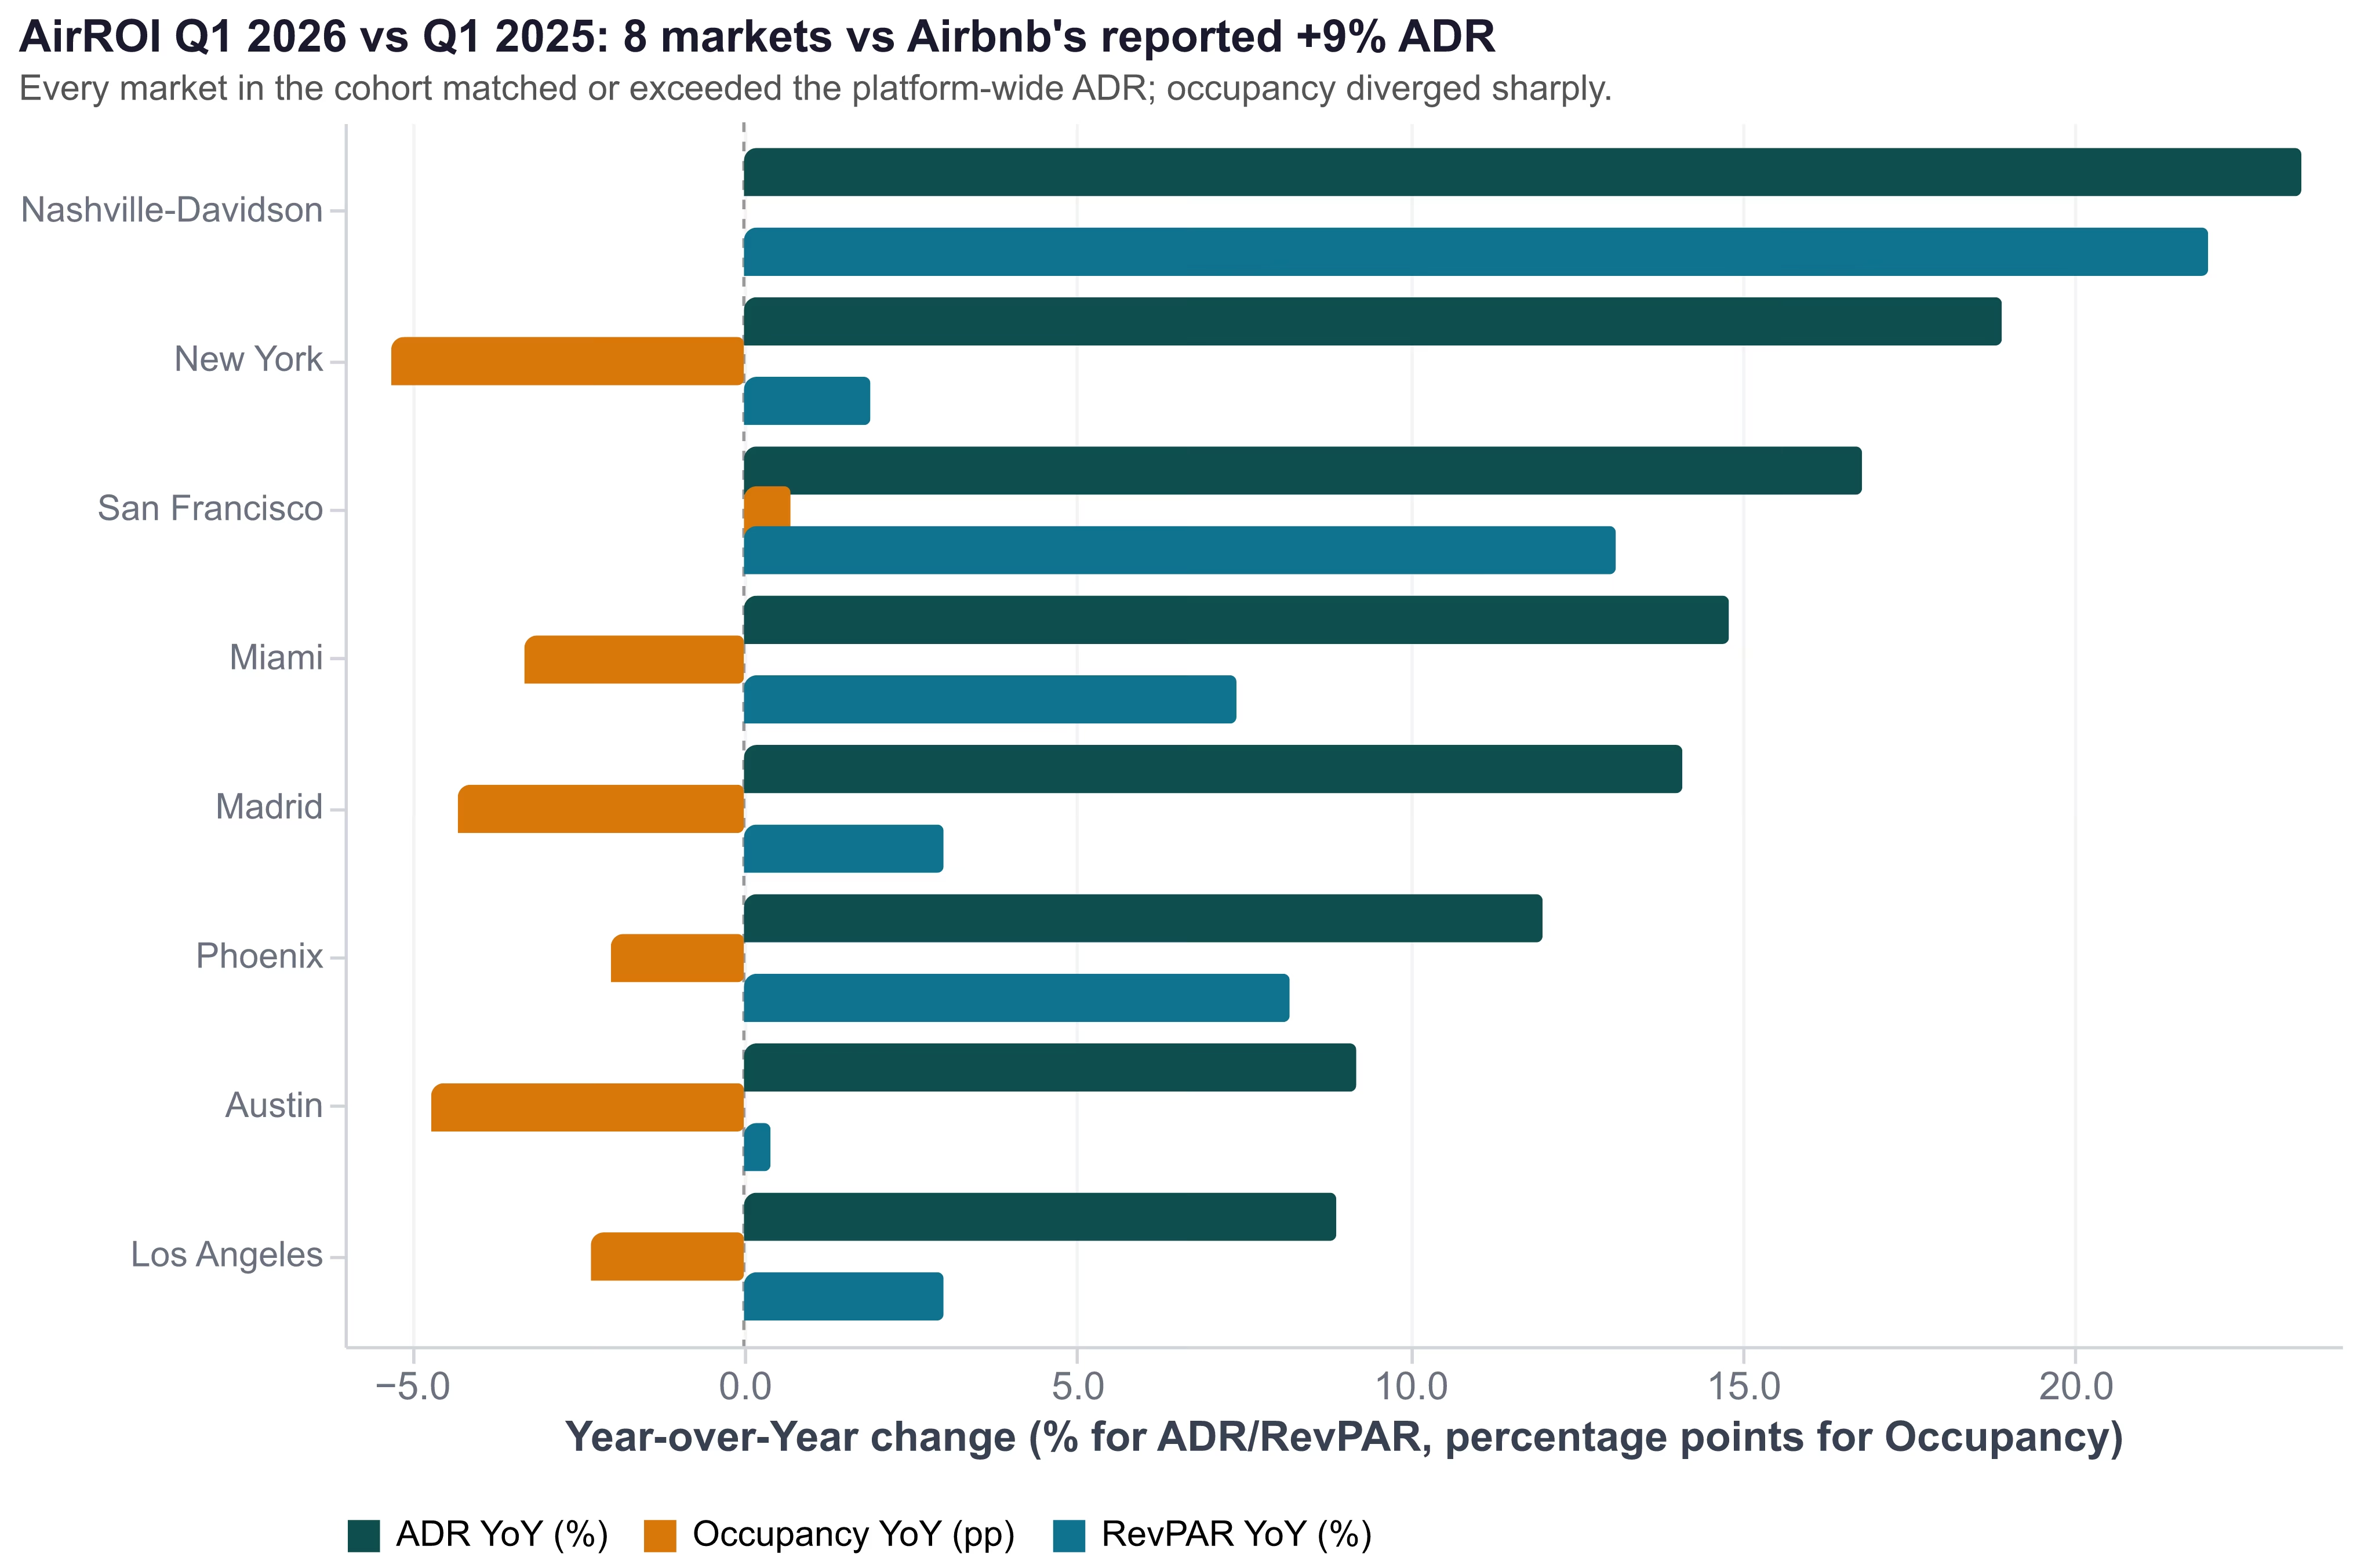
| Market | Q1 2025 → Q1 2026 ADR | ADR YoY | Occupancy YoY (pp) | RevPAR YoY |
|---|---|---|---|---|
| Nashville-Davidson | $272 → $336 | +23.4% | +0.0pp | +22.0% |
| New York | $191 → $227 | +18.9% | -5.3pp | +1.9% |
| San Francisco | $249 → $291 | +16.8% | +0.7pp | +13.1% |
| Miami | $291 → $334 | +14.8% | -3.3pp | +7.4% |
| Madrid | $152 → $174 (USD) | +14.1% | -4.3pp | +3.0% |
| Phoenix | $307 → $344 | +12.0% | -2.0pp | +8.2% |
| Austin | $269 → $294 | +9.2% | -4.7pp | +0.4% |
| Los Angeles | $283 → $308 | +8.9% | -2.3pp | +3.0% |
Source: AirROI market metrics, January–March averages, USD basis
Three takeaways. First, Nashville-Davidson exemplifies the rate-discipline win: ADR up 23%, occupancy held flat, RevPAR up 22%. The April 14 prediction that Nashville would deliver the rate-driven-growth pattern in its purest form was confirmed almost exactly — and a 21% supply contraction (more on that below) gave compliant hosts the volume offset to make it stick. Second, San Francisco is the cohort outlier: it is the only market that grew both ADR (+17%) and occupancy (+0.7pp), producing a +13% RevPAR lift driven by a structurally short market intersecting with returning corporate travel demand. Third, Austin and Los Angeles tracked the platform headline at +9% ADR, but Austin's 5pp occupancy drop produced effectively flat RevPAR — a warning sign for Q2.
Metric 4 — Take Rate: predicted "up slightly," actual "modest upside" guided plus 25%+ migrated to single fee
The take rate metric outperformed the predicted "up slightly" framing not in the Q1 print but in the forward narrative. CFO Mertz explicitly told analysts:
"You should see modest upside to our take rate from both the migration to the single fee structure as well as our insurance program." — Ellie Mertz, CFO, Airbnb Q1 2026 earnings call
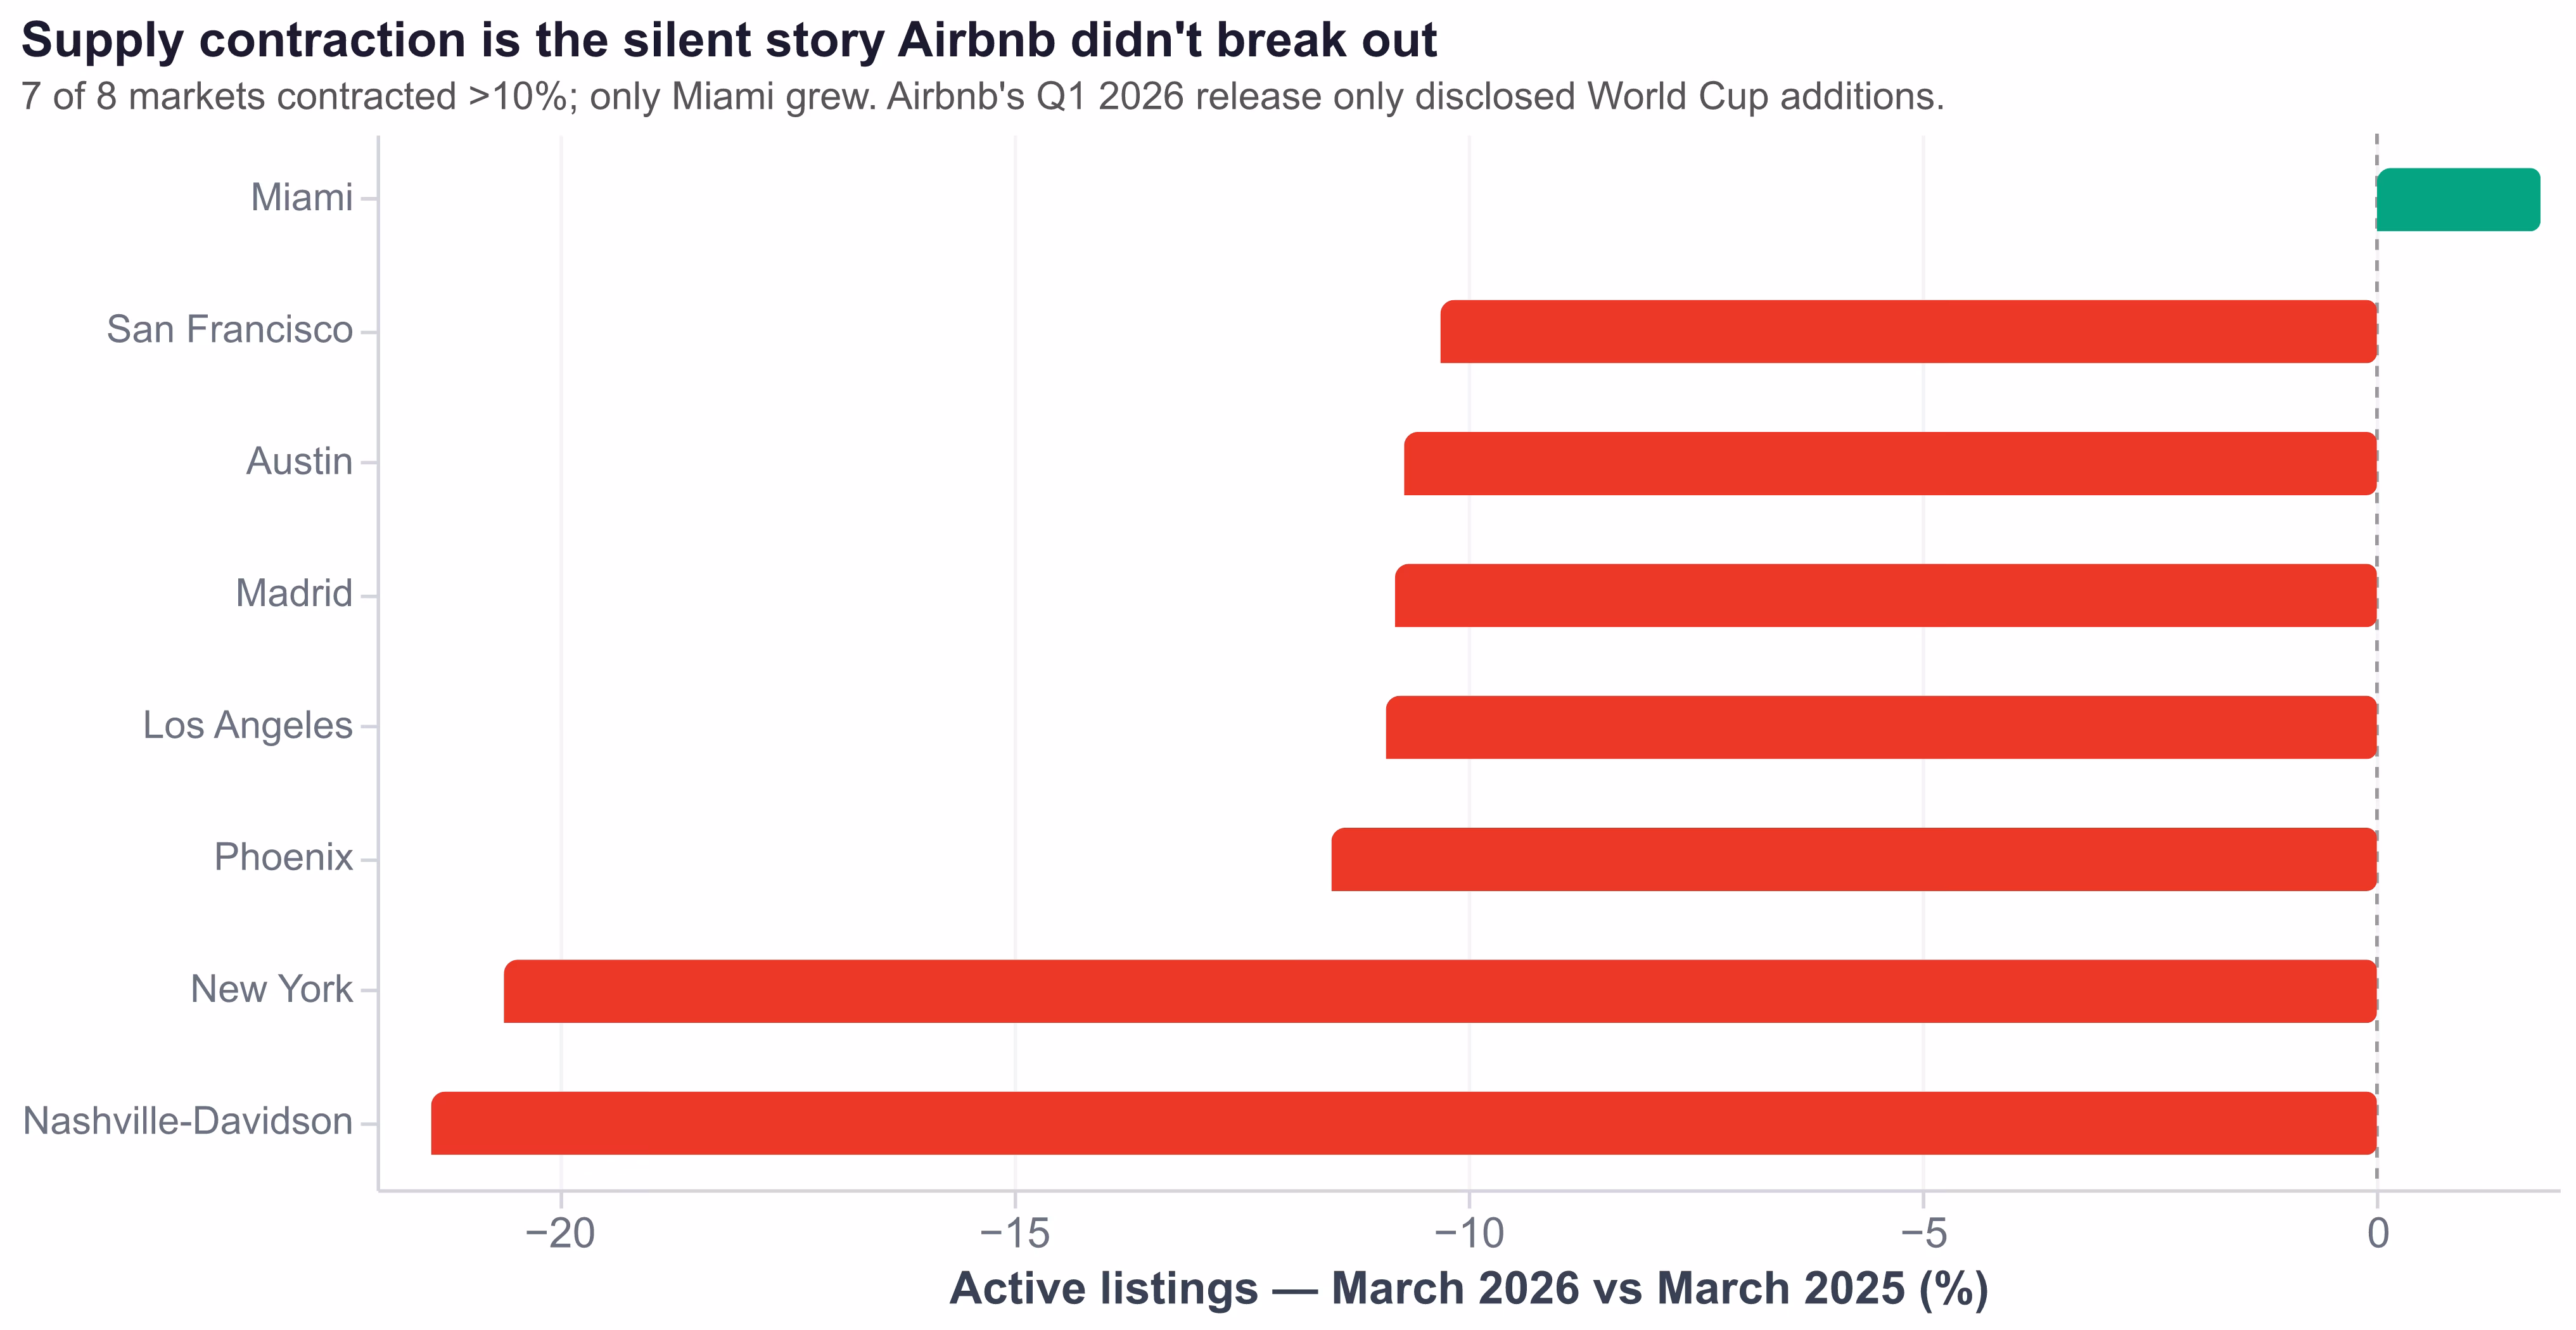
Metric 5 — Active Listings: predicted ~9M global with 550k+ removed since 2023, actual partial — only World Cup additions broken out
This is the prediction that aged worst, and the reason is informative. Airbnb chose to break out only the World Cup-related additions (over 100,000 new homes across 16 host cities) without disclosing platform-wide active-listing change for Q1 2026. The aggregate 9M figure remains the most recent public number; the rate of low-quality removal was not updated. Treat this disclosure choice as deliberate.
Hotels Are Now the Unmistakable Plan B
The single biggest strategic surprise in the Q1 2026 earnings call was the elevation of hotels from product test to platform priority. CFO Mertz framed the magnitude:
"Hotel room nights remain a single-digit percentage of total nights … the top-line metrics for hotels are growing more than double that of the entire business." — Ellie Mertz, CFO, Airbnb Q1 2026 earnings call
The growth differential matters. If overall booking volume is growing 9% and hotels are growing more than 18%, hotels will compound to a meaningful share of Airbnb's economics within 18-24 months — well before most STR hosts have repositioned. CEO Chesky added the strategic context: hotels could become a "multibillion-dollar revenue business" by capturing demand that arrives at Airbnb intending to book a home and finds none available, plus net-new business travel demand that has historically gone to OTAs and direct hotel sites. Of the guests who do book a hotel through Airbnb, 55% return to book a home — the cross-sell motion is already working.
The pilot markets are the part hosts cannot ignore: New York, Los Angeles, San Francisco, and Madrid. Every one of those is a market where Airbnb cannot easily grow STR supply because of regulation. Look at the structural overlap:
| Hotel pilot market | STR regulatory context | What hotel inventory backfills |
|---|---|---|
| New York | LL18 only allows hosted units; 20.6% YoY listing contraction in our data | Demand legal STRs cannot serve |
| Los Angeles | Vacation Rental Ordinance + 120-day cap on second homes | Demand restricted from second-home STRs |
| San Francisco | 90-day primary-residence cap; high enforcement | Demand in a structurally short market |
| Madrid | EU Reg 2024/1028 effective May 20; Spain €64M fine; Barcelona phase-out | Demand actively shedding non-compliant supply |
The strategic read: Airbnb is building hotel inventory exactly where independent STR supply is regulated down. Compliant hosts in these cities face new in-platform competition, but the hotel pilot is mostly additive to existing demand rather than displacing legal STR inventory. For non-compliant hosts (or hosts in markets that may move toward similar regulation), the hotel pilot establishes that Airbnb has a backup supply strategy that does not require winning the political fight on STR rules.
The 15.5% Single Host Fee, Six Months In
The single 15.5% host service fee began rolling out in late 2025; six months later, over 25% of Airbnb's active listings have migrated. CFO Mertz said the company will "expand to more hosts this year." Combined with the new insurance program rolling out alongside, the structural take-rate uplift is the single most quantifiable host-side cost change of 2026.
Walk the math on a $1,000 booking under each structure:
- Old split fee (host ~3% + guest ~14%): Host saw a $30 deduction from payout. Guest paid a separate $140 service fee on top, which was visible at checkout but did not reduce host payout.
- New single 15.5% fee: Host sees a single $155 deduction from payout. Guest sees a cleaner total price upfront.
The net economics are roughly similar. The visibility is dramatically different. The structural shift, as one r/airbnb_hosts host paraphrased it on a UK rollout discussion thread, is that the first impression is "doesn't really change anything" and the second impression is "actually it changes everything — when guests see one number instead of two, they don't feel like they got hit with the service fee."
Airbnb's own framing is that the single fee improves booking conversion by removing checkout-time price surprises. From the host's side, that is product-design helpful but masks a clean accounting truth: the platform's take rate is now visible in a single line item, and management has guided that take rate will lift from here.
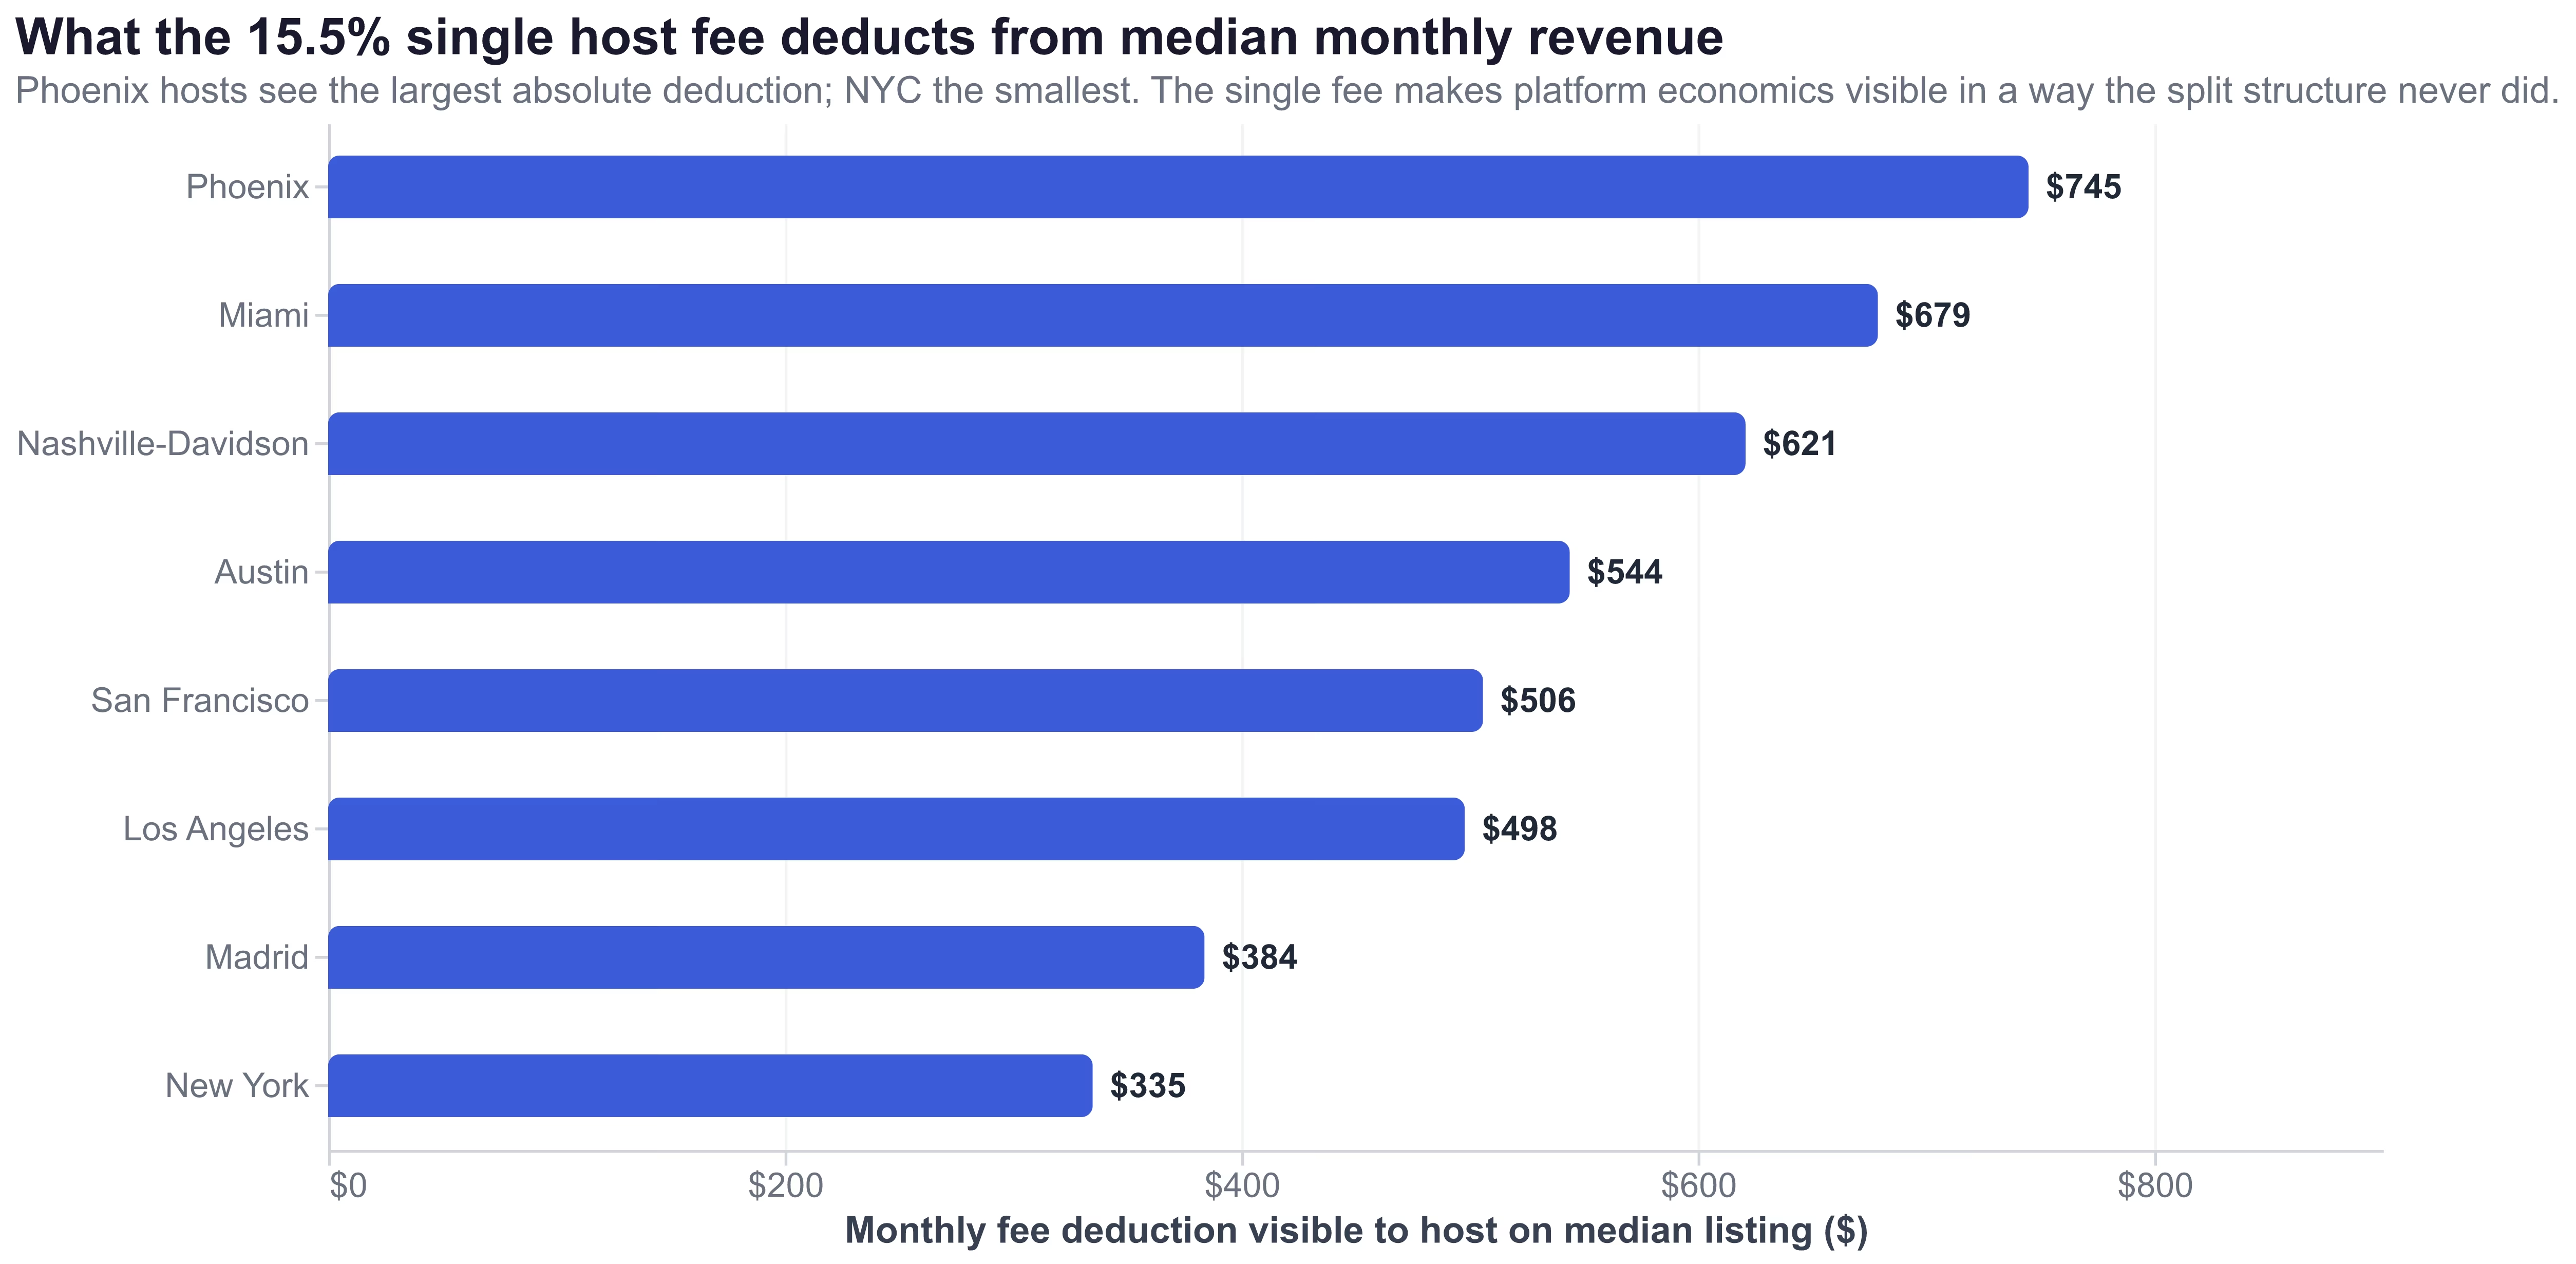
For median listings in our 8-market cohort, the visible monthly fee deduction at 15.5% on March 2026 median revenue is:
- Phoenix (median $4,806): $745 deducted
- Miami ($4,380): $679
- Nashville-Davidson ($4,007): $621
- Austin ($3,510): $544
- San Francisco ($3,266): $506
- Los Angeles ($3,213): $498
- Madrid ($2,478): $384
- New York ($2,160): $335
Reserve Now Pay Later at 20% of GBV — What the Cash-Flow Shift Means
Both numbers are correct; they cover different denominators. The 20% global GBV figure is the universe-wide share. The 70%+ figure is the within-eligible share in the largest market. The combination tells you that when guests can book with $0 down on a flexible-policy listing, they overwhelmingly do.
"In every market that we have launched Reserve Now, Pay Later, there is a material lift to gross bookings." — Ellie Mertz, CFO, Airbnb Q1 2026 earnings call
For hosts, three operational shifts matter. First, cancellation policy choice now interacts directly with RNPL exposure. Strict-policy hosts are excluded from the eligible universe entirely — which protects their ADR and reduces volatility but cedes the RNPL booking lift. Moderate or flexible-policy hosts are inside the eligible universe and capture the lift but inherit a different cancellation profile (RNPL bookings have measurably higher cancellation rates than fully-prepaid bookings). Second, pre-stay cash-flow timing is delayed for RNPL bookings. Plan operating expense outflows accordingly — particularly cleaning and supply prepay. Third, the demographic tilt of RNPL guests is younger and more impulse-driven than the typical moderate-policy guest, which has implications for screening, instant-book settings, and house rules clarity.
The April 14 piece noted that RNPL contributed roughly 200 basis points of nights growth in Q4 2025. Q1 2026 confirms the scale-up: RNPL is now structural to Airbnb's growth, not a marginal product enhancement.
Q2 2026 — The 100bp War Headwind in Plain English
Airbnb guided Q2 2026 revenue to $3.54-$3.60 billion (14-16% YoY growth), beating the $3.46B consensus. Inside that guidance, CFO Mertz flagged the explicit demand headwind:
"We expect year-over-year growth in nights and stays booked to decelerate slightly relative to the 9% growth we saw in Q1, inclusive of an approximate 100 basis point headwind related to the conflict." — Ellie Mertz, CFO, Airbnb Q1 2026 earnings call
In plain English: 100 basis points equals roughly 1 percentage point. Q2 nights and seats growth will print maybe 7-8% YoY instead of the 9-10% it would otherwise have hit. The drag concentrates in international travel demand, particularly to and through Middle East-adjacent corridors, with knock-on effects on European tourism flows.
For hosts in non-affected markets, the practical question is whether to price-defensively in Q2 to protect occupancy or hold rate discipline. The Q1 data answers this clearly: the markets that held rate (Nashville at +23% ADR, San Francisco at +17%) generated meaningfully higher RevPAR than the markets that drifted (Austin at +0.4% RevPAR despite +9% ADR, because occupancy dropped 4.7pp). Cutting nightly rates to chase Q2 occupancy in a softer demand environment is the worst available choice.
The demand offset is the FIFA World Cup. Airbnb said the tournament has already added "over 100,000 homes across 16 host cities" and characterized it as expected to be the largest event in company history. World Cup-driven booking acceleration will start showing up in Q2 results (with the tournament kicking off June 11 and most pre-stay reservations falling within the Q2 reporting period).
What We Got Right, What We Got Wrong — and What to Do About Q2
Four of five Q1 2026 predictions landed inside their target ranges. The miss is informative.
| Predicted (April 14) | Actual Q1 2026 | Verdict |
|---|---|---|
| GBV growth: low teens | $29.2B (+19% YoY) | Beat — direction right, magnitude undershot |
| Nights & seats: high single digit | 156.2M (+9% YoY, with 100bp headwind) | Hit — center of range |
| ADR: "moderate" platform; AirROI by-market +11–37% | +9% platform; AirROI 8-market range +9–23% | Hit — directionally and in magnitude |
| Take rate: "up slightly YoY" | "Modest upside" guided forward; 25%+ migrated to single fee | Hit |
| Active listings: ~9M global, 550k+ removed since 2023 | World Cup adds disclosed; aggregate not broken out | Partial — coverage gap is deliberate |
The active-listings miss matters because it is the metric where Airbnb has the most control over disclosure and chose to limit it. AirROI by-market data fills the gap: 7 of 8 markets contracted >10%, and the cohort-wide pattern is supply-tight, which is the precondition for the rate-discipline strategies that generated +22% Nashville RevPAR.
For Q2 2026, three host actions follow from the Q1 evidence:
-
Hold rate discipline through the war headwind. The Q1 data shows occupancy chasing destroys rate gains. Nashville and San Francisco hosts who held rates generated double-digit RevPAR growth; Austin hosts who drifted generated +0.4% RevPAR despite +9% ADR.
-
Audit your local market against the platform +9% ADR via AirROI Atlas. If your market grew +14-23% (Nashville, NYC, SF, Miami, Madrid in our cohort), you have pricing power the platform headline does not capture. If your market tracked the platform, the rate-discipline call is more nuanced — look at occupancy direction first.
-
Reprice for the 15.5% single fee. A 18.3% list-price uplift maintains net economics. With over 25% of listings already migrated and management guiding to "modest upside" in take rate, the visible-fee math is now baseline, not optional.
Three new strategic threads — hotels expansion, single-fee take rate uplift, Q2 war headwind — deserve repeated attention through 2026. We will publish another recap after Q2 2026 earnings (likely early August), continuing the prediction-then-recap structure for the host-impact lens that financial press coverage skips.
Frequently Asked Questions
Airbnb posted $2.68 billion in Q1 2026 revenue (+18% YoY), beating the $2.62B consensus, with EPS of $0.26 (missing the $0.29 estimate), $29.2B in gross booking value (+19% YoY), and 156.2 million nights and seats booked (+9% YoY, including an approximate 100 basis point headwind from the Middle East conflict). Adjusted EBITDA hit $519M (+24% YoY) and the company raised full-year revenue growth guidance to low-to-mid teens.
Airbnb's hotel inventory is growing more than 2x the rest of the business and pilots are concentrated in NYC, Los Angeles, San Francisco, and Madrid — every one a regulation-restricted market where independent STR supply is contracting. Compliant hosts in these cities face new in-platform competition, but most hotel inventory is filling demand that constrained STR supply cannot legally serve. CEO Brian Chesky said hotels could become a multibillion-dollar revenue business and 55% of hotel bookers return to book a home.
Over 25% of Airbnb's active listings have already migrated to the new 15.5% single host service fee, replacing the previous split-fee model where hosts paid roughly 3% and guests paid a separate 14%. CFO Ellie Mertz guided that hosts will see modest upside in Airbnb's take rate from the migration plus the new insurance program. On a $1,000 booking, hosts now see a single $155 fee deducted from their payout — to maintain net economics under the visible structure, hosts need to raise listed prices by approximately 18.3%.
Reserve Now Pay Later represented approximately 20% of global gross booking value in Q1 2026, with 70%+ adoption among eligible bookings in the United States according to analyst notes from Wells Fargo and Oppenheimer. The two figures cover different denominators — 20% is the global all-bookings share, while 70% is the share of bookings on listings with moderate or flexible cancellation policies, which are the only ones eligible. CFO Ellie Mertz said the program drives a material lift to gross bookings in every market it launches.
Airbnb raised full-year 2026 revenue growth guidance to low-to-mid teens, up from a prior 12% target, and reaffirmed adjusted EBITDA margin of at least 35%. Q2 2026 revenue is guided to $3.54-$3.60 billion (14-16% YoY growth), beating the $3.46B consensus despite an approximate 100 basis point headwind to nights and seats from the Middle East conflict.