AirROI ranking · 202654 markets ranked
Best Places to Buy an Airbnb in Sicily, Italy (2026)
Taormina is the best place to buy an Airbnb in Sicily in 2026, according to AirROI's ranking of 54 markets. Its listings averaged €30,900 in revenue over the 12 months to October 2026 and were booked on 46% of nights. It leads on the blend rather than on any one measure, placing 2nd of 54 for revenue per listing, 4th of 54 for occupancy and 6th of 54 for market size. Cefalù and Castellammare del Golfo come next.
- Markets tracked
- 172
- Active Airbnb listings
- 32,000
- Avg. revenue per listing
- €13,800
- Occupancy rate
- 38%
- Avg. nightly rate
- €150
- Revenue change, typical market
- +13%
The short answer
Sicily Airbnb Market at a Glance
Across Sicily, the 32,000 active Airbnb listings tracked by AirROI, a short-term-rental data firm, averaged €13,800 over the same period. They were booked on 38% of nights at about €150 a night; the ranking covers the 54 markets with at least 100 active listings. Revenue per listing rose in 49 of the 53 ranked markets with a comparable year of data, by 13% in the typical one.
The ranking weighs revenue per listing most, then occupancy and market size, then how evenly income spreads across the year and how it changed on the year. It reflects rental performance, not purchase prices or local short-term rental rules. Most listings in every one of the 54 ranked markets display a registration number, so confirm the local rules for any address you consider. How the ranking works.
Where the top 10 Airbnb markets in Sicily are
Each dot is one of the 172 markets AirROI tracks in Sicily (6 outlying ones fall outside the map), sized by active listings and coloured by average revenue per listing. Select a number to jump to its profile.
Money figures on this page are in euros, converted from US dollars at €0.86 per US$, the typical rate from November 2025 to October 2026.
Top 10
The Top 10 Airbnb Markets in Sicily
Each profile draws on the market's full AirROI report: how it earns, when in the year, who books and what sells. Monthly figures are averages per listing active in that month, so twelve of them add up to more than the annual average, which also counts listings that operated for only part of the year.
| # | Market | Avg. revenue | Occupancy |
|---|---|---|---|
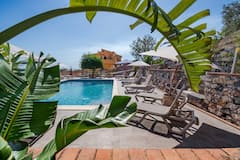 Taormina High earnings · High occupancy | €30,900 | 46% | |
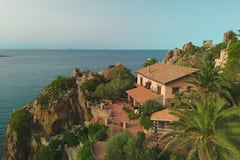 Cefalù High occupancy · High earnings | €20,700 | 47% | |
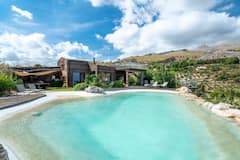 Castellammare del Golfo Large market · High earnings | €17,500 | 41% | |
| 4 | 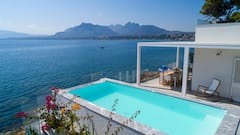 Santa Flavia High earnings · High occupancy | €21,300 | 46% |
| 5 |  Syracuse Large market · High earnings | €15,700 | 39% |
| 6 |  Palermo Large market · High occupancy | €13,500 | 43% |
| 7 |  Noto Large market · High earnings | €16,700 | 35% |
| 8 |  San Vito Lo Capo Large market · High occupancy | €13,800 | 40% |
| 9 |  Giarre Growing revenue · High earnings | €18,600 | 39% |
| 10 |  Giardini-Naxos High occupancy · Large market | €14,400 | 40% |
1. Taormina
Known for: High earnings · High occupancy
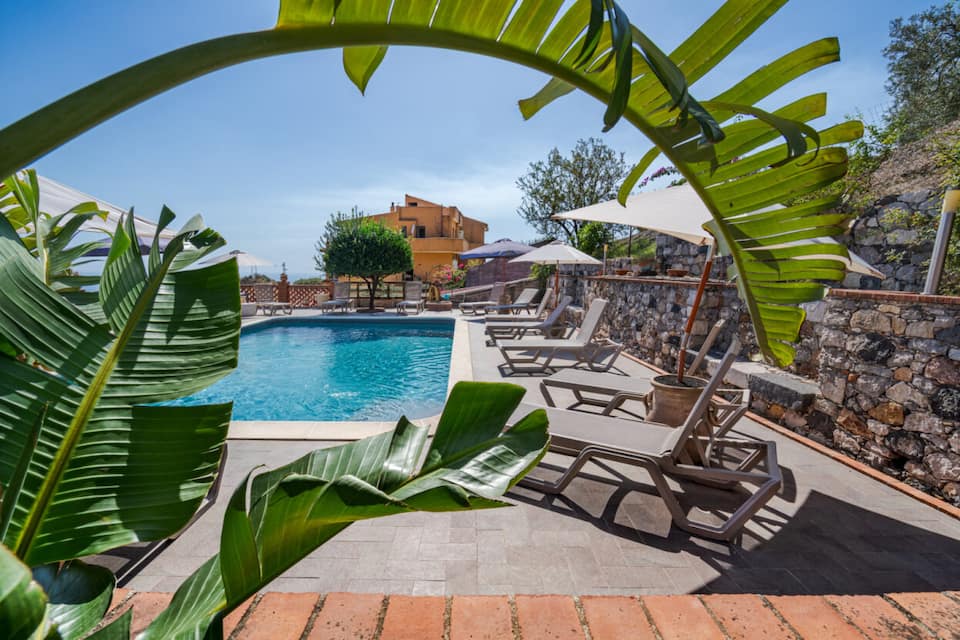
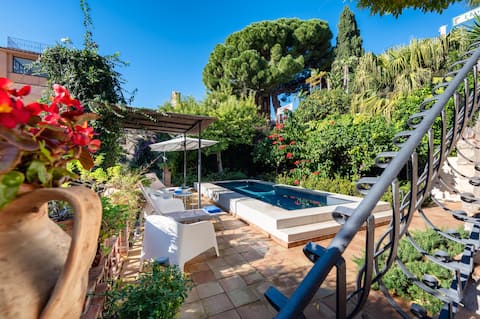
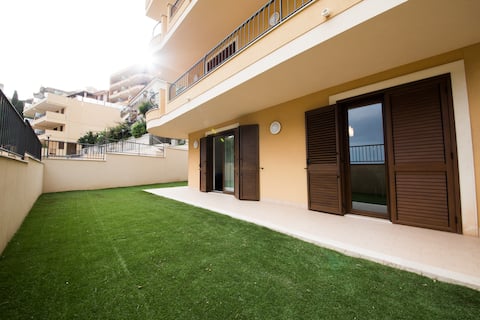
Top-earning Airbnb listings in Taormina - Avg. revenue
- €30,900 +9% vs. last year
- Occupancy
- 46%
- Nightly rate
- €245
- Active listings
- 1,030
Where it places among the 54 ranked markets in Sicily
- Revenue 2nd of 54
- Occupancy 4th of 54
- Market size 6th of 54
- Year-round 9th of 53
- Growth 34th of 53
- How it earns
- Taormina commands premium rates, about €245 a night, and still books 46% of nights, 8 points above the Sicily average. That adds up to €30,900 per listing over the year, the second-highest of the 54 ranked markets. A typical listing takes in about €2,550 a month; the top quarter clear €4,360 or more. Revenue per listing rose 9% over the year, helped by nightly rates 17% higher.
- When it earns
- Taormina's season runs from May to October, peaking in July at about €5,660 per listing; January, the quietest month, brings in about €1,440.
- Who books
- Nearly all guests come from abroad, led by visitors from the United States, the United Kingdom and Canada.
- What sells
- The most common entire home has 1 bedroom (46% of entire homes), and apartments and condos make up 68% of supply.
- Who it suits
- It suits buyers who can carry costs through a quiet January and can furnish and price for a premium stay.
Revenue per listing by month
€5,660 €1,440- Median listing
- €2,550/mo
- Top 25% of listings
- €4,360+/mo
- Booked ahead
- 70 days
- Average stay
- 4 nights
- Most common home size
- 1 bedroom
- Superhosts
- 56%
Areas in the full report: Historical Center · Isola Bella · Mazzarò
Full Taormina Airbnb report2. Cefalù
Known for: High occupancy · High earnings
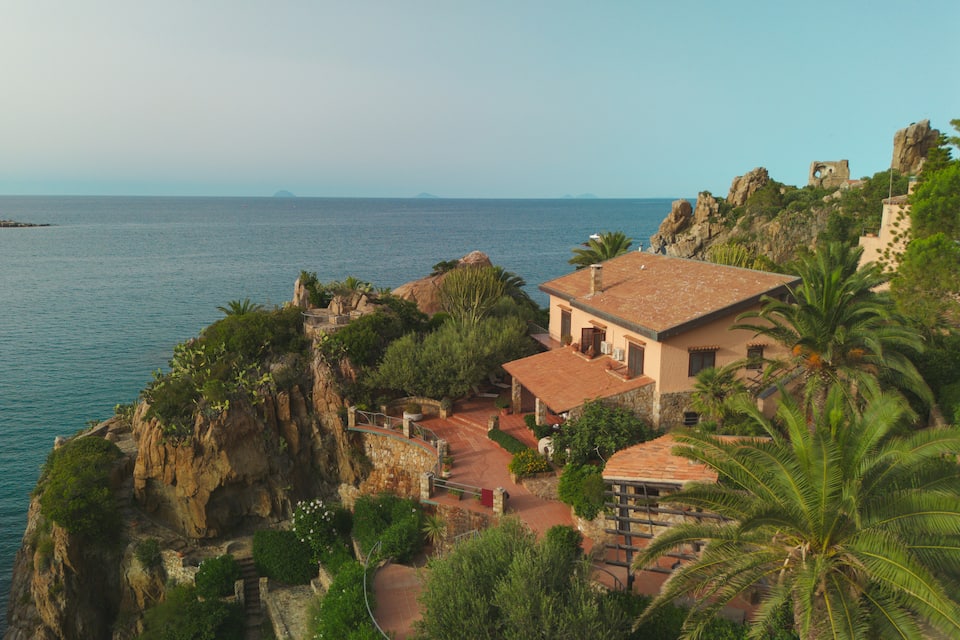
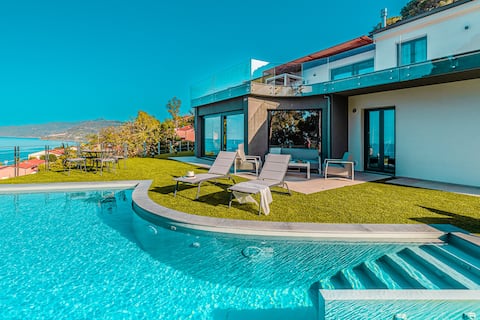
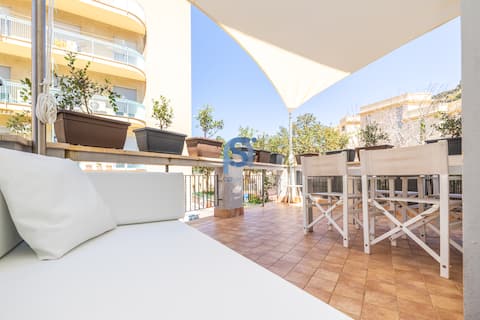
Top-earning Airbnb listings in Cefalù - Avg. revenue
- €20,700 +17% vs. last year
- Occupancy
- 47%
- Nightly rate
- €190
- Active listings
- 1,060
Where it places among the 54 ranked markets in Sicily
- Revenue 4th of 54
- Occupancy 2nd of 54
- Market size 5th of 54
- Year-round 23rd of 53
- Growth 15th of 53
- How it earns
- Cefalù fills more nights than most of Sicily: 47% of them, the second-highest occupancy of the 54 ranked markets, at about €190 a night. Listings averaged €20,700 in revenue over the year, the fourth-highest of the 54 ranked markets. In a typical month the median listing brings in about €1,980, and the best quarter clear €3,110. Revenue per listing rose 17% over the year, helped by nightly rates 13% higher.
- When it earns
- Revenue in Cefalù concentrates from May to September: August earns about €4,720 per listing, about 4.8 times as much as January.
- Who books
- Nearly all guests come from abroad, led by visitors from the United States, the United Kingdom and Germany.
- What sells
- One-bedroom homes lead the market (51% of entire homes), and apartments and condos make up 64% of supply.
- Who it suits
- Best for buyers who can ride out a slow January.
Revenue per listing by month
€4,720 €980- Median listing
- €1,980/mo
- Top 25% of listings
- €3,110+/mo
- Booked ahead
- 69 days
- Average stay
- 5 nights
- Most common home size
- 1 bedroom
- Superhosts
- 46%
Areas in the full report: Old Town · La Spiaggia · Via Roma
Full Cefalù Airbnb report3. Castellammare del Golfo
Known for: Large market · High earnings
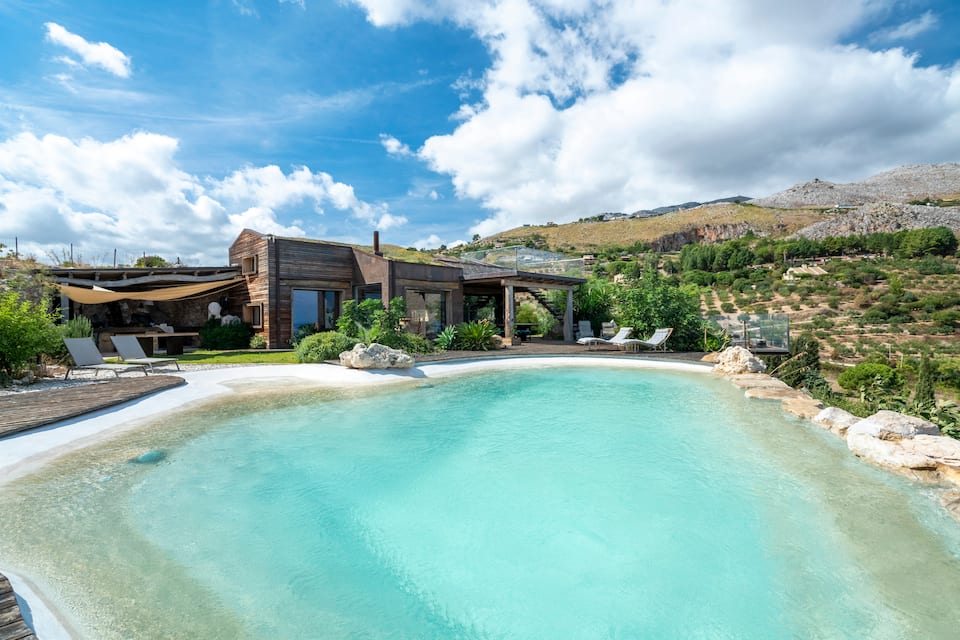
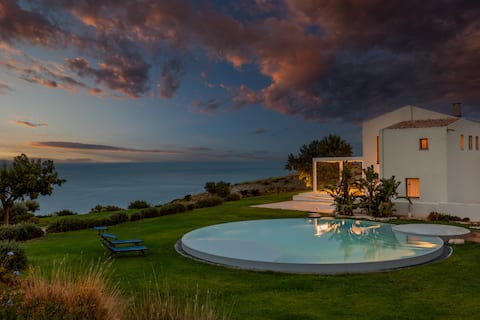

Top-earning Airbnb listings in Castellammare del Golfo - Avg. revenue
- €17,500 +18% vs. last year
- Occupancy
- 41%
- Nightly rate
- €185
- Active listings
- 1,080
Where it places among the 54 ranked markets in Sicily
- Revenue 6th of 54
- Occupancy 8th of 54
- Market size 4th of 54
- Year-round 18th of 53
- Growth 13th of 53
- How it earns
- Listings in Castellammare del Golfo are booked on 41% of nights, the eighth-highest occupancy of the 54 ranked markets, at about €185 a night. Average revenue per listing came to €17,500, the sixth-highest of the 54 ranked markets. Month to month, the median listing earns about €1,400 and a top-quarter listing €2,890 or more. Revenue per listing rose 18% over the year, helped by nightly rates 13% higher.
- When it earns
- In Castellammare del Golfo, the months from May to September earn above the yearly average, led by August at about €4,640 per listing; December is the low point at about €1,020.
- What sells
- The most common entire home has 1 bedroom (33% of entire homes), and houses make up 56% of supply.
- Who it suits
- A good fit for buyers who are prepared for thin bookings around December.
Revenue per listing by month
€4,640 €1,020- Median listing
- €1,400/mo
- Top 25% of listings
- €2,890+/mo
- Booked ahead
- 66 days
- Average stay
- 6 nights
- Most common home size
- 1 bedroom
- Superhosts
- 45%
Areas in the full report: Cala Petrolo · Scopello · Riserva Naturale dello Zingaro
Full Castellammare del Golfo Airbnb report4. Santa Flavia
Known for: High earnings · High occupancy
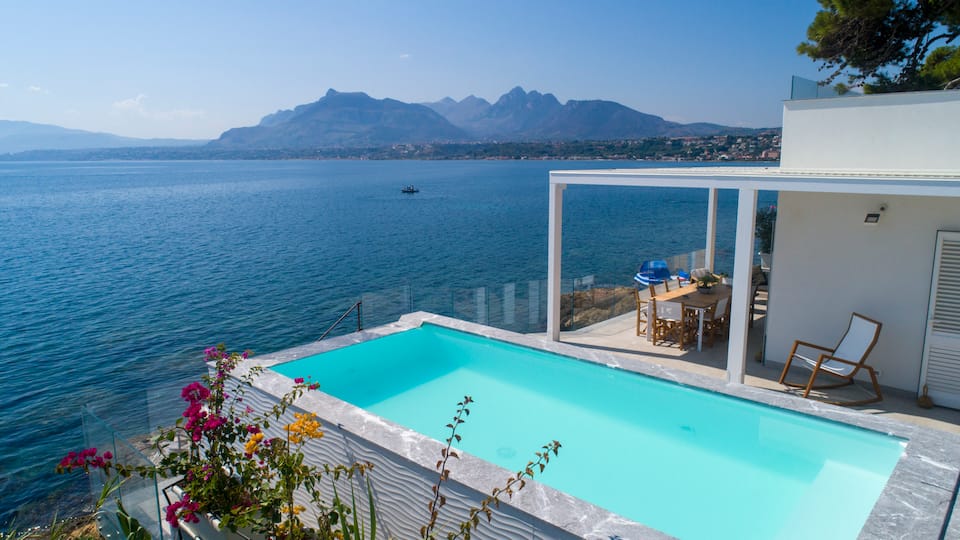


Top-earning Airbnb listings in Santa Flavia - Avg. revenue
- €21,300 +14% vs. last year
- Occupancy
- 46%
- Nightly rate
- €160
- Active listings
- 211
Where it places among the 54 ranked markets in Sicily
- Revenue 3rd of 54
- Occupancy 3rd of 54
- Market size 30th of 54
- Year-round 3rd of 53
- Growth 22nd of 53
- How it earns
- Demand runs high in Santa Flavia: 46% of nights booked, the third-highest occupancy of the 54 ranked markets, at about €160 a night. That adds up to €21,300 per listing over the year, the third-highest of the 54 ranked markets. A typical listing takes in about €1,680 a month; the top quarter clear €3,080 or more. Revenue per listing rose 14% over the year, helped by nightly rates 8% higher. With 211 listings it is a small market, so its averages can move more from year to year.
- When it earns
- Santa Flavia's season runs from May to October, peaking in August at about €4,320 per listing; January, the quietest month, brings in about €1,230.
- Who books
- Most guests come from abroad (95%), led by visitors from Germany, France and the United States.
- What sells
- Two-bedroom homes lead the market (41% of entire homes), and houses make up 47% of supply.
- Who it suits
- It suits buyers who can carry costs through a quiet January.
Revenue per listing by month
€4,320 €1,230- Median listing
- €1,680/mo
- Top 25% of listings
- €3,080+/mo
- Booked ahead
- 71 days
- Average stay
- 6 nights
- Most common home size
- 2 bedrooms
- Superhosts
- 50%
5. Syracuse
Known for: Large market · High earnings
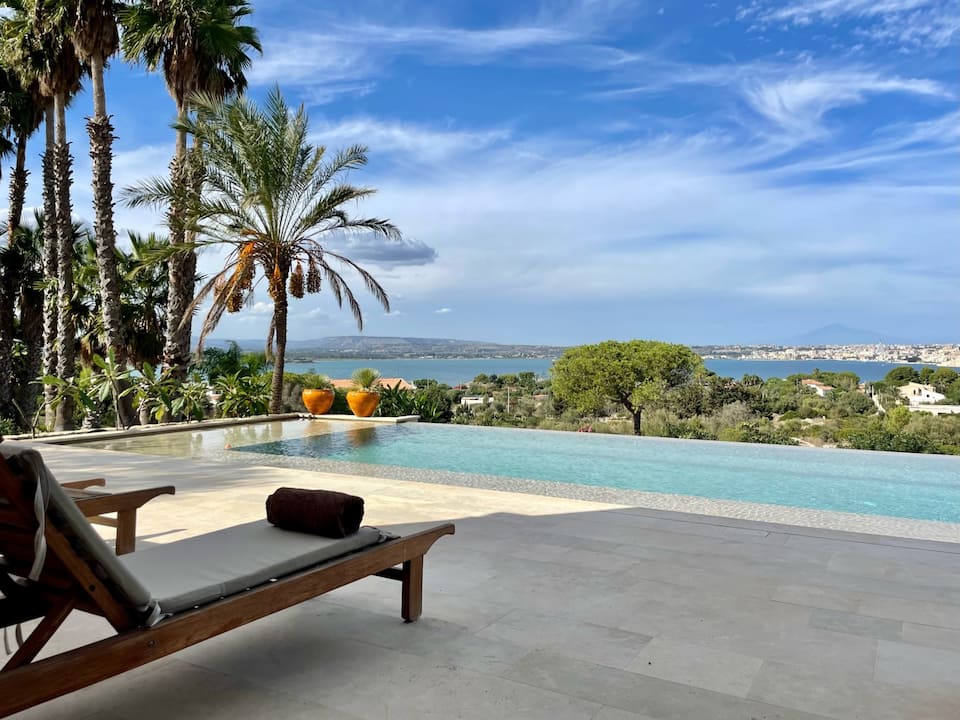
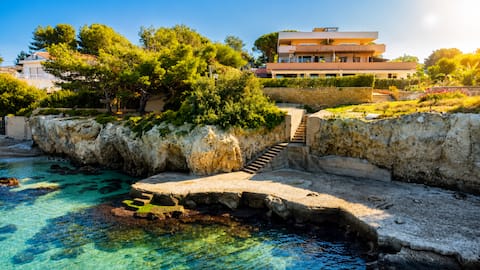
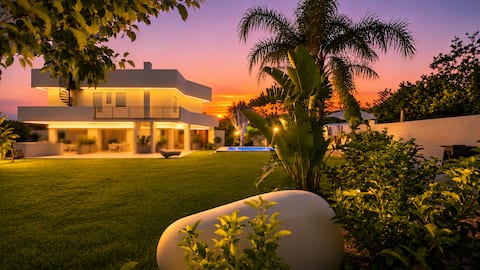
Top-earning Airbnb listings in Syracuse - Avg. revenue
- €15,700 +13% vs. last year
- Occupancy
- 39%
- Nightly rate
- €155
- Active listings
- 2,430
Where it places among the 54 ranked markets in Sicily
- Revenue 13th of 54
- Occupancy 14th of 54
- Market size 3rd of 54
- Year-round 6th of 53
- Growth 26th of 53
- How it earns
- Syracuse is Sicily's third-largest Airbnb market, with 2,430 active listings to price against. Listings averaged €15,700 in revenue over the year, 14% above the Sicily average. In a typical month the median listing brings in about €1,380, and the best quarter clear €2,420. Revenue per listing rose 13% over the year, helped by nightly rates 13% higher.
- When it earns
- Revenue in Syracuse concentrates from May to October: August earns about €3,350 per listing, about 3.7 times as much as January.
- What sells
- The most common entire home has 1 bedroom (51% of entire homes), and apartments and condos make up 59% of supply.
- Who it suits
- Best for buyers who can ride out a slow January.
Revenue per listing by month
€3,350 €895- Median listing
- €1,380/mo
- Top 25% of listings
- €2,420+/mo
- Booked ahead
- 62 days
- Average stay
- 5 nights
- Most common home size
- 1 bedroom
- Superhosts
- 42%
Areas in the full report: Ortigia · Neapolis · Talete
Full Syracuse Airbnb report6. Palermo
Known for: Large market · High occupancy
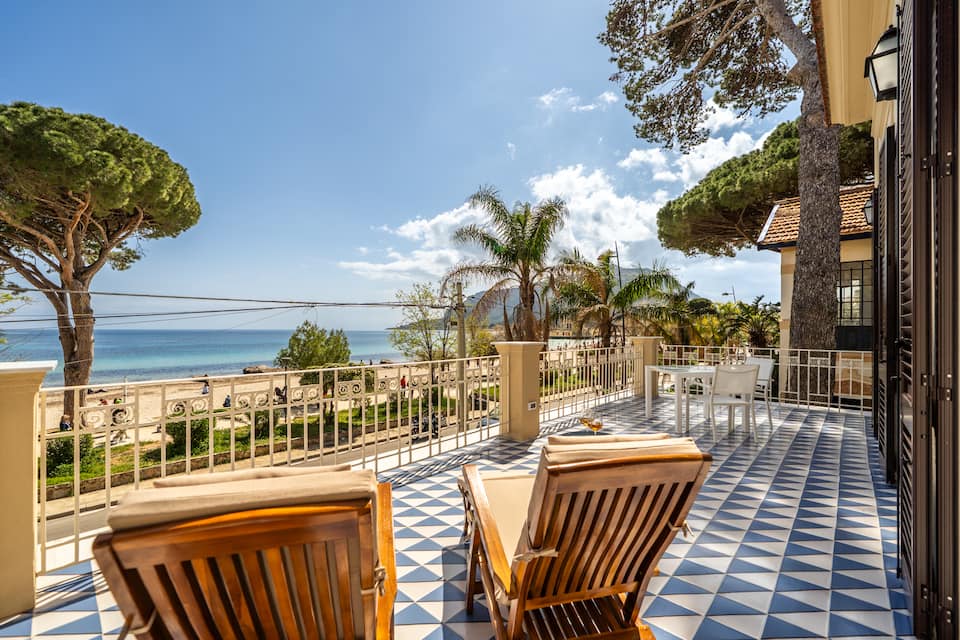

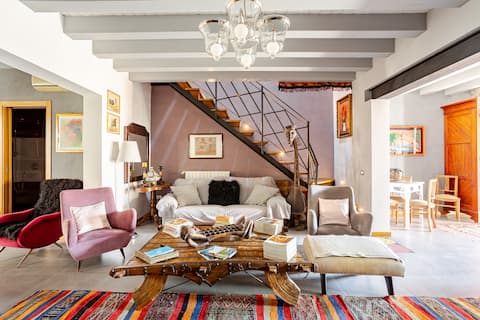
Top-earning Airbnb listings in Palermo - Avg. revenue
- €13,500 +15% vs. last year
- Occupancy
- 43%
- Nightly rate
- €120
- Active listings
- 5,160
Where it places among the 54 ranked markets in Sicily
- Revenue 24th of 54
- Occupancy 5th of 54
- Market size 1st of 54
- Year-round 3rd of 53
- Growth 21st of 53
- How it earns
- Palermo earns on volume. Rates run below the Sicily average at about €120 a night, but listings book 43% of nights. Revenue per listing, €13,500, is close to the Sicily average. Its place at #6 rests on market size (1st of 54) and year-round demand (3rd of 53) rather than on revenue per listing. Month to month, the median listing earns about €1,350 and a top-quarter listing €2,150 or more. Revenue per listing rose 15% over the year, helped by nightly rates 15% higher.
- When it earns
- In Palermo, the months from April to October earn above the yearly average, led by August at about €2,580 per listing; January is the low point at about €751. Most hosts take one- or two-night bookings (76% of listings), more than in the typical market.
- What sells
- One-bedroom homes lead the market (56% of entire homes), and apartments and condos make up 77% of supply.
- Who it suits
- A good fit for buyers who are prepared for thin bookings around January and would rather price for occupancy than for rate.
Revenue per listing by month
€2,580 €751- Median listing
- €1,350/mo
- Top 25% of listings
- €2,150+/mo
- Booked ahead
- 52 days
- Average stay
- 5 nights
- Most common home size
- 1 bedroom
- Superhosts
- 44%
Areas in the full report: Centro Storico · Mondello · Kalsa
Full Palermo Airbnb report7. Noto
Known for: Large market · High earnings
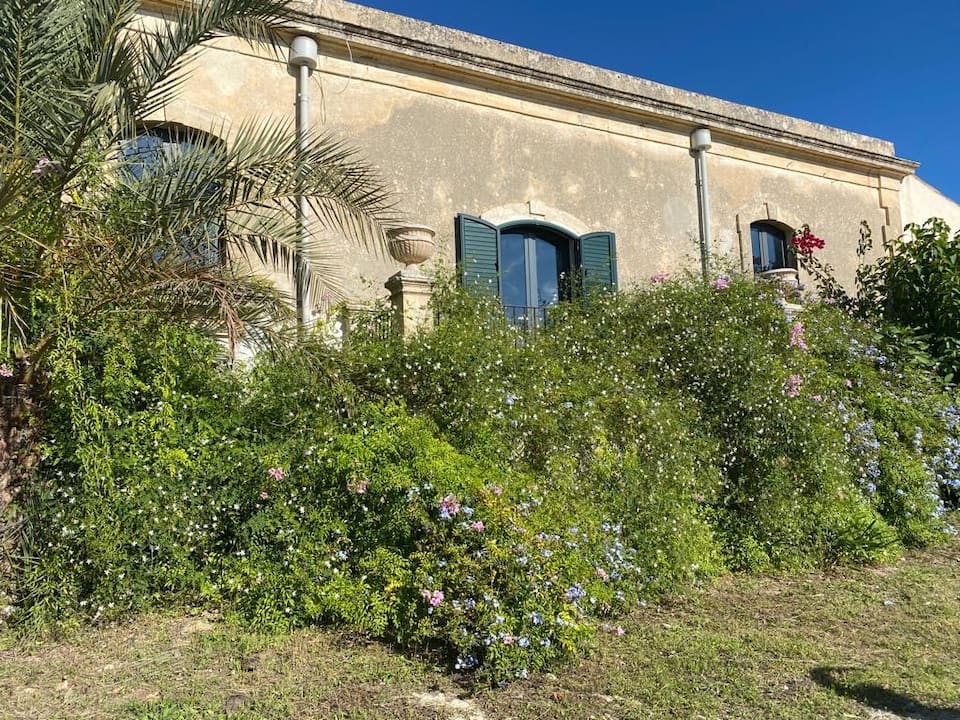
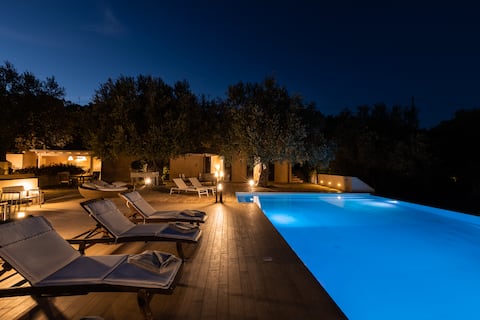

Top-earning Airbnb listings in Noto - Avg. revenue
- €16,700 +13% vs. last year
- Occupancy
- 35%
- Nightly rate
- €210
- Active listings
- 853
Where it places among the 54 ranked markets in Sicily
- Revenue 9th of 54
- Occupancy 35th of 54
- Market size 8th of 54
- Year-round 10th of 53
- Growth 27th of 53
- How it earns
- Noto listings charge about €210 a night, 39% above the Sicily average, and are booked on 35% of nights. That adds up to €16,700 per listing over the year, the ninth-highest of the 54 ranked markets. The gap between listings is wide: a typical one takes in about €1,340 a month, while the top quarter clear €2,920 and the top 10% €5,950, so pricing and presentation count for more here than in most of Sicily. Revenue per listing rose 13% over the year, helped by nightly rates 18% higher.
- When it earns
- Noto's season runs from June to October, peaking in August at about €4,460 per listing; February, the quietest month, brings in about €1,070.
- What sells
- The most common entire home has 2 bedrooms (38% of entire homes), and houses make up 62% of supply.
- Who it suits
- It suits buyers who can carry costs through a quiet February.
Revenue per listing by month
€4,460 €1,070- Median listing
- €1,340/mo
- Top 25% of listings
- €2,920+/mo
- Booked ahead
- 63 days
- Average stay
- 6 nights
- Most common home size
- 2 bedrooms
- Superhosts
- 39%
Areas in the full report: Centro Storico · La Cattedrale · Spiaggia di Noto
Full Noto Airbnb report8. San Vito Lo Capo
Known for: Large market · High occupancy
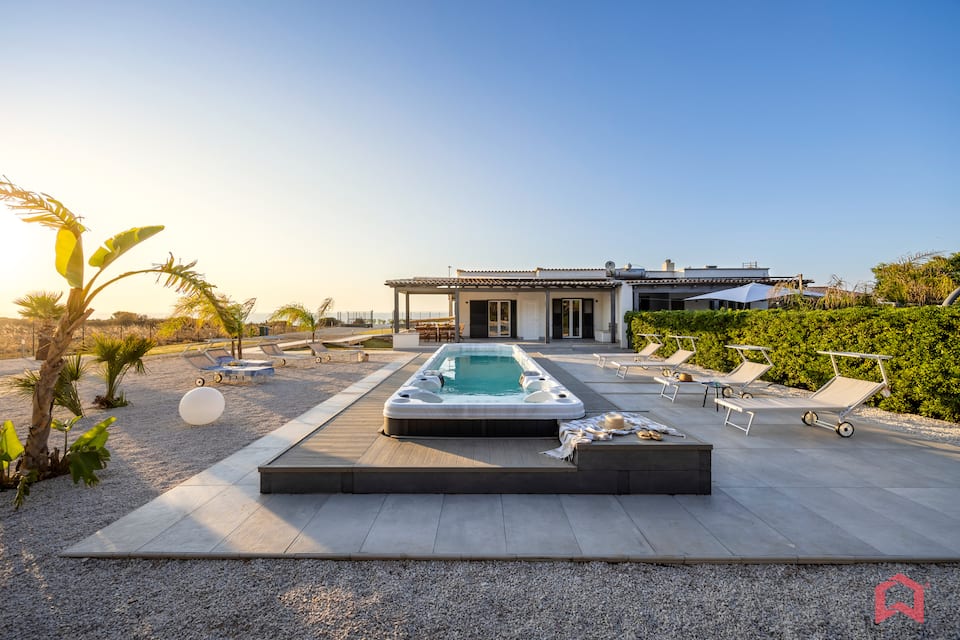
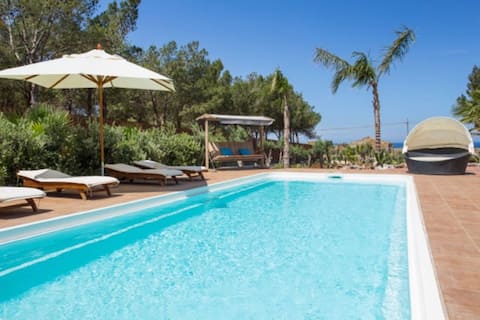

Top-earning Airbnb listings in San Vito Lo Capo - Avg. revenue
- €13,800 +15% vs. last year
- Occupancy
- 40%
- Nightly rate
- €160
- Active listings
- 856
Where it places among the 54 ranked markets in Sicily
- Revenue 22nd of 54
- Occupancy 9th of 54
- Market size 7th of 54
- Year-round 26th of 53
- Growth 19th of 53
- How it earns
- San Vito Lo Capo books 40% of nights at about €160 a night, close to the typical market in Sicily. Revenue per listing, €13,800, is close to the Sicily average. A typical listing takes in about €1,510 a month; the top quarter clear €2,530 or more. Revenue per listing rose 15% over the year, helped by nightly rates 18% higher.
- When it earns
- Revenue in San Vito Lo Capo concentrates from June to September: August earns about €4,170 per listing, about 5.2 times as much as January.
- Guest expectations
- Average ratings (4.71 stars) trail the typical market in Sicily (4.78), which leaves room for a well-run listing to stand out.
- Who books
- Most guests come from abroad (83%), led by visitors from Germany, France and the United Kingdom.
- Who it suits
- Best for buyers who can ride out a slow January.
Revenue per listing by month
€4,170 €805- Median listing
- €1,510/mo
- Top 25% of listings
- €2,530+/mo
- Booked ahead
- 64 days
- Average stay
- 6 nights
- Most common home size
- 2 bedrooms
- Superhosts
- 35%
Areas in the full report: Cala Mancina · San Vito Lo Capo Town Center · Riserva Naturale dello Zingaro
Full San Vito Lo Capo Airbnb report9. Giarre
Known for: Growing revenue · High earnings
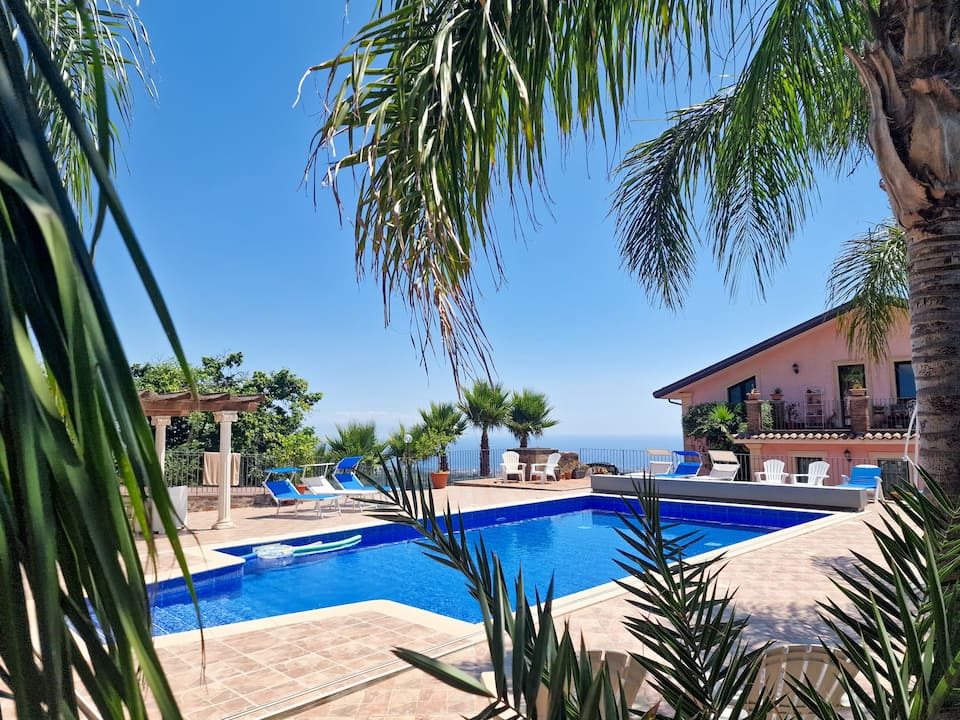
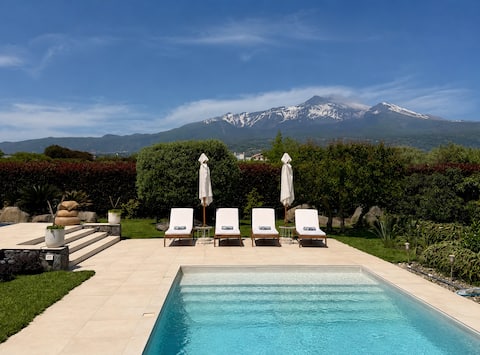

Top-earning Airbnb listings in Giarre - Avg. revenue
- €18,600 +27% vs. last year
- Occupancy
- 39%
- Nightly rate
- €185
- Active listings
- 100
Where it places among the 54 ranked markets in Sicily
- Revenue 5th of 54
- Occupancy 21st of 54
- Market size 53rd of 54
- Year-round 8th of 53
- Growth 3rd of 53
- How it earns
- Giarre listings charge about €185 a night, 24% above the Sicily average, and are booked on 39% of nights. Average revenue per listing came to €18,600, the fifth-highest of the 54 ranked markets. In a typical month the median listing brings in about €1,450, and the best quarter clear €2,790. Revenue per listing rose 27% over the year, the third-biggest gain in Sicily, helped by nightly rates 23% higher. Its 100 listings make it one of the smaller ranked markets, so its figures are less settled than those of larger ones.
- When it earns
- In Giarre, the months from April to September earn above the yearly average, led by July at about €3,730 per listing; February is the low point at about €967.
- What sells
- Two-bedroom homes lead the market (36% of entire homes), and houses make up 57% of supply.
- Who it suits
- A good fit for buyers who are prepared for thin bookings around February.
Revenue per listing by month
€3,730 €967- Median listing
- €1,450/mo
- Top 25% of listings
- €2,790+/mo
- Booked ahead
- 62 days
- Average stay
- 5 nights
- Most common home size
- 2 bedrooms
- Superhosts
- 49%
10. Giardini-Naxos
Known for: High occupancy · Large market
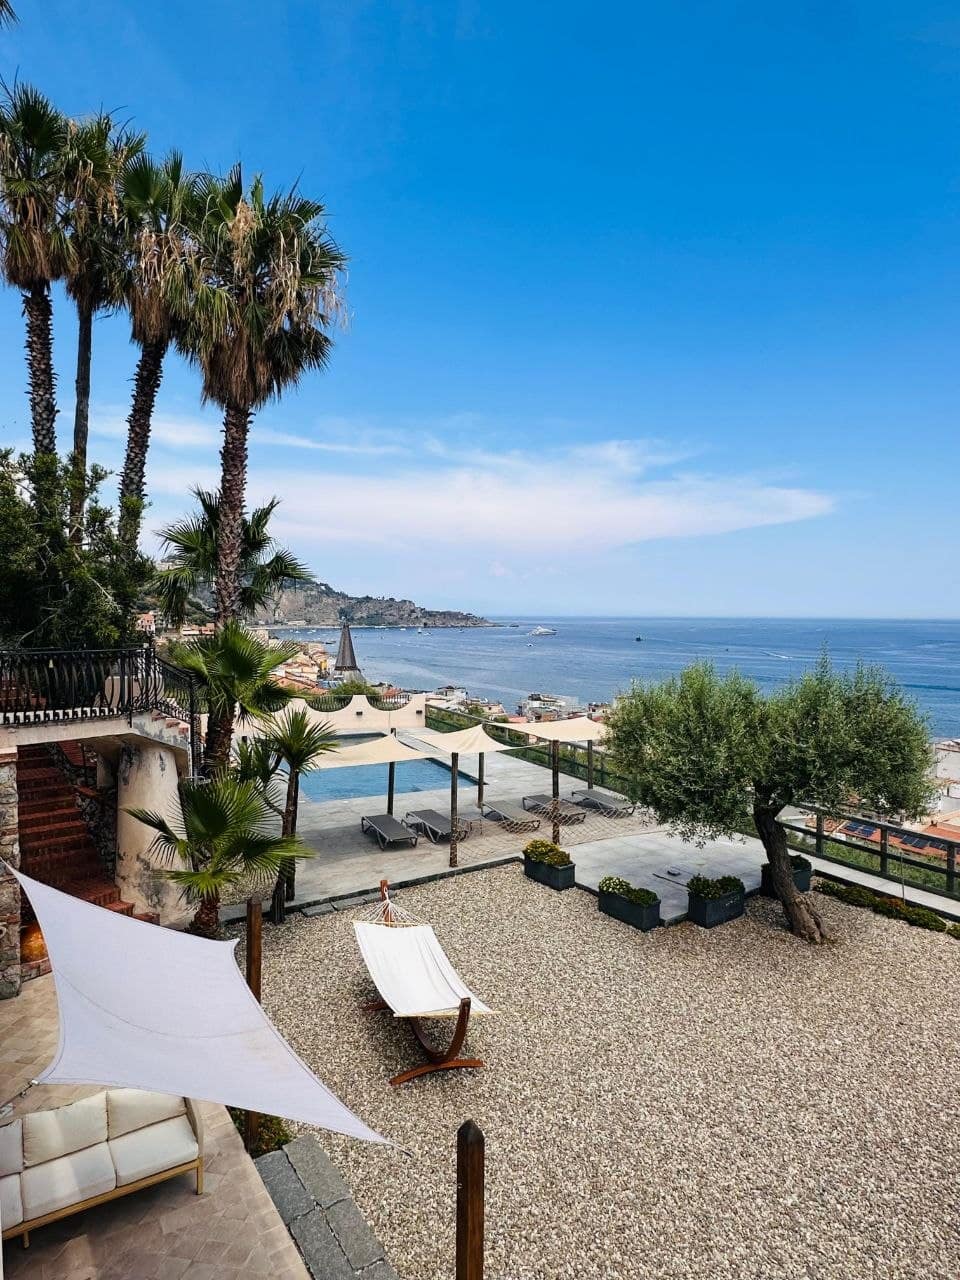
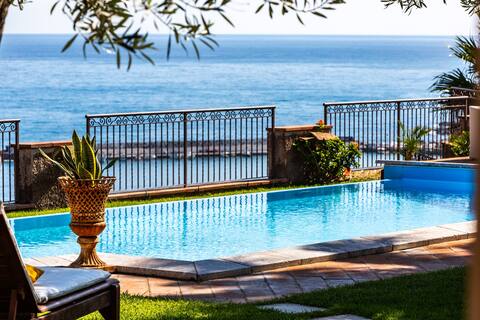
Top-earning Airbnb listings in Giardini-Naxos - Avg. revenue
- €14,400 +6% vs. last year
- Occupancy
- 40%
- Nightly rate
- €155
- Active listings
- 540
Where it places among the 54 ranked markets in Sicily
- Revenue 18th of 54
- Occupancy 10th of 54
- Market size 13th of 54
- Year-round 18th of 53
- Growth 41st of 53
- How it earns
- Giardini-Naxos books 40% of nights at about €155 a night, close to the typical market in Sicily. Revenue per listing, €14,400, is close to the Sicily average. Month to month, the median listing earns about €1,350 and a top-quarter listing €2,210 or more. Revenue per listing rose 6% over the year, helped by nightly rates 15% higher.
- When it earns
- Giardini-Naxos' season runs from May to September, peaking in August at about €3,530 per listing; February, the quietest month, brings in about €764.
- What sells
- The most common entire home has 1 bedroom (50% of entire homes), and apartments and condos make up 77% of supply.
- Who it suits
- It suits buyers who can carry costs through a quiet February.
Revenue per listing by month
€3,530 €764- Median listing
- €1,350/mo
- Top 25% of listings
- €2,210+/mo
- Booked ahead
- 57 days
- Average stay
- 5 nights
- Most common home size
- 1 bedroom
- Superhosts
- 37%
Areas in the full report: Giardini-Naxos Beach · Taormina Viewpoints · Via Nazionale
Full Giardini-Naxos Airbnb report
Full ranking
How All 54 Ranked Markets in Sicily Compare
The overall ranking with the five measures behind it. "Slow month" is a market's weakest month of revenue as a share of its best, so a higher figure means steadier income. Select a column heading to re-sort.
| Taormina High earnings, high occupancy | €30,867 | 46% | €244 | 25% | +9% | 1,028 | |
| Cefalù High occupancy, high earnings | €20,710 | 47% | €188 | 21% | +17% | 1,063 | |
| Castellammare del Golfo Large market, high earnings | €17,479 | 41% | €186 | 22% | +18% | 1,081 | |
| 4 | Santa Flavia High earnings, high occupancy | €21,327 | 46% | €161 | 29% | +14% | 211 |
| 5 | Syracuse Large market, high earnings | €15,735 | 39% | €157 | 27% | +13% | 2,428 |
| 6 | Palermo Large market, high occupancy | €13,544 | 43% | €120 | 29% | +15% | 5,162 |
| 7 | Noto Large market, high earnings | €16,685 | 35% | €211 | 24% | +13% | 853 |
| 8 | San Vito Lo Capo Large market, high occupancy | €13,815 | 40% | €162 | 19% | +15% | 856 |
| 9 | Giarre Growing revenue, high earnings | €18,626 | 39% | €187 | 26% | +27% | 100 |
| 10 | Giardini-Naxos High occupancy, large market | €14,446 | 40% | €153 | 22% | +6% | 540 |
| 11 | Aci Castello High occupancy, high earnings | €14,292 | 39% | €136 | 32% | +10% | 246 |
| 12 | Scicli High earnings, large market | €17,478 | 35% | €205 | 16% | +15% | 419 |
| 13 | Alcamo High earnings, high occupancy | €16,317 | 40% | €173 | 14% | +14% | 298 |
| 14 | Custonaci High occupancy, high earnings | €14,993 | 40% | €168 | 27% | +6% | 166 |
| 15 | Catania Large market, high occupancy | €10,832 | 39% | €101 | 37% | +9% | 2,953 |
| 16 | Augusta High earnings | €17,451 | 37% | €189 | 19% | +7% | 277 |
| 17 | Trapani Growing revenue, large market | €10,043 | 39% | €112 | 24% | +22% | 761 |
| 18 | Riposto High earnings, growing revenue | €15,742 | 38% | €144 | 24% | +18% | 115 |
| 19 | Letojanni Growing revenue, high earnings | €14,635 | 38% | €191 | 22% | +36% | 154 |
| 20 | Terrasini Growing revenue, high earnings | €14,857 | 36% | €159 | 18% | +25% | 218 |
| 21 | Acireale High earnings | €14,077 | 35% | €152 | 23% | +14% | 281 |
| 22 | Partinico High earnings, growing revenue | €32,087 | 39% | €365 | 11% | +19% | 100 |
| 23 | Favignana Growing revenue, high occupancy | €12,352 | 42% | €165 | 12% | +26% | 414 |
| 24 | Avola Large market | €12,781 | 37% | €171 | 21% | +7% | 532 |
| 25 | Lipari Large market, growing revenue | €10,560 | 37% | €155 | 18% | +15% | 734 |
| 26 | Metropolitan City of Palermo High occupancy | €10,551 | 49% | €109 | – | – | 198 |
| 27 | Menfi Growing revenue, high earnings | €14,252 | 35% | €180 | 22% | +15% | 149 |
| 28 | Ispica High earnings | €16,624 | 34% | €224 | 18% | −7% | 191 |
| 29 | Ragusa Large market | €13,262 | 32% | €176 | 18% | +14% | 654 |
| 30 | Malfa Growing revenue, high occupancy | €13,607 | 39% | €179 | 15% | +37% | 117 |
| 31 | Bagheria High earnings | €14,535 | 38% | €146 | 17% | +12% | 106 |
| 32 | Campofelice di Roccella Growing revenue | €13,144 | 36% | €171 | 11% | +19% | 177 |
| 33 | Modica Large market | €12,562 | 31% | €164 | 23% | +4% | 398 |
| 34 | Balestrate High occupancy | €11,309 | 39% | €157 | 17% | +11% | 175 |
| 35 | Lampedusa Growing revenue, high occupancy | €10,128 | 42% | €138 | 10% | +25% | 158 |
| 36 | Carini | €13,449 | 35% | €151 | 16% | +2% | 225 |
| 37 | Mascali | €12,972 | 35% | €157 | 19% | +3% | 211 |
| 38 | Marsala Growing revenue, large market | €8,328 | 33% | €131 | 22% | +19% | 594 |
| 39 | Cinisi Growing revenue | €13,298 | 35% | €147 | 14% | +20% | 133 |
| 40 | Isola delle Femmine Growing revenue, high occupancy | €9,649 | 39% | €102 | 19% | +19% | 135 |
| 41 | Agrigento Large market | €8,732 | 32% | €110 | 23% | +10% | 531 |
| 42 | Pozzallo Growing revenue | €11,480 | 31% | €151 | 18% | +15% | 170 |
| 43 | Sciacca Large market | €8,251 | 31% | €123 | 23% | +8% | 328 |
| 44 | Pachino | €9,519 | 31% | €151 | 23% | −4% | 273 |
| 45 | Messina | €7,393 | 30% | €114 | 28% | +11% | 245 |
| 46 | Porto Empedocle | €9,650 | 34% | €120 | 18% | +10% | 119 |
| 47 | Erice | €9,029 | 34% | €135 | 19% | +1% | 146 |
| 48 | Milazzo | €7,648 | 34% | €117 | 17% | +5% | 231 |
| 49 | Castelvetrano | €11,447 | 30% | €191 | 14% | +5% | 139 |
| 50 | Pantelleria | €8,463 | 32% | €176 | 11% | +3% | 295 |
| 51 | Santa Croce Camerina | €10,101 | 31% | €186 | 17% | +8% | 116 |
| 52 | Capo d'Orlando | €9,901 | 29% | €166 | 15% | −13% | 200 |
| 53 | Mazara del Vallo | €7,260 | 32% | €132 | 21% | +5% | 157 |
| 54 | Realmonte | €8,814 | 33% | €134 | 15% | −9% | 120 |
By measure
Sicily Airbnb Markets Ranked by Revenue, Nightly Rate and Occupancy
The overall ranking balances five measures. These lists take one at a time, for buyers who care most about income, pricing power, bookings, a steady calendar, momentum or market size.
Highest-earning Airbnb markets in Sicily
Average annual revenue per active listing over the past 12 months. Markets with at least 200 listings.
| # | Market | Revenue |
|---|---|---|
| Taormina #1 overall | €30,900 | |
| Santa Flavia #4 overall | €21,300 | |
| Cefalù #2 overall | €20,700 | |
| 4 | Castellammare del Golfo #3 overall | €17,500 |
| 5 | Scicli #12 overall | €17,500 |
| 6 | Augusta #16 overall | €17,500 |
| 7 | Noto #7 overall | €16,700 |
| 8 | Alcamo #13 overall | €16,300 |
| 9 | Syracuse #5 overall | €15,700 |
| 10 | Terrasini #20 overall | €14,900 |
| 11 | Giardini-Naxos #10 overall | €14,400 |
| 12 | Aci Castello #11 overall | €14,300 |
| 13 | Acireale #21 overall | €14,100 |
| 14 | San Vito Lo Capo #8 overall | €13,800 |
| 15 | Palermo #6 overall | €13,500 |
| 16 | Carini #36 overall | €13,400 |
| 17 | Ragusa #29 overall | €13,300 |
| 18 | Mascali #37 overall | €13,000 |
| 19 | Avola #24 overall | €12,800 |
| 20 | Modica #33 overall | €12,600 |
| 21 | Favignana #23 overall | €12,400 |
| 22 | Catania #15 overall | €10,800 |
| 23 | Lipari #25 overall | €10,600 |
| 24 | Trapani #17 overall | €10,000 |
| 25 | Capo d'Orlando #52 overall | €9,900 |
Most expensive Airbnb markets in Sicily by nightly rate
Average rate per booked night. A high rate earns most where occupancy holds up too. Markets with at least 200 listings.
| # | Market | Nightly |
|---|---|---|
| Taormina #1 overall | €245 | |
| Noto #7 overall | €210 | |
| Scicli #12 overall | €205 | |
| 4 | Augusta #16 overall | €190 |
| 5 | Cefalù #2 overall | €190 |
| 6 | Castellammare del Golfo #3 overall | €185 |
| 7 | Pantelleria #50 overall | €175 |
| 8 | Ragusa #29 overall | €175 |
| 9 | Alcamo #13 overall | €175 |
| 10 | Avola #24 overall | €170 |
| 11 | Capo d'Orlando #52 overall | €165 |
| 12 | Favignana #23 overall | €165 |
| 13 | Modica #33 overall | €165 |
| 14 | San Vito Lo Capo #8 overall | €160 |
| 15 | Santa Flavia #4 overall | €160 |
| 16 | Terrasini #20 overall | €160 |
| 17 | Syracuse #5 overall | €155 |
| 18 | Mascali #37 overall | €155 |
| 19 | Lipari #25 overall | €155 |
| 20 | Giardini-Naxos #10 overall | €155 |
| 21 | Acireale #21 overall | €150 |
| 22 | Carini #36 overall | €150 |
| 23 | Pachino #44 overall | €150 |
| 24 | Aci Castello #11 overall | €135 |
| 25 | Marsala #38 overall | €130 |
Highest-occupancy Airbnb markets in Sicily
Share of available nights booked over the past 12 months. Markets with at least 200 listings.
| # | Market | Occupancy |
|---|---|---|
| Cefalù #2 overall | 47% | |
| Santa Flavia #4 overall | 46% | |
| Taormina #1 overall | 46% | |
| 4 | Palermo #6 overall | 43% |
| 5 | Favignana #23 overall | 42% |
| 6 | Castellammare del Golfo #3 overall | 41% |
| 7 | San Vito Lo Capo #8 overall | 40% |
| 8 | Giardini-Naxos #10 overall | 40% |
| 9 | Alcamo #13 overall | 40% |
| 10 | Trapani #17 overall | 39% |
| 11 | Syracuse #5 overall | 39% |
| 12 | Aci Castello #11 overall | 39% |
| 13 | Catania #15 overall | 39% |
| 14 | Lipari #25 overall | 37% |
| 15 | Avola #24 overall | 37% |
| 16 | Augusta #16 overall | 37% |
| 17 | Terrasini #20 overall | 36% |
| 18 | Scicli #12 overall | 35% |
| 19 | Acireale #21 overall | 35% |
| 20 | Carini #36 overall | 35% |
| 21 | Mascali #37 overall | 35% |
| 22 | Noto #7 overall | 35% |
| 23 | Milazzo #48 overall | 34% |
| 24 | Marsala #38 overall | 33% |
| 25 | Agrigento #41 overall | 32% |
Most year-round Airbnb markets in Sicily
Revenue in the slowest month as a share of the best month, so a higher figure means steadier income. Markets with at least 200 listings.
| # | Market | Slow month |
|---|---|---|
| Catania #15 overall | 37% | |
| Aci Castello #11 overall | 32% | |
| Palermo #6 overall | 29% | |
| 4 | Santa Flavia #4 overall | 29% |
| 5 | Messina #45 overall | 28% |
| 6 | Syracuse #5 overall | 27% |
| 7 | Taormina #1 overall | 25% |
| 8 | Noto #7 overall | 24% |
| 9 | Trapani #17 overall | 24% |
| 10 | Agrigento #41 overall | 23% |
| 11 | Modica #33 overall | 23% |
| 12 | Sciacca #43 overall | 23% |
| 13 | Acireale #21 overall | 23% |
| 14 | Pachino #44 overall | 23% |
| 15 | Castellammare del Golfo #3 overall | 22% |
| 16 | Marsala #38 overall | 22% |
| 17 | Giardini-Naxos #10 overall | 22% |
| 18 | Cefalù #2 overall | 21% |
| 19 | Avola #24 overall | 21% |
| 20 | San Vito Lo Capo #8 overall | 19% |
| 21 | Augusta #16 overall | 19% |
| 22 | Mascali #37 overall | 19% |
| 23 | Lipari #25 overall | 18% |
| 24 | Ragusa #29 overall | 18% |
| 25 | Terrasini #20 overall | 18% |
Fastest-growing Airbnb markets in Sicily
Change in revenue per listing from the year before, among markets where it rose. Markets with at least 200 listings.
| # | Market | Change |
|---|---|---|
| Favignana #23 overall | +26% | |
| Terrasini #20 overall | +25% | |
| Trapani #17 overall | +22% | |
| 4 | Marsala #38 overall | +19% |
| 5 | Castellammare del Golfo #3 overall | +18% |
| 6 | Cefalù #2 overall | +17% |
| 7 | Scicli #12 overall | +15% |
| 8 | San Vito Lo Capo #8 overall | +15% |
| 9 | Lipari #25 overall | +15% |
| 10 | Palermo #6 overall | +15% |
| 11 | Santa Flavia #4 overall | +14% |
| 12 | Ragusa #29 overall | +14% |
| 13 | Acireale #21 overall | +14% |
| 14 | Alcamo #13 overall | +14% |
| 15 | Syracuse #5 overall | +13% |
| 16 | Noto #7 overall | +13% |
| 17 | Messina #45 overall | +11% |
| 18 | Aci Castello #11 overall | +10% |
| 19 | Agrigento #41 overall | +10% |
| 20 | Taormina #1 overall | +9% |
| 21 | Catania #15 overall | +9% |
| 22 | Sciacca #43 overall | +8% |
| 23 | Augusta #16 overall | +7% |
| 24 | Avola #24 overall | +7% |
| 25 | Giardini-Naxos #10 overall | +6% |
Largest Airbnb markets in Sicily
Active listings. Bigger markets have more comparable rentals to price against and more buyers at resale.
| # | Market | Listings |
|---|---|---|
| Palermo #6 overall | 5,160 | |
| Catania #15 overall | 2,950 | |
| Syracuse #5 overall | 2,430 | |
| 4 | Castellammare del Golfo #3 overall | 1,080 |
| 5 | Cefalù #2 overall | 1,060 |
| 6 | Taormina #1 overall | 1,030 |
| 7 | San Vito Lo Capo #8 overall | 856 |
| 8 | Noto #7 overall | 853 |
| 9 | Trapani #17 overall | 761 |
| 10 | Lipari #25 overall | 734 |
| 11 | Ragusa #29 overall | 654 |
| 12 | Marsala #38 overall | 594 |
| 13 | Giardini-Naxos #10 overall | 540 |
| 14 | Avola #24 overall | 532 |
| 15 | Agrigento #41 overall | 531 |
| 16 | Scicli #12 overall | 419 |
| 17 | Favignana #23 overall | 414 |
| 18 | Modica #33 overall | 398 |
| 19 | Sciacca #43 overall | 328 |
| 20 | Alcamo #13 overall | 298 |
| 21 | Pantelleria #50 overall | 295 |
| 22 | Acireale #21 overall | 281 |
| 23 | Augusta #16 overall | 277 |
| 24 | Pachino #44 overall | 273 |
| 25 | Aci Castello #11 overall | 246 |
Seasonality
When Airbnbs in Sicily Earn the Most
August is the best month for 94% of ranked markets in Sicily. January is the most common slowest month, in 36 markets.
August earns about 4.2 times what January does
Average revenue per listing across the 54 ranked markets in Sicily, by month
| Month | Avg. revenue per listing | Best month for | Highest-ranked examples |
|---|---|---|---|
| January | €797 | – | – |
| February | €903 | – | – |
| March | €1,170 | – | – |
| April | €1,570 | – | – |
| May | €1,860 | – | – |
| June | €2,210 | – | – |
| July | €2,930 | 3 markets | Taormina, Giarre, Letojanni |
| August | €3,370 | 50 markets | Cefalù, Castellammare del Golfo, Santa Flavia |
| September | €2,430 | – | – |
| October | €1,780 | – | – |
| November | €1,060 | – | – |
| December | €880 | – | – |
Average revenue is per listing across the ranked markets, the line in the chart above. "Best month for" counts the ranked markets whose own revenue peaks in that month.
Management
Who Manages Airbnbs in Sicily?
AirROI ranks the 50 largest of the 115 companies that run 5 or more Airbnb listings in Sicily, by listings, guest rating and growth; companies run 11% of its listings.
Method
How the Ranking Works
The ranking covers the 54 markets in Sicily with at least 100 active Airbnb listings and data through October 2026. Each market is compared with the others on five measures, and markets are ordered by a weighted blend of where they place on each:
- Revenue per listing (35%): average revenue an active listing earned over the past 12 months.
- Occupancy (20%): share of available nights that were booked.
- Market size (20%): active listings. Bigger markets offer more comparable rentals to price against and more buyers when you sell.
- Year-round demand (15%): revenue in the slowest month as a share of the best month. The latest month is left out when its bookings look incomplete.
- Growth (10%): change in revenue per listing from the year before. Markets whose boundaries changed between years are scored in the middle.
Left out: 31 markets whose data predate the latest refresh. The score measures how rentals perform. It does not include purchase prices, financing, operating costs or local short-term rental rules, which vary by address and should be checked before buying. Figures are in euros and match each market's own report; see the data methodology for how listings are tracked.
To check one property before buying, run its address and size through the Airbnb estimator for a revenue, occupancy and nightly-rate range from comparable listings.
FAQ
Frequently Asked Questions About Airbnb Investing in Sicily
What is the best place to buy an Airbnb in Sicily?
Taormina ranks first of the 54 markets in Sicily in AirROI's ranking, with €30,900 in average revenue per listing and 46% occupancy. Cefalù and Castellammare del Golfo follow. The ranking weighs revenue, occupancy, market size, seasonality and growth; it leaves out purchase prices.
What are the most profitable Airbnb locations in Sicily?
By revenue per listing, among markets with at least 200 listings, Taormina leads at €30,900 a year, ahead of Santa Flavia at €21,300. Profit also depends on what a property costs to buy and run, which varies far more between markets than revenue does.
How much does an Airbnb make in Sicily?
The average active listing in Sicily earned €13,800 over the 12 months to October 2026, at 38% occupancy. Across the ranked markets, the middle half averaged between €10,000 and €14,900 per listing. Averages include listings that operated for only part of the year, so a listing rented all year typically earns more.
What is a good Airbnb occupancy rate in Sicily?
The average listing in Sicily was booked on 38% of available nights over the past 12 months. Half of the ranked markets fall between 33% and 39%, so a market above about 39% sits in the top quarter. Occupancy is only half the picture: a market with lower occupancy can still earn more if its nightly rates are higher.
Where is Airbnb demand highest in Sicily?
Among ranked markets with at least 200 listings, Cefalù has the highest occupancy, with 47% of available nights booked, followed by Santa Flavia at 46%. Its listings average about €190 a night and €20,700 a year.
Where are Airbnb nightly rates highest in Sicily?
Among ranked markets with at least 200 listings, Taormina has the highest average nightly rate, about €245, followed by Noto at €210. Catania is the least expensive, at about €100. The average booked night in Sicily costs about €150.
What is the best month for Airbnb in Sicily?
August is the highest-earning month for 50 of the 53 ranked markets, followed by July (3). January is the most common slowest month, in 36 of the 53 markets. Each market's report shows its own month-by-month revenue, occupancy and rates.
Which Airbnb markets in Sicily earn the most evenly through the year?
Among ranked markets with at least 200 listings, Catania has the steadiest income: its slowest month, January, still earns about a third of its best. Aci Castello follows, at 32%. Steadier markets are easier to budget for, though they do not always earn the most per listing.
Which Airbnb markets are growing fastest in Sicily?
Among ranked markets with at least 200 listings, revenue per listing grew most in Favignana, up 26% on the year before, and in Terrasini, up 25%. A single strong year can reflect events or new supply, so it is worth checking a market's monthly trend before relying on it.
Is Airbnb still profitable in Sicily in 2026?
Revenue per listing grew in 49 of the 53 ranked markets with a comparable year of data; in the typical market it rose 13%. Whether a given property profits depends on its purchase price, financing and running costs.
What are the best smaller Airbnb markets in Sicily?
Among ranked markets with fewer than 200 active listings, Giarre (#9 overall, €18,600 per listing), Custonaci (#14, €15,000) and Riposto (#18, €15,700) place highest. Smaller markets have fewer comparable rentals to price against, so their averages can move more from year to year.
How many Airbnb listings are there in Sicily?
AirROI tracked 32,000 active Airbnb listings in Sicily over the 12 months to October 2026, across 172 markets. The largest ranked market is Palermo, with 5,160 listings, followed by Catania with 2,950.
Do Airbnb hosts need a permit in Sicily?
Rules can be national or regional as well as local, and they change often, so check each of them for any address you consider. In the listing data, most listings display a registration number in all 54 ranked markets, though that shows what hosts display, not what the rules allow.
Directory
All 172 Airbnb Markets in Sicily
Every Sicily city with an AirROI Airbnb market report, A–Z, with its active listing count.
A
- Aci Castello 246 listings
- Aci Catena 35 listings
- Aci Sant'Antonio 24 listings
- Acireale 281 listings
- Acquedolci 31 listings
- Agira 19 listings
- Agrigento 531 listings
- Alcamo 298 listings
- Altavilla Milicia 69 listings
- Augusta 277 listings
- Avola 532 listings
B
- Bagheria 106 listings
- Balestrate 175 listings
- Barcellona Pozzo di Gotto 18 listings
- Belpasso 29 listings
- Brolo 19 listings
- Buseto Palizzolo 28 listings
C
- Caccamo 18 listings
- Calatabiano 37 listings
- Calatafimi Segesta 29 listings
- Caltagirone 75 listings
- Caltanissetta 36 listings
- Cammarata 19 listings
- Campobello di Mazara 25 listings
- Campofelice di Roccella 177 listings
- Canicattì 18 listings
- Canicattini Bagni 18 listings
- Capaci 74 listings
- Capo d'Orlando 200 listings
- Carini 225 listings
- Carlentini 24 listings
- Caronia 40 listings
- Castelbuono 69 listings
- Casteldaccia 46 listings
- Castellammare del Golfo 1,081 listings
- Castelmola 57 listings
- Castelvetrano 139 listings
- Castiglione di Sicilia 47 listings
- Catania 2,953 listings
- Cattolica Eraclea 25 listings
- Cefalù 1,063 listings
- Chiaramonte Gulfi 37 listings
- Cinisi 133 listings
- Collesano 41 listings
- Comiso 26 listings
- Custonaci 166 listings
F
- Falcone 19 listings
- Favara 37 listings
- Favignana 414 listings
- Ficarazzi 22 listings
- Ficarra 19 listings
- Fiumefreddo di Sicilia 53 listings
- Floridia 23 listings
- Forza d'Agrò 37 listings
- Francavilla di Sicilia 19 listings
- Furci Siculo 18 listings
- Furnari 28 listings
G
- Gaggi 20 listings
- Gangi 18 listings
- Gela 53 listings
- Giardini-Naxos 540 listings
- Giarre 100 listings
- Gioiosa Marea 57 listings
- Graniti 20 listings
- Gratteri 22 listings
I
- Isola delle Femmine 135 listings
- Ispica 191 listings
L
- Lampedusa 158 listings
- Lampedusa e Linosa 32 listings
- Lascari 63 listings
- Leni 26 listings
- Lentini 18 listings
- Letojanni 154 listings
- Licata 72 listings
- Linguaglossa 41 listings
- Lipari 734 listings
M
- Malfa 117 listings
- Marausa 17 listings
- Marina di Ragusa 37 listings
- Marsala 594 listings
- Marzamemi 33 listings
- Mascali 211 listings
- Mascalucia 67 listings
- Mazara del Vallo 157 listings
- Mazzarino 25 listings
- Melilli 22 listings
- Menfi 149 listings
- Messina 245 listings
- Metropolitan City of Palermo 198 listings
- Milazzo 231 listings
- Milo 29 listings
- Misterbianco 18 listings
- Modica 398 listings
- Monreale 60 listings
- Montallegro 28 listings
- Motta Camastra 30 listings
O
- Oliveri 29 listings
P
- Paceco 30 listings
- Pachino 273 listings
- Palazzolo Acreide 56 listings
- Palermo 5,162 listings
- Palma di Montechiaro 34 listings
- Pantelleria 295 listings
- Partanna 26 listings
- Partinico 100 listings
- Patti 37 listings
- Pedara 27 listings
- Petralia Sottana 17 listings
- Petrosino 23 listings
- Piazza Armerina 55 listings
- Piedimonte Etneo 68 listings
- Pietraperzia 18 listings
- Piraino 24 listings
- Polizzi Generosa 27 listings
- Pollina 41 listings
- Porto Empedocle 119 listings
- Portopalo di Capo Passero 76 listings
- Pozzallo 170 listings
R
S
- Salemi 27 listings
- Sambuca di Sicilia 25 listings
- San Giovanni la Punta 17 listings
- San Gregorio di Catania 18 listings
- San Vito Lo Capo 856 listings
- Sant'Agata di Militello 39 listings
- Sant'Alessio Siculo 44 listings
- Sant'Alfio 29 listings
- Santa Croce Camerina 116 listings
- Santa Flavia 211 listings
- Santa Marina Salina 75 listings
- Santa Teresa di Riva 48 listings
- Santa Venerina 53 listings
- Santo Stefano di Camastra 46 listings
- Sciacca 328 listings
- Scicli 419 listings
- Siculiana 52 listings
- Solarino 33 listings
- Sortino 19 listings
- Spadafora 18 listings
- Syracuse 2,428 listings
T
- Taormina 1,028 listings
- Terme Vigliatore 25 listings
- Termini Imerese 51 listings
- Terrasini 218 listings
- Torregrotta 17 listings
- Torrenova 29 listings
- Torretta 17 listings
- Trabia 89 listings
- Trapani 761 listings
- Trappeto 85 listings
- Trecastagni 58 listings
- Tusa 32 listings
U
- Ustica 74 listings
Z
- Zafferana Etnea 68 listings