AirROI ranking · 202622 markets ranked
Best Places to Buy an Airbnb in Ohio (2026)
Rockbridge is the best place to buy an Airbnb in Ohio in 2026, according to AirROI's ranking of 22 markets. Its listings averaged $67,300 in revenue over the 12 months to October 2026 and were booked on 44% of nights. It also earns the most per listing of any ranked market. With 267 active listings it is a small market, so its averages can move more from year to year than those of larger ones. Logan and Columbus come next.
- Markets tracked
- 177
- Active Airbnb listings
- 16,800
- Avg. revenue per listing
- $29,900
- Occupancy rate
- 42%
- Avg. nightly rate
- $240
- Revenue change, typical market
- +3%
The short answer
Ohio Airbnb Market at a Glance
Across Ohio, the 16,800 active Airbnb listings tracked by AirROI, a short-term-rental data firm, averaged $29,900 over the same period. They were booked on 42% of nights at about $240 a night; the ranking covers the 22 markets with at least 100 active listings. Revenue per listing rose in 18 of the 22 ranked markets with a comparable year of data, by 3% in the typical one.
The ranking weighs revenue per listing most, then occupancy and market size, then how evenly income spreads across the year and how it changed on the year. It reflects rental performance, not purchase prices or local short-term rental rules. How the ranking works.
Where the top 10 Airbnb markets in Ohio are
Each dot is one of the 177 markets AirROI tracks in Ohio (3 outlying ones fall outside the map), sized by active listings and coloured by average revenue per listing. Select a number to jump to its profile.
Top 10
The Top 10 Airbnb Markets in Ohio
Each profile draws on the market's full AirROI report: how it earns, when in the year, who books and what sells. Monthly figures are averages per listing active in that month, so twelve of them add up to more than the annual average, which also counts listings that operated for only part of the year.
| # | Market | Avg. revenue | Occupancy |
|---|---|---|---|
 Rockbridge High earnings · High occupancy | $67,300 | 44% | |
 Logan High earnings · Large market | $61,400 | 43% | |
 Columbus Large market · Year-round demand | $27,000 | 44% | |
| 4 |  South Bloomingville High occupancy · High earnings | $52,200 | 45% |
| 5 |  Laurelville High earnings · High occupancy | $55,500 | 43% |
| 6 |  Swan Township High earnings · High occupancy | $59,700 | 44% |
| 7 |  Cleveland Large market · Year-round demand | $23,100 | 42% |
| 8 |  Cincinnati Large market · Growing revenue | $25,800 | 42% |
| 9 |  Millersburg High earnings | $36,200 | 42% |
| 10 |  Akron Growing revenue · Large market | $17,200 | 42% |
1. Rockbridge
Known for: High earnings · High occupancy



Top-earning Airbnb listings in Rockbridge - Avg. revenue
- $67,300 +4% vs. last year
- Occupancy
- 44%
- Nightly rate
- $440
- Active listings
- 267
Where it places among the 22 ranked markets in Ohio
- Revenue 1st of 22
- Occupancy 5th of 22
- Market size 9th of 22
- Year-round 12th of 22
- Growth 10th of 22
- How it earns
- Rockbridge earns on price: guests pay about $440 a night, 83% above the Ohio average. That adds up to $67,300 per listing over the year, the highest of the 22 ranked markets. A typical listing takes in about $5,100 a month; the top quarter clear $8,150 or more.
- When it earns
- Rockbridge's season runs from May to August, peaking in July at about $9,280 per listing; February, the quietest month, brings in about $3,600. Stays are shorter than in most of Ohio, about 2.4 nights, so listings turn over often; guests book about 50 days ahead. Most hosts take one- or two-night bookings (99% of listings), more than in the typical market.
- The competition
- Professional managers run 53% of listings, against about 19% in the typical market in Ohio, and the largest operator runs 51 listings, so new hosts compete with polished operations.
- What sells
- The most common entire home has 3 bedrooms (26% of entire homes), and cabins, campers and other outdoor stays make up 73% of supply.
- Who it suits
- It suits buyers who can furnish and price for a premium stay and plan to use a professional manager or run a polished operation.
Revenue per listing by month
$9,280 $3,600- Median listing
- $5,100/mo
- Top 25% of listings
- $8,150+/mo
- Booked ahead
- 50 days
- Average stay
- 2.4 nights
- Most common home size
- 3 bedrooms
- Superhosts
- 87%
2. Logan
Known for: High earnings · Large market
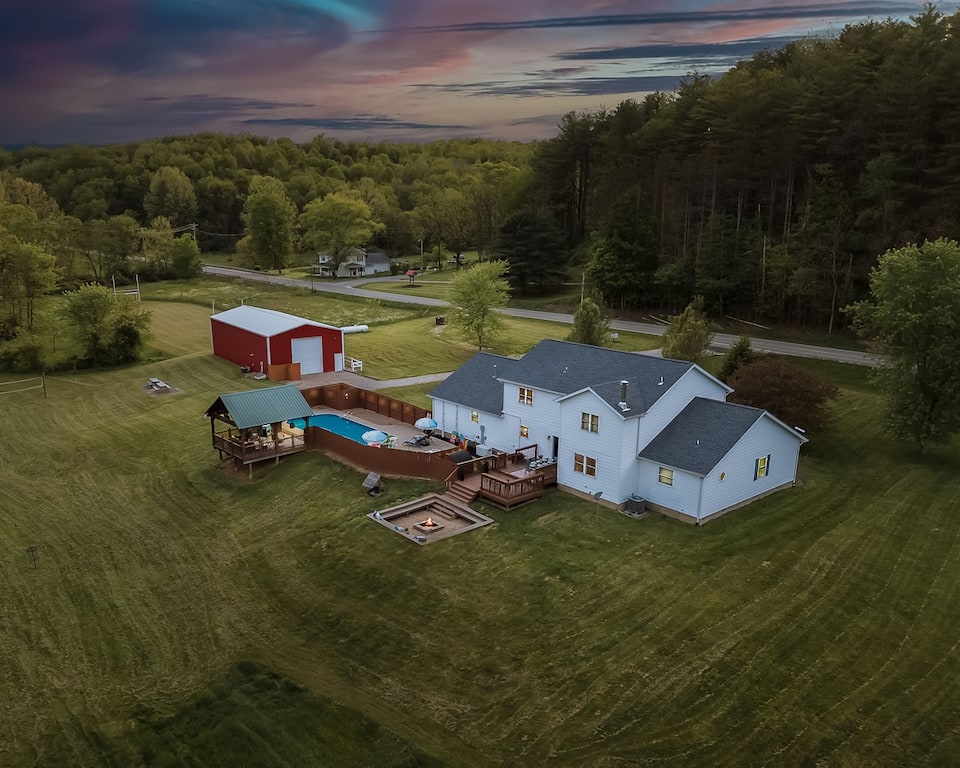


Top-earning Airbnb listings in Logan - Avg. revenue
- $61,400 +1% vs. last year
- Occupancy
- 43%
- Nightly rate
- $415
- Active listings
- 802
Where it places among the 22 ranked markets in Ohio
- Revenue 2nd of 22
- Occupancy 7th of 22
- Market size 4th of 22
- Year-round 14th of 22
- Growth 16th of 22
- How it earns
- Nightly rates set Logan apart: about $415, 72% above the Ohio average. Listings averaged $61,400 in revenue over the year, the second-highest of the 22 ranked markets. In a typical month the median listing brings in about $4,650, and the best quarter clear $7,530.
- When it earns
- Revenue in Logan concentrates from June to October: July earns about $8,900 per listing, about 2.6 times as much as February. Visits are quick, about 2.5 nights on average against 4 nights for the typical market in Ohio, booked about 56 days ahead. Most hosts take one- or two-night bookings (98% of listings), more than in the typical market.
- The competition
- Professional managers run 45% of listings, against about 19% in the typical market in Ohio, and the largest operator runs 94 listings, so new hosts compete with polished operations.
- What sells
- Two-bedroom homes lead the market (32% of entire homes), and cabins, campers and other outdoor stays make up 72% of supply.
- Who it suits
- Best for buyers who can furnish and price for a premium stay and plan to use a professional manager or run a polished operation.
Revenue per listing by month
$8,900 $3,390- Median listing
- $4,650/mo
- Top 25% of listings
- $7,530+/mo
- Booked ahead
- 56 days
- Average stay
- 2.5 nights
- Most common home size
- 2 bedrooms
- Superhosts
- 79%
Areas in the full report: Downtown Logan · Hocking Hills · Lake Logan
Full Logan Airbnb report3. Columbus
Known for: Large market · Year-round demand



Top-earning Airbnb listings in Columbus - Avg. revenue
- $27,000 +7% vs. last year
- Occupancy
- 44%
- Nightly rate
- $205
- Active listings
- 2,490
Where it places among the 22 ranked markets in Ohio
- Revenue 14th of 22
- Occupancy 3rd of 22
- Market size 1st of 22
- Year-round 2nd of 22
- Growth 7th of 22
- How it earns
- Columbus is Ohio's largest Airbnb market, with 2,490 active listings to price against. Moderate rates keep revenue per listing at $27,000, 10% below the Ohio average. Its place at #3 rests on market size (1st of 22) and year-round demand (2nd of 22) rather than on revenue per listing. Month to month, the median listing earns about $2,510 and a top-quarter listing $4,230 or more. Revenue per listing rose 7% over the year, helped by nightly rates 11% higher.
- When it earns
- In Columbus, the months from May to October earn above the yearly average, led by July at about $3,810 per listing; January is the low point at about $2,160. Trips run long, about 5 nights on average against 4 nights for the typical market in Ohio, booked about 43 days ahead.
- What sells
- The most common entire home has 2 bedrooms (32% of entire homes), and houses make up 63% of supply.
- Registration
- More than eight in ten listings display a registration number, so confirm the local rules before buying.
Revenue per listing by month
$3,810 $2,160- Median listing
- $2,510/mo
- Top 25% of listings
- $4,230+/mo
- Booked ahead
- 43 days
- Average stay
- 5 nights
- Most common home size
- 2 bedrooms
- Superhosts
- 57%
Areas in the full report: Short North · German Village · Downtown Columbus
Full Columbus Airbnb report4. South Bloomingville
Known for: High occupancy · High earnings
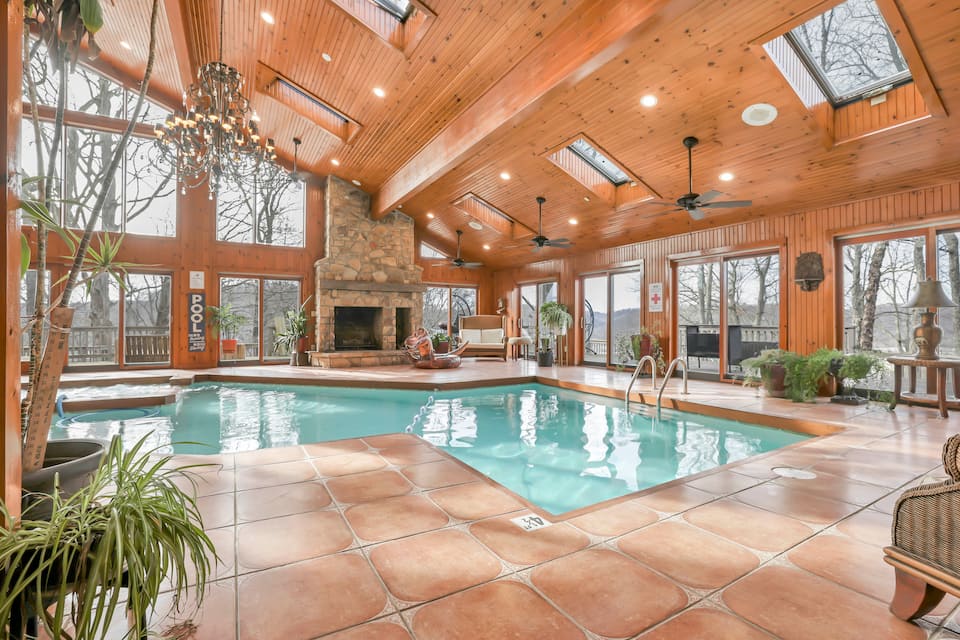

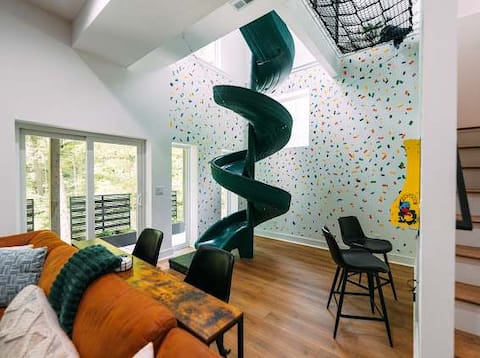
Top-earning Airbnb listings in South Bloomingville - Avg. revenue
- $52,200 −10% vs. last year
- Occupancy
- 45%
- Nightly rate
- $335
- Active listings
- 156
Where it places among the 22 ranked markets in Ohio
- Revenue 5th of 22
- Occupancy 2nd of 22
- Market size 15th of 22
- Year-round 9th of 22
- Growth 21st of 22
- How it earns
- South Bloomingville fills more nights than most of Ohio: 45% of them, the second-highest occupancy of the 22 ranked markets, at about $335 a night. That adds up to $52,200 per listing over the year, the fifth-highest of the 22 ranked markets. A typical listing takes in about $4,310 a month; the top quarter clear $6,860 or more. Revenue per listing slipped 10% over the year even with rates 5% higher, as bookings softened. With 156 listings it is a small market, so its averages can move more from year to year.
- When it earns
- South Bloomingville has two seasons, June–August and October. October is the strongest month at about $7,170 per listing, and February the quietest at about $3,240. Stays are shorter than in most of Ohio, about 2.4 nights, so listings turn over often; guests book about 49 days ahead. Most hosts take one- or two-night bookings (99% of listings), more than in the typical market.
- The competition
- Professional managers run 51% of listings, against about 19% in the typical market in Ohio, so new hosts compete with polished operations.
- What sells
- One-bedroom homes lead the market (41% of entire homes), and cabins, campers and other outdoor stays make up 81% of supply.
- Who it suits
- A good fit for buyers who plan to use a professional manager or run a polished operation.
Revenue per listing by month
$7,170 $3,240- Median listing
- $4,310/mo
- Top 25% of listings
- $6,860+/mo
- Booked ahead
- 49 days
- Average stay
- 2.4 nights
- Most common home size
- 1 bedroom
- Superhosts
- 79%
5. Laurelville
Known for: High earnings · High occupancy



Top-earning Airbnb listings in Laurelville - Avg. revenue
- $55,500 +1% vs. last year
- Occupancy
- 43%
- Nightly rate
- $390
- Active listings
- 176
Where it places among the 22 ranked markets in Ohio
- Revenue 4th of 22
- Occupancy 6th of 22
- Market size 13th of 22
- Year-round 16th of 22
- Growth 15th of 22
- How it earns
- Laurelville earns on price: guests pay about $390 a night, 62% above the Ohio average. Listings averaged $55,500 in revenue over the year, the fourth-highest of the 22 ranked markets. In a typical month the median listing brings in about $4,610, and the best quarter clear $7,230. Its 176 listings make it one of the smaller ranked markets, so its figures are less settled than those of larger ones.
- When it earns
- Laurelville's season runs from June to October, peaking in July at about $8,780 per listing; February, the quietest month, brings in about $3,140. Visits are quick, about 2.8 nights on average against 4 nights for the typical market in Ohio, booked about 48 days ahead. Most hosts take one- or two-night bookings (99% of listings), more than in the typical market.
- The competition
- Professional managers run 39% of listings, against about 19% in the typical market in Ohio, and the largest operator runs 24 listings, so new hosts compete with polished operations.
- What sells
- The most common entire home has 1 bedroom (26% of entire homes), and cabins, campers and other outdoor stays make up 73% of supply.
- Who it suits
- It suits buyers who can furnish and price for a premium stay and are prepared for thin bookings around February.
Revenue per listing by month
$8,780 $3,140- Median listing
- $4,610/mo
- Top 25% of listings
- $7,230+/mo
- Booked ahead
- 48 days
- Average stay
- 2.8 nights
- Most common home size
- 1 bedroom
- Superhosts
- 78%
6. Swan Township
Known for: High earnings · High occupancy
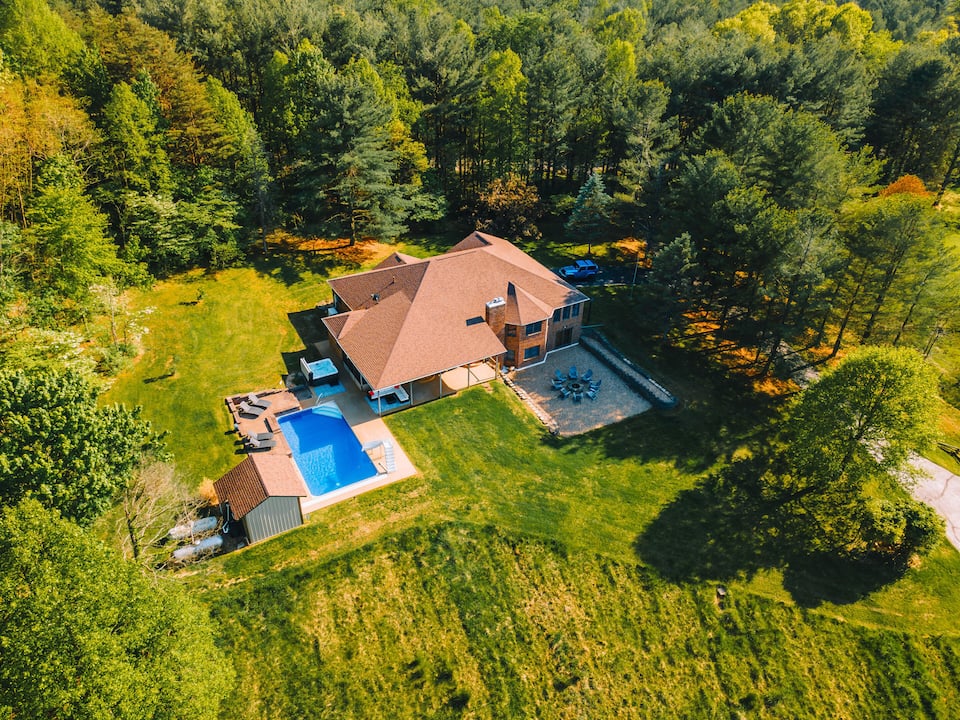
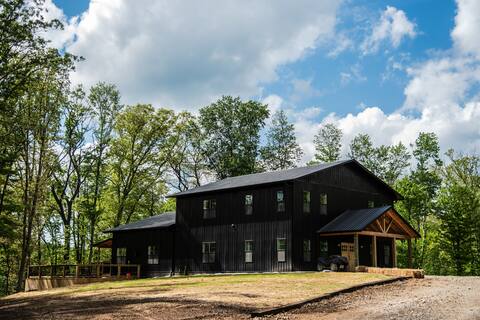
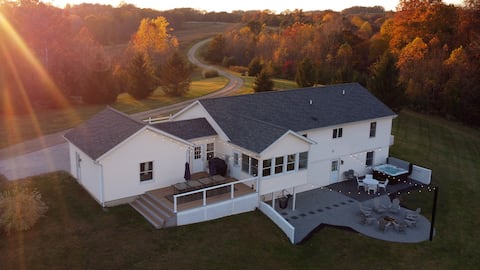
Top-earning Airbnb listings in Swan Township - Avg. revenue
- $59,700 +3% vs. last year
- Occupancy
- 44%
- Nightly rate
- $370
- Active listings
- 102
Where it places among the 22 ranked markets in Ohio
- Revenue 3rd of 22
- Occupancy 4th of 22
- Market size 22nd of 22
- Year-round 12th of 22
- Growth 12th of 22
- How it earns
- Nightly rates set Swan Township apart: about $370, 55% above the Ohio average. Average revenue per listing came to $59,700, the third-highest of the 22 ranked markets. Month to month, the median listing earns about $4,680 and a top-quarter listing $6,840 or more. With 102 listings it is a small market, so its averages can move more from year to year.
- When it earns
- Revenue in Swan Township concentrates from May to October: July earns about $7,790 per listing, about 2.6 times as much as February. Stays are shorter than in most of Ohio, about 2.4 nights, so listings turn over often; guests book about 46 days ahead. Most hosts take one- or two-night bookings (100% of listings), more than in the typical market.
- The competition
- Professional managers run 36% of listings, against about 19% in the typical market in Ohio, so new hosts compete with polished operations.
- What sells
- One-bedroom homes lead the market (50% of entire homes), and cabins, campers and other outdoor stays make up 73% of supply.
- Who it suits
- Best for buyers who can furnish and price for a premium stay and can carry costs through a quiet February.
Revenue per listing by month
$7,790 $3,020- Median listing
- $4,680/mo
- Top 25% of listings
- $6,840+/mo
- Booked ahead
- 46 days
- Average stay
- 2.4 nights
- Most common home size
- 1 bedroom
- Superhosts
- 84%
7. Cleveland
Known for: Large market · Year-round demand
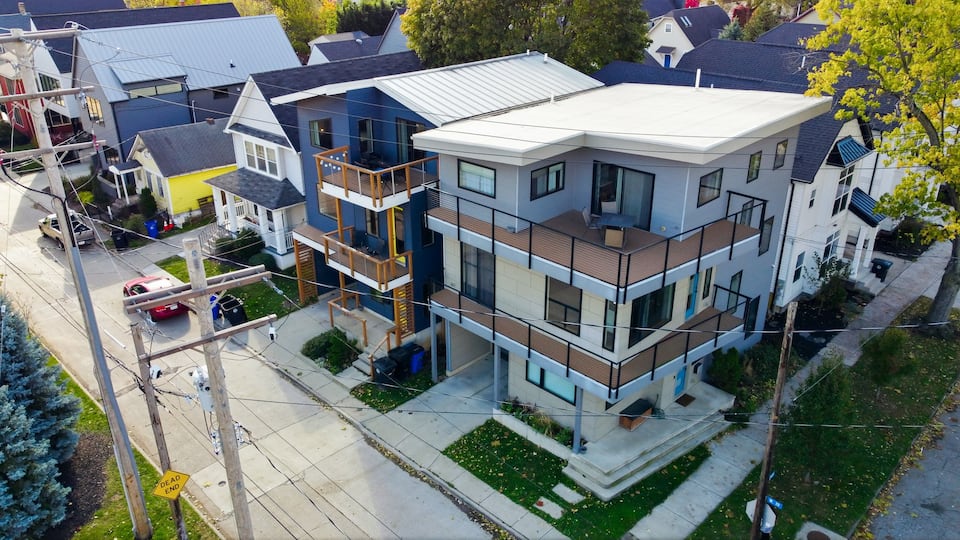
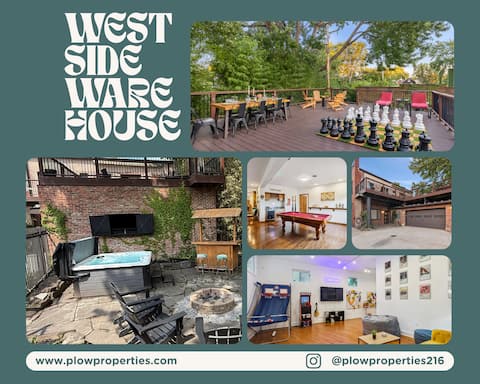
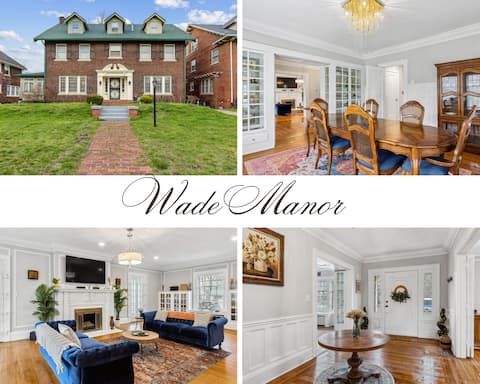
Top-earning Airbnb listings in Cleveland - Avg. revenue
- $23,100 +4% vs. last year
- Occupancy
- 42%
- Nightly rate
- $185
- Active listings
- 1,790
Where it places among the 22 ranked markets in Ohio
- Revenue 17th of 22
- Occupancy 9th of 22
- Market size 2nd of 22
- Year-round 5th of 22
- Growth 11th of 22
- How it earns
- Cleveland is Ohio's second-largest Airbnb market, with 1,790 active listings to price against. Moderate rates keep revenue per listing at $23,100, 23% below the Ohio average. Its place at #7 rests on market size (2nd of 22) and year-round demand (5th of 22) rather than on revenue per listing. A typical listing takes in about $2,250 a month; the top quarter clear $3,910 or more.
- When it earns
- In Cleveland, the months from June to September earn above the yearly average, led by July at about $3,880 per listing; January is the low point at about $1,920. Guests book later than in most of Ohio, about 35 days ahead against roughly 47 for the typical market in Ohio; stays average 6 nights.
- Guest expectations
- Average ratings (4.75 stars) trail the typical market in Ohio (4.83), which leaves room for a well-run listing to stand out.
- What sells
- Smaller places set the market: only 26% of entire homes have three or more bedrooms, against about 42% in the typical market in Ohio; apartments and condos make up 55% of supply.
- Who it suits
- A good fit for buyers who are comfortable adjusting prices close to the date and prefer a smaller one- or two-bedroom place.
Revenue per listing by month
$3,880 $1,920- Median listing
- $2,250/mo
- Top 25% of listings
- $3,910+/mo
- Booked ahead
- 35 days
- Average stay
- 6 nights
- Most common home size
- 2 bedrooms
- Superhosts
- 49%
Areas in the full report: Ohio City · Tremont · Lakewood
Full Cleveland Airbnb report8. Cincinnati
Known for: Large market · Growing revenue
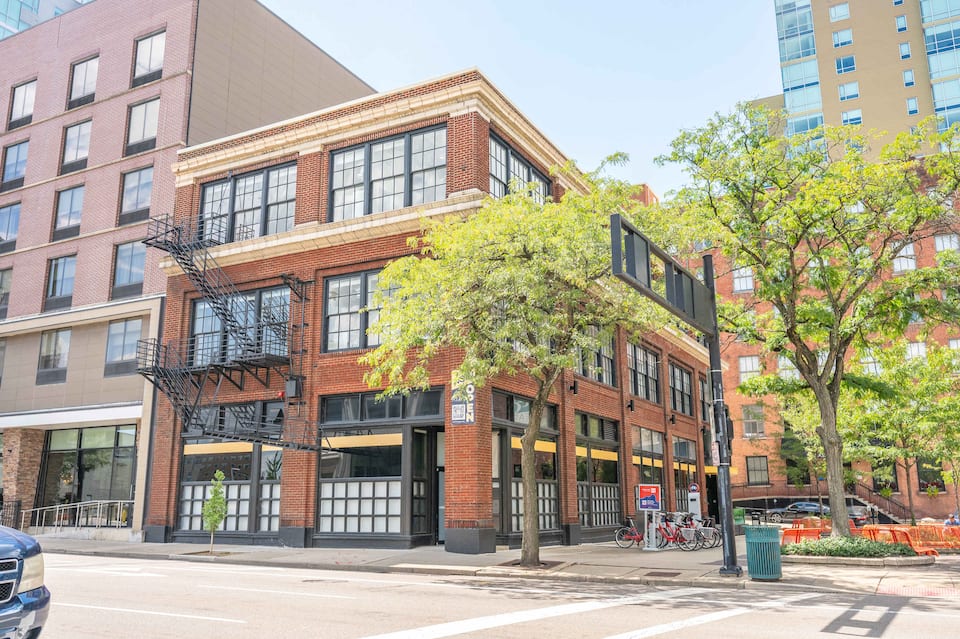

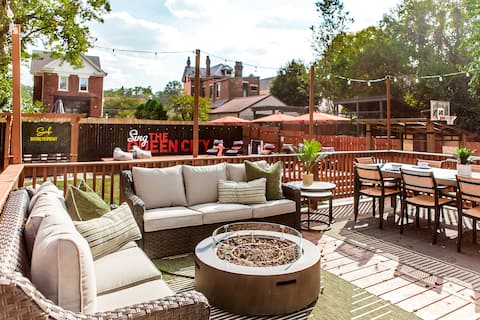
Top-earning Airbnb listings in Cincinnati - Avg. revenue
- $25,800 +5% vs. last year
- Occupancy
- 42%
- Nightly rate
- $210
- Active listings
- 1,720
Where it places among the 22 ranked markets in Ohio
- Revenue 15th of 22
- Occupancy 12th of 22
- Market size 3rd of 22
- Year-round 7th of 22
- Growth 9th of 22
- How it earns
- Cincinnati is Ohio's third-largest Airbnb market, with 1,720 active listings to price against. Moderate rates keep revenue per listing at $25,800, 13% below the Ohio average. Its place at #8 rests on market size (3rd of 22) rather than on revenue per listing. In a typical month the median listing brings in about $2,390, and the best quarter clear $3,950. Revenue per listing rose 5% over the year, helped by nightly rates 12% higher, even as the number of listings grew 20%.
- When it earns
- Cincinnati's season runs from May to October, peaking in July at about $3,990 per listing; February, the quietest month, brings in about $1,850. Guests stay about 6 nights, longer than in most of Ohio, and book about 39 days ahead.
- What sells
- The most common entire home has 1 bedroom (38% of entire homes), and apartments and condos make up 63% of supply.
Revenue per listing by month
$3,990 $1,850- Median listing
- $2,390/mo
- Top 25% of listings
- $3,950+/mo
- Booked ahead
- 39 days
- Average stay
- 6 nights
- Most common home size
- 1 bedroom
- Superhosts
- 60%
Areas in the full report: Over-the-Rhine · Downtown · Mount Adams
Full Cincinnati Airbnb report9. Millersburg
Known for: High earnings
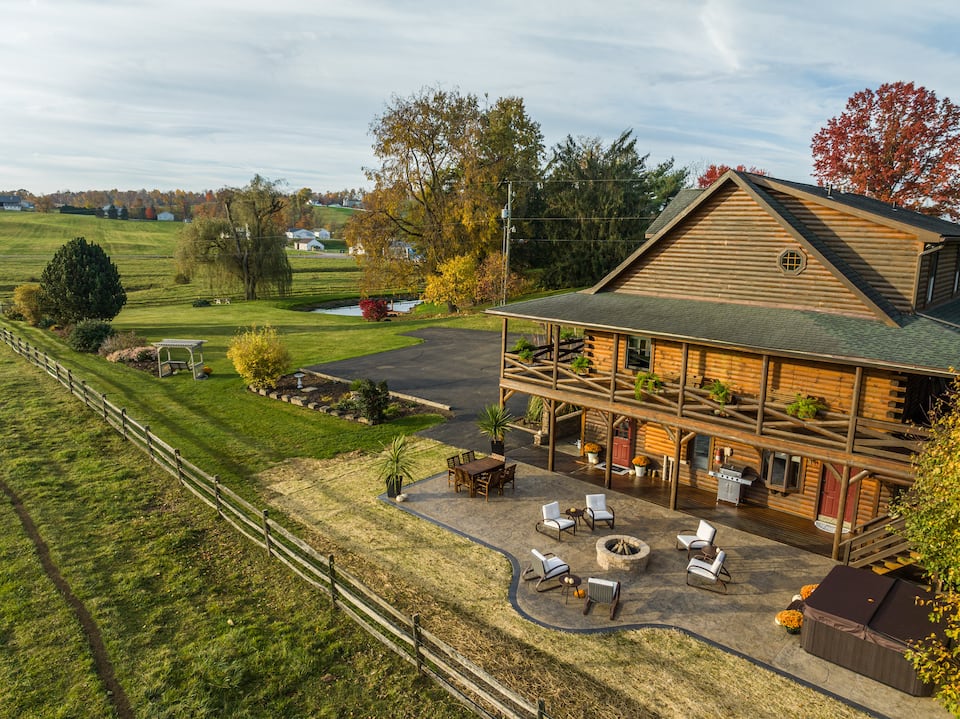
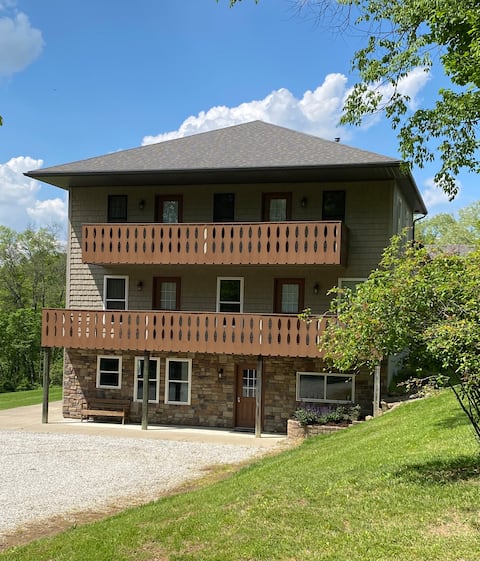

Top-earning Airbnb listings in Millersburg - Avg. revenue
- $36,200 +2% vs. last year
- Occupancy
- 42%
- Nightly rate
- $250
- Active listings
- 168
Where it places among the 22 ranked markets in Ohio
- Revenue 9th of 22
- Occupancy 9th of 22
- Market size 14th of 22
- Year-round 11th of 22
- Growth 14th of 22
- How it earns
- Millersburg books 42% of nights at about $250 a night, close to the typical market in Ohio. Average revenue per listing came to $36,200, the ninth-highest of the 22 ranked markets. Month to month, the median listing earns about $3,060 and a top-quarter listing $4,570 or more. Its 168 listings make it one of the smaller ranked markets, so its figures are less settled than those of larger ones.
- When it earns
- Revenue in Millersburg concentrates from May to October: October earns about $4,860 per listing, about 2.3 times as much as January. Visits are quick, about 2.3 nights on average against 4 nights for the typical market in Ohio, booked about 41 days ahead. Most hosts take one- or two-night bookings (99% of listings), more than in the typical market.
- What sells
- Few listings are large: just 18% have three or more bedrooms, against about 42% in the typical market in Ohio.
- Guest expectations
- Guests rate listings highly, 4.92 stars on average against 4.83 for the typical market in Ohio, so reviews set a high bar.
- Who it suits
- It suits buyers who prefer a smaller one- or two-bedroom place.
Revenue per listing by month
$4,860 $2,140- Median listing
- $3,060/mo
- Top 25% of listings
- $4,570+/mo
- Booked ahead
- 41 days
- Average stay
- 2.3 nights
- Most common home size
- 1 bedroom
- Superhosts
- 80%
10. Akron
Known for: Growing revenue · Large market
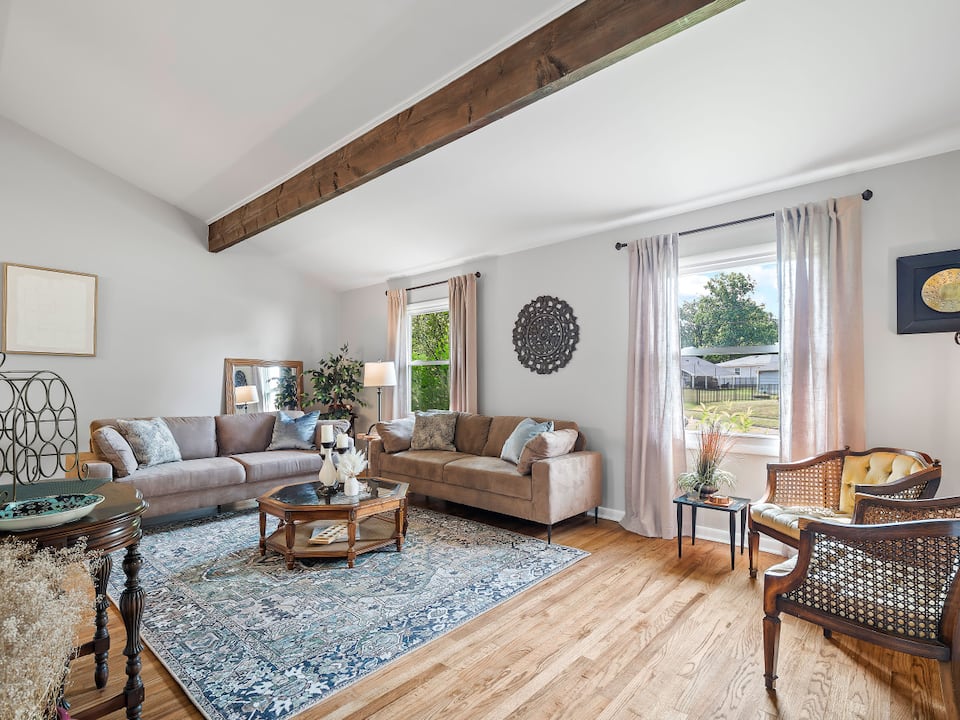


Top-earning Airbnb listings in Akron - Avg. revenue
- $17,200 +12% vs. last year
- Occupancy
- 42%
- Nightly rate
- $150
- Active listings
- 308
Where it places among the 22 ranked markets in Ohio
- Revenue 19th of 22
- Occupancy 8th of 22
- Market size 8th of 22
- Year-round 9th of 22
- Growth 2nd of 22
- How it earns
- Akron listings charge about $150 a night, 38% below the Ohio average, and are booked on 42% of nights. Moderate rates keep revenue per listing at $17,200, 42% below the Ohio average. Its place at #10 rests on revenue growth (2nd of 22) rather than on revenue per listing. A typical listing takes in about $1,640 a month; the top quarter clear $3,010 or more. Revenue per listing rose 12% over the year, the second-biggest gain in Ohio, helped by nightly rates 33% higher, even as the number of listings grew 30%.
- When it earns
- In Akron, the months from May to October earn above the yearly average, led by July at about $3,150 per listing; February is the low point at about $1,430. Bookings arrive closer to the date than in most of Ohio, about 30 days before check-in, and guests stay about 8 nights.
- What sells
- Two-bedroom homes lead the market (33% of entire homes), and houses make up 71% of supply.
- Who it suits
- Best for buyers who are comfortable adjusting prices close to the date.
Revenue per listing by month
$3,150 $1,430- Median listing
- $1,640/mo
- Top 25% of listings
- $3,010+/mo
- Booked ahead
- 30 days
- Average stay
- 8 nights
- Most common home size
- 2 bedrooms
- Superhosts
- 58%
Areas in the full report: Highland Square · Downtown Akron · North Hill
Full Akron Airbnb report
Full ranking
How All 22 Ranked Markets in Ohio Compare
The overall ranking with the five measures behind it. "Slow month" is a market's weakest month of revenue as a share of its best, so a higher figure means steadier income. Select a column heading to re-sort.
| Rockbridge High earnings, high occupancy | $67,258 | 44% | $439 | 39% | +4% | 267 | |
| Logan High earnings, large market | $61,432 | 43% | $413 | 38% | +1% | 802 | |
| Columbus Large market, year-round demand | $26,987 | 44% | $207 | 57% | +7% | 2,489 | |
| 4 | South Bloomingville High occupancy, high earnings | $52,210 | 45% | $335 | 45% | −10% | 156 |
| 5 | Laurelville High earnings, high occupancy | $55,459 | 43% | $389 | 36% | +1% | 176 |
| 6 | Swan Township High earnings, high occupancy | $59,712 | 44% | $371 | 39% | +3% | 102 |
| 7 | Cleveland Large market, year-round demand | $23,064 | 42% | $186 | 50% | +4% | 1,792 |
| 8 | Cincinnati Large market, growing revenue | $25,844 | 42% | $209 | 46% | +5% | 1,724 |
| 9 | Millersburg High earnings | $36,151 | 42% | $252 | 44% | +2% | 168 |
| 10 | Akron Growing revenue, large market | $17,221 | 42% | $148 | 45% | +12% | 308 |
| 11 | Sandusky Large market, growing revenue | $30,996 | 36% | $301 | 21% | +5% | 366 |
| 12 | Port Clinton Growing revenue | $28,239 | 41% | $259 | 19% | +10% | 219 |
| 13 | Kettering High occupancy, year-round demand | $23,308 | 46% | $156 | 55% | −2% | 103 |
| 14 | Dayton Year-round demand, large market | $16,977 | 41% | $157 | 65% | −4% | 514 |
| 15 | Huron Growing revenue, high earnings | $49,572 | 41% | $436 | 13% | +10% | 136 |
| 16 | Put-in-Bay Township Growing revenue, high earnings | $40,524 | 40% | $491 | 15% | +14% | 123 |
| 17 | Oxford High earnings | $36,159 | 31% | $630 | 46% | −19% | 148 |
| 18 | Lakewood Growing revenue | $21,371 | 42% | $176 | 37% | +7% | 189 |
| 19 | Toledo Year-round demand, large market | $15,459 | 41% | $140 | 57% | +2% | 407 |
| 20 | Cleveland Heights | $16,907 | 41% | $153 | 49% | 0% | 247 |
| 21 | Hamilton Growing revenue | $27,096 | 36% | $236 | 35% | +11% | 118 |
| 22 | Geneva-On-The-Lake | $29,301 | 36% | $292 | 27% | 0% | 141 |
By measure
Ohio Airbnb Markets Ranked by Revenue, Nightly Rate and Occupancy
The overall ranking balances five measures. These lists take one at a time, for buyers who care most about income, pricing power, bookings, a steady calendar, momentum or market size.
Highest-earning Airbnb markets in Ohio
Average annual revenue per active listing over the past 12 months. Markets with at least 200 listings.
| # | Market | Revenue |
|---|---|---|
| Rockbridge #1 overall | $67,300 | |
| Logan #2 overall | $61,400 | |
| Sandusky #11 overall | $31,000 | |
| 4 | Port Clinton #12 overall | $28,200 |
| 5 | Columbus #3 overall | $27,000 |
| 6 | Cincinnati #8 overall | $25,800 |
| 7 | Cleveland #7 overall | $23,100 |
| 8 | Akron #10 overall | $17,200 |
| 9 | Dayton #14 overall | $17,000 |
| 10 | Cleveland Heights #20 overall | $16,900 |
| 11 | Toledo #19 overall | $15,500 |
Most expensive Airbnb markets in Ohio by nightly rate
Average rate per booked night. A high rate earns most where occupancy holds up too. Markets with at least 200 listings.
| # | Market | Nightly |
|---|---|---|
| Rockbridge #1 overall | $440 | |
| Logan #2 overall | $415 | |
| Sandusky #11 overall | $300 | |
| 4 | Port Clinton #12 overall | $260 |
| 5 | Cincinnati #8 overall | $210 |
| 6 | Columbus #3 overall | $205 |
| 7 | Cleveland #7 overall | $185 |
| 8 | Dayton #14 overall | $155 |
| 9 | Cleveland Heights #20 overall | $155 |
| 10 | Akron #10 overall | $150 |
| 11 | Toledo #19 overall | $140 |
Highest-occupancy Airbnb markets in Ohio
Share of available nights booked over the past 12 months. Markets with at least 200 listings.
| # | Market | Occupancy |
|---|---|---|
| Columbus #3 overall | 44% | |
| Rockbridge #1 overall | 44% | |
| Logan #2 overall | 43% | |
| 4 | Akron #10 overall | 42% |
| 5 | Cleveland #7 overall | 42% |
| 6 | Cincinnati #8 overall | 42% |
| 7 | Dayton #14 overall | 41% |
| 8 | Port Clinton #12 overall | 41% |
| 9 | Cleveland Heights #20 overall | 41% |
| 10 | Toledo #19 overall | 41% |
| 11 | Sandusky #11 overall | 36% |
Most year-round Airbnb markets in Ohio
Revenue in the slowest month as a share of the best month, so a higher figure means steadier income. Markets with at least 200 listings.
| # | Market | Slow month |
|---|---|---|
| Dayton #14 overall | 65% | |
| Columbus #3 overall | 57% | |
| Toledo #19 overall | 57% | |
| 4 | Cleveland #7 overall | 50% |
| 5 | Cleveland Heights #20 overall | 49% |
| 6 | Cincinnati #8 overall | 46% |
| 7 | Akron #10 overall | 45% |
| 8 | Rockbridge #1 overall | 39% |
| 9 | Logan #2 overall | 38% |
| 10 | Sandusky #11 overall | 21% |
| 11 | Port Clinton #12 overall | 19% |
Fastest-growing Airbnb markets in Ohio
Change in revenue per listing from the year before, among markets where it rose. Markets with at least 200 listings.
| # | Market | Change |
|---|---|---|
| Akron #10 overall | +12% | |
| Port Clinton #12 overall | +10% | |
| Columbus #3 overall | +7% | |
| 4 | Sandusky #11 overall | +5% |
| 5 | Cincinnati #8 overall | +5% |
| 6 | Rockbridge #1 overall | +4% |
| 7 | Cleveland #7 overall | +4% |
| 8 | Toledo #19 overall | +2% |
| 9 | Logan #2 overall | +1% |
Largest Airbnb markets in Ohio
Active listings. Bigger markets have more comparable rentals to price against and more buyers at resale.
| # | Market | Listings |
|---|---|---|
| Columbus #3 overall | 2,490 | |
| Cleveland #7 overall | 1,790 | |
| Cincinnati #8 overall | 1,720 | |
| 4 | Logan #2 overall | 802 |
| 5 | Dayton #14 overall | 514 |
| 6 | Toledo #19 overall | 407 |
| 7 | Sandusky #11 overall | 366 |
| 8 | Akron #10 overall | 308 |
| 9 | Rockbridge #1 overall | 267 |
| 10 | Cleveland Heights #20 overall | 247 |
| 11 | Port Clinton #12 overall | 219 |
| 12 | Lakewood #18 overall | 189 |
| 13 | Laurelville #5 overall | 176 |
| 14 | Millersburg #9 overall | 168 |
| 15 | South Bloomingville #4 overall | 156 |
| 16 | Oxford #17 overall | 148 |
| 17 | Geneva-On-The-Lake #22 overall | 141 |
| 18 | Huron #15 overall | 136 |
| 19 | Put-in-Bay Township #16 overall | 123 |
| 20 | Hamilton #21 overall | 118 |
| 21 | Kettering #13 overall | 103 |
| 22 | Swan Township #6 overall | 102 |
Seasonality
When Airbnbs in Ohio Earn the Most
July is the best month for more than eight in ten ranked markets in Ohio. February is the most common slowest month, in 12 markets.
July earns about 2.2 times what February does
Average revenue per listing across the 22 ranked markets in Ohio, by month
| Month | Avg. revenue per listing | Best month for | Highest-ranked examples |
|---|---|---|---|
| January | $2,360 | 1 market | Put-in-Bay Township |
| February | $2,230 | – | – |
| March | $2,900 | – | – |
| April | $2,750 | – | – |
| May | $3,530 | – | – |
| June | $4,290 | – | – |
| July | $4,840 | 18 markets | Rockbridge, Logan, Columbus |
| August | $4,120 | – | – |
| September | $3,530 | – | – |
| October | $3,440 | 3 markets | South Bloomingville, Millersburg, Oxford |
| November | $2,840 | – | – |
| December | $2,820 | – | – |
Average revenue is per listing across the ranked markets, the line in the chart above. "Best month for" counts the ranked markets whose own revenue peaks in that month.
Named regions
Regions in Ohio
These pages compare the towns of a region that people search by name, with figures for the region as a whole.
- Hocking Hills 5 towns
Management
Who Manages Airbnbs in Ohio?
AirROI ranks the 50 largest of the 153 companies that run 5 or more Airbnb listings in Ohio, by listings, guest rating and growth; companies run 20% of its listings.
Method
How the Ranking Works
The ranking covers the 22 markets in Ohio with at least 100 active Airbnb listings and data through October 2026. Each market is compared with the others on five measures, and markets are ordered by a weighted blend of where they place on each:
- Revenue per listing (35%): average revenue an active listing earned over the past 12 months.
- Occupancy (20%): share of available nights that were booked.
- Market size (20%): active listings. Bigger markets offer more comparable rentals to price against and more buyers when you sell.
- Year-round demand (15%): revenue in the slowest month as a share of the best month. The latest month is left out when its bookings look incomplete.
- Growth (10%): change in revenue per listing from the year before. Markets whose boundaries changed between years are scored in the middle.
Left out: 28 markets whose data predate the latest refresh and 6 towns listed a second time under another spelling. The score measures how rentals perform. It does not include purchase prices, financing, operating costs or local short-term rental rules, which vary by address and should be checked before buying. Figures are in US dollars and match each market's own report; see the data methodology for how listings are tracked.
To check one property before buying, run its address and size through the Airbnb calculator for a revenue, occupancy and nightly-rate range from comparable listings.
FAQ
Frequently Asked Questions About Airbnb Investing in Ohio
What is the best place to buy an Airbnb in Ohio?
Rockbridge ranks first of the 22 markets in Ohio in AirROI's ranking, with $67,300 in average revenue per listing and 44% occupancy. Logan and Columbus follow. The ranking weighs revenue, occupancy, market size, seasonality and growth; it leaves out purchase prices.
What are the most profitable Airbnb locations in Ohio?
By revenue per listing, among markets with at least 200 listings, Rockbridge leads at $67,300 a year, ahead of Logan at $61,400. Profit also depends on what a property costs to buy and run, which varies far more between markets than revenue does.
How much does an Airbnb make in Ohio?
The average active listing in Ohio earned $29,900 over the 12 months to October 2026, at 42% occupancy. Across the ranked markets, the middle half averaged between $23,100 and $40,500 per listing. Averages include listings that operated for only part of the year, so a listing rented all year typically earns more.
What is a good Airbnb occupancy rate in Ohio?
The average listing in Ohio was booked on 42% of available nights over the past 12 months. Half of the ranked markets fall between 41% and 43%, so a market above about 43% sits in the top quarter. Occupancy is only half the picture: a market with lower occupancy can still earn more if its nightly rates are higher.
Where is Airbnb demand highest in Ohio?
Among ranked markets with at least 200 listings, Columbus has the highest occupancy, with 44% of available nights booked, followed by Rockbridge at 44%. Its listings average about $205 a night and $27,000 a year.
Where are Airbnb nightly rates highest in Ohio?
Among ranked markets with at least 200 listings, Rockbridge has the highest average nightly rate, about $440, followed by Logan at $415. Toledo is the least expensive, at about $140. The average booked night in Ohio costs about $240.
What is the best month for Airbnb in Ohio?
July is the highest-earning month for 18 of the 22 ranked markets, followed by October (3). February is the most common slowest month, in 12 of the 22 markets. Each market's report shows its own month-by-month revenue, occupancy and rates.
Which Airbnb markets in Ohio earn the most evenly through the year?
Among ranked markets with at least 200 listings, Dayton has the steadiest income: its slowest month, February, still earns about two-thirds of its best. Columbus follows, at 57%. Steadier markets are easier to budget for, though they do not always earn the most per listing.
Which Airbnb markets are growing fastest in Ohio?
Among ranked markets with at least 200 listings, revenue per listing grew most in Akron, up 12% on the year before, and in Port Clinton, up 10%. A single strong year can reflect events or new supply, so it is worth checking a market's monthly trend before relying on it.
Is Airbnb still profitable in Ohio in 2026?
Revenue per listing grew in 17 of the 22 ranked markets with a comparable year of data; in the typical market it rose 3%. Whether a given property profits depends on its purchase price, financing and running costs.
What are the best smaller Airbnb markets in Ohio?
Among ranked markets with fewer than 200 active listings, South Bloomingville (#4 overall, $52,200 per listing), Laurelville (#5, $55,500) and Swan Township (#6, $59,700) place highest. Smaller markets have fewer comparable rentals to price against, so their averages can move more from year to year.
How many Airbnb listings are there in Ohio?
AirROI tracked 16,800 active Airbnb listings in Ohio over the 12 months to October 2026, across 177 markets. The largest ranked market is Columbus, with 2,490 listings, followed by Cleveland with 1,790.
Do Airbnb hosts need a permit in Ohio?
Rules can come from the state as well as the city or county, and they change often, so check both for any address you consider. In the listing data, most listings display a registration number in 1 of the 22 ranked markets, including Columbus, though that shows what hosts display, not what the rules allow.
Directory
All 177 Airbnb Markets in Ohio
Every Ohio city with an AirROI Airbnb market report, A–Z, with its active listing count.
A
B
- Bainbridge 23 listings
- Beavercreek 37 listings
- Bellefontaine 18 listings
- Berea 46 listings
- Berlin 89 listings
- Boardman 34 listings
- Bowling Green 54 listings
- Buckeye Lake 50 listings
C
- Cambridge 24 listings
- Canaan Township 35 listings
- Canton 65 listings
- Carroll Township 60 listings
- Catawba Island Township 18 listings
- Celina 57 listings
- Chagrin Falls 25 listings
- Chillicothe 88 listings
- Cincinnati 1,724 listings
- Circleville 20 listings
- Cleveland 1,792 listings
- Cleveland Heights 247 listings
- Colerain Township 23 listings
- Columbus 2,489 listings
- Conneaut 46 listings
- Coshocton 37 listings
- Creola 34 listings
- Cuyahoga Falls 52 listings
D
- Danbury Township 23 listings
- Dayton 514 listings
- Deerfield Township 30 listings
- Delaware 42 listings
- Dover 26 listings
- Dover Township 18 listings
- Dublin 32 listings
- Dundee 43 listings
E
- Elk Township 18 listings
- Elyria 27 listings
- Erie Township 22 listings
- Euclid 59 listings
F
- Fairborn 44 listings
- Fairport Harbor 28 listings
- Fairview Park 24 listings
- Findlay 54 listings
- Fort Shawnee 20 listings
- Fremont 19 listings
G
- Gahanna 25 listings
- Gambier 19 listings
- Garfield Heights 26 listings
- Geneva 103 listings
- Geneva-On-The-Lake 141 listings
- Glouster 20 listings
- Granville 23 listings
- Green Township 27 listings
- Grove City 41 listings
H
- Hamilton 118 listings
- Hamilton Township 28 listings
- Hanover Township 39 listings
- Hillsboro 52 listings
- Howard Township 48 listings
- Huber Heights 37 listings
- Hudson 20 listings
- Huron 136 listings
J
- Jackson 19 listings
- Jackson Township 36 listings
- Jefferson Township 41 listings
- Johnstown 20 listings
K
- Kelleys Island 78 listings
- Kettering 103 listings
L
- Lakeside 33 listings
- Lakeside Marblehead 27 listings
- Lakeview 35 listings
- Lakewood 189 listings
- Lancaster 56 listings
- Laurelville 176 listings
- Lebanon 36 listings
- Lee Township 18 listings
- Liberty Township 61 listings
- Lima 72 listings
- Logan 802 listings
- London 29 listings
- Lorain 58 listings
- Loudonville 47 listings
- Loveland 41 listings
M
- Madison 55 listings
- Madison Township 23 listings
- Mansfield 68 listings
- Maple Heights 36 listings
- Margaretta Township 22 listings
- Marietta 53 listings
- Mason 45 listings
- Massillon 44 listings
- Maumee 28 listings
- McArthur 68 listings
- Medina 39 listings
- Mentor 22 listings
- Miami Township 28 listings
- Miamisburg 22 listings
- Middletown 39 listings
- Milford 25 listings
- Millersburg 168 listings
- Milton Township 17 listings
- Monroe Township 33 listings
- Mount Vernon 41 listings
N
- Nelsonville 57 listings
- New Franklin 17 listings
- New Philadelphia 44 listings
- New Plymouth 44 listings
- New Straitsville 30 listings
- Newark 52 listings
- North Canton 39 listings
- Norwalk 19 listings
- Norwood 66 listings
O
- Oak Harbor 26 listings
- Oberlin 49 listings
- Oxford 148 listings
- Oxford Township 20 listings
P
- Parma 73 listings
- Peebles 24 listings
- Perrysburg 51 listings
- Pike Township 18 listings
- Pomeroy 27 listings
- Port Clinton 219 listings
- Portage Lakes 42 listings
- Portsmouth 35 listings
- Put-in-Bay 73 listings
- Put-in-Bay Township 123 listings
R
- Reynoldsburg 61 listings
- Richland Township 18 listings
- Rockbridge 267 listings
- Russells Point 25 listings
S
- Saint Bernard 20 listings
- Salem 20 listings
- Sandusky 366 listings
- Saybrook Township 35 listings
- Scio 22 listings
- Shaker Heights 44 listings
- South Bloomingville 156 listings
- South Euclid 45 listings
- Springfield 61 listings
- Springfield Township 25 listings
- Steubenville 57 listings
- Stokes Township 54 listings
- Sugar Grove 23 listings
- Sugarcreek 68 listings
- Swan Township 102 listings
T
- Thornville 68 listings
- Tiffin 29 listings
- Toledo 407 listings
- Trenton 18 listings
- Trimble Township 24 listings
- Troy 35 listings
- Troy Township 19 listings
U
- Union Township 33 listings
- University Heights 26 listings
- Urbana 22 listings
V
- Vermilion 81 listings
- Vermilion Township 25 listings
W
- Walnut Creek 32 listings
- Warren 42 listings
- Washington Township 52 listings
- West Chester Township 50 listings
- West Union 27 listings
- Westerville 62 listings
- Westlake 31 listings
- Willoughby 33 listings
- Wilmington 79 listings
- Wooster 80 listings
- Worthington Township 27 listings
X
- Xenia 38 listings
Y
- Yellow Springs 41 listings
- Youngstown 97 listings
Z
- Zanesville 38 listings