AirROI ranking · 202686 markets ranked
Best Places to Buy an Airbnb in São Paulo, Brazil (2026)
São Paulo is the best place to buy an Airbnb in São Paulo in 2026, according to AirROI's ranking of 86 markets. Its listings averaged R$35,700 in revenue over the 12 months to October 2026 and were booked on 40% of nights. It leads on the blend rather than on any one measure, placing 1st of 86 for market size, 1st of 86 for year-round demand and 3rd of 86 for occupancy. São Sebastião and Atibaia come next.
- Markets tracked
- 207
- Active Airbnb listings
- 132,000
- Avg. revenue per listing
- R$44,600
- Occupancy rate
- 33%
- Avg. nightly rate
- R$570
- Revenue change, typical market
- +3%
The short answer
São Paulo Airbnb Market at a Glance
Across São Paulo, the 132,000 active Airbnb listings tracked by AirROI, a short-term-rental data firm, averaged R$44,600 over the same period. They were booked on 33% of nights at about R$570 a night; the ranking covers the 86 markets with at least 100 active listings. Revenue per listing rose in 52 of the 85 ranked markets with a comparable year of data, by 3% in the typical one.
The ranking weighs revenue per listing most, then occupancy and market size, then how evenly income spreads across the year and how it changed on the year. It reflects rental performance, not purchase prices or local short-term rental rules. How the ranking works.
Where the top 10 Airbnb markets in São Paulo are
Each dot is one of the 207 markets AirROI tracks in São Paulo (4 outlying ones fall outside the map), sized by active listings and coloured by average revenue per listing. Select a number to jump to its profile.
Money figures on this page are in Brazilian reals, converted from US dollars at R$5.19 per US$, the typical rate from November 2025 to October 2026.
Top 10
The Top 10 Airbnb Markets in São Paulo
Each profile draws on the market's full AirROI report: how it earns, when in the year, who books and what sells. Monthly figures are averages per listing active in that month, so twelve of them add up to more than the annual average, which also counts listings that operated for only part of the year.
| # | Market | Avg. revenue | Occupancy |
|---|---|---|---|
 São Paulo Large market · Year-round demand | R$35,700 | 40% | |
 São Sebastião High earnings · Large market | R$81,800 | 30% | |
 Atibaia High earnings · Growing revenue | R$77,800 | 29% | |
| 4 |  Bertioga High earnings · Large market | R$84,600 | 31% |
| 5 |  Santo Antônio do Pinhal Growing revenue · High earnings | R$66,300 | 32% |
| 6 |  Olímpia High occupancy · Large market | R$38,300 | 39% |
| 7 |  Mairiporã High earnings · Growing revenue | R$74,300 | 29% |
| 8 |  São Pedro Growing revenue · Year-round demand | R$52,900 | 32% |
| 9 |  Campinas High occupancy · Year-round demand | R$31,000 | 39% |
| 10 |  Ilhabela Large market · High earnings | R$64,300 | 32% |
1. São Paulo
Known for: Large market · Year-round demand
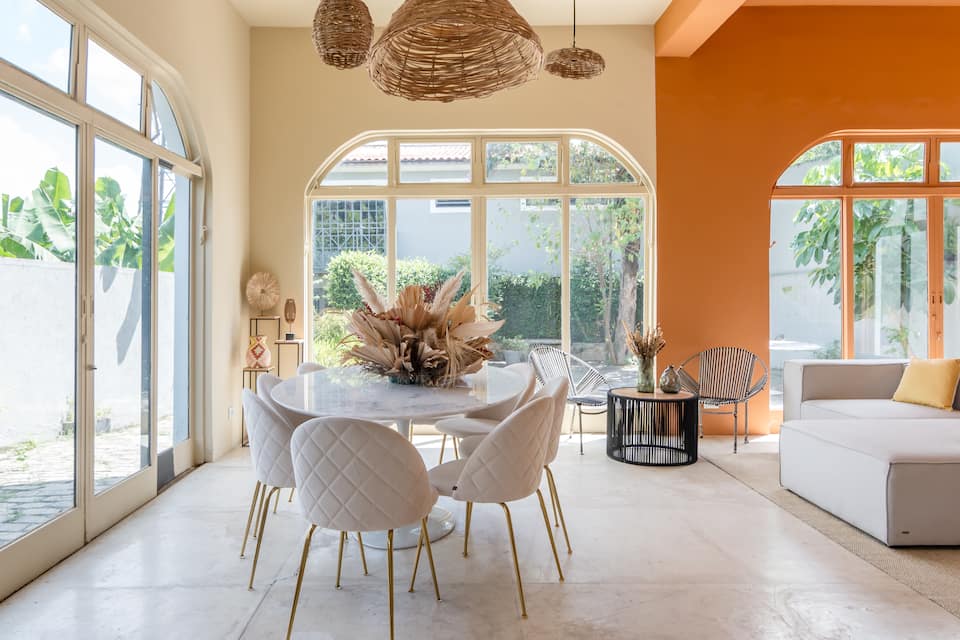
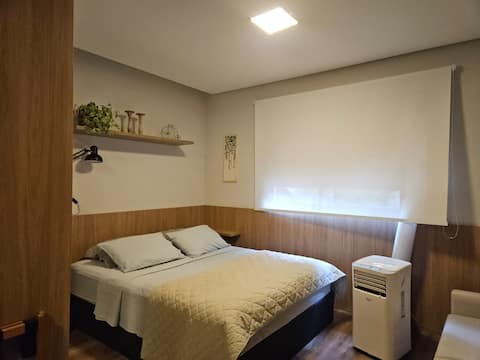

Top-earning Airbnb listings in São Paulo - Avg. revenue
- R$35,700 +5% vs. last year
- Occupancy
- 40%
- Nightly rate
- R$330
- Active listings
- 35,700
Where it places among the 86 ranked markets in São Paulo
- Revenue 53rd of 86
- Occupancy 3rd of 86
- Market size 1st of 86
- Year-round 1st of 86
- Growth 38th of 85
- How it earns
- São Paulo earns on volume. Rates run below the São Paulo average at about R$330 a night, but listings book 40% of nights. Moderate rates keep revenue per listing at R$35,700, 20% below the São Paulo average. A typical listing takes in about R$3,520 a month; the top quarter clear R$5,890 or more.
- When it earns
- Income in São Paulo is unusually even: January, the slowest month, still brings in about 79% of September's revenue.
- What sells
- Smaller places set the market: only 3% of entire homes have three or more bedrooms, against about 33% in the typical market in São Paulo; apartments and condos make up 89% of supply.
- Guest expectations
- Average ratings (4.77 stars) trail the typical market in São Paulo (4.86), which leaves room for a well-run listing to stand out.
- Who it suits
- It suits buyers who want income that holds up all year and prefer a smaller one- or two-bedroom place.
Revenue per listing by month
R$4,680 R$3,690- Median listing
- R$3,520/mo
- Top 25% of listings
- R$5,890+/mo
- Booked ahead
- 25 days
- Average stay
- 5 nights
- Guests from abroad
- 14%
- Most common home size
- 1 bedroom
Areas in the full report: Jardins · Vila Madalena · Centro
Full São Paulo Airbnb report2. São Sebastião
Known for: High earnings · Large market
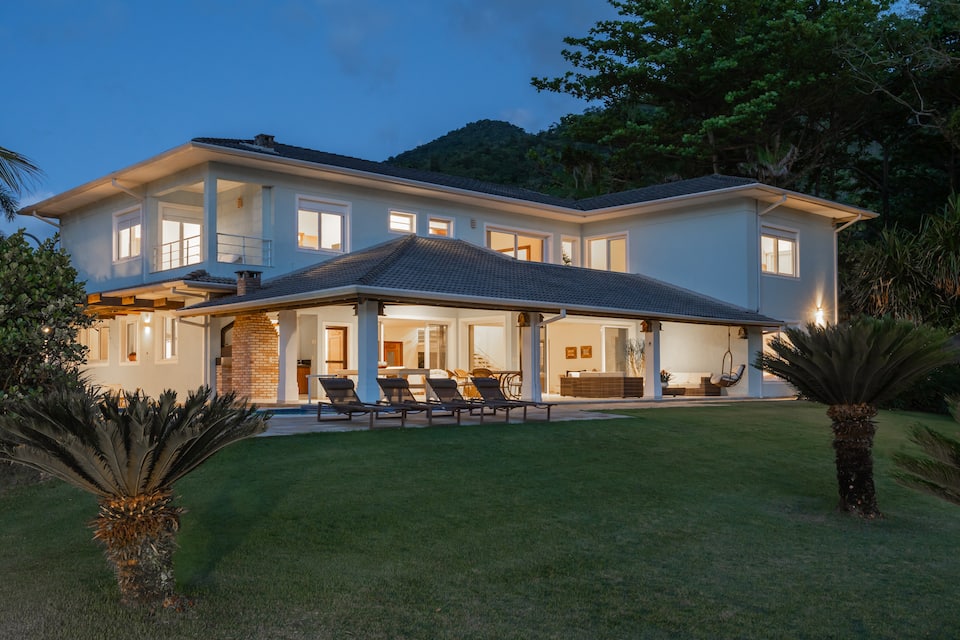
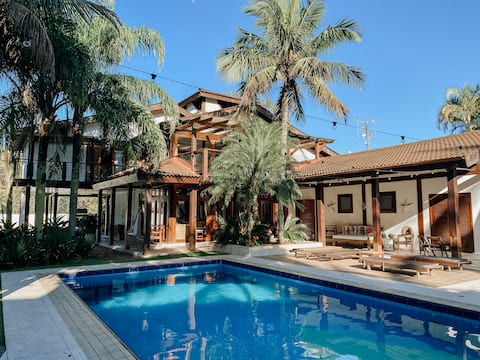
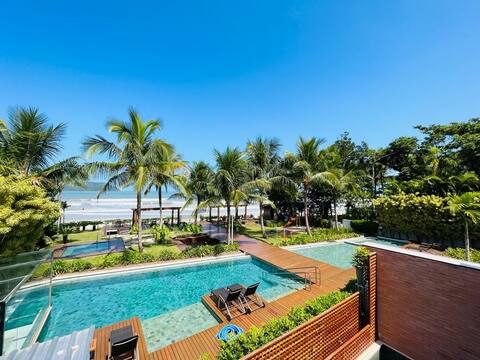
Top-earning Airbnb listings in São Sebastião - Avg. revenue
- R$81,800 +12% vs. last year
- Occupancy
- 30%
- Nightly rate
- R$1,105
- Active listings
- 6,940
Where it places among the 86 ranked markets in São Paulo
- Revenue 5th of 86
- Occupancy 41st of 86
- Market size 5th of 86
- Year-round 82nd of 86
- Growth 17th of 85
- How it earns
- São Sebastião earns on price: guests pay about R$1,105 a night, about twice the São Paulo average. Listings averaged R$81,800 in revenue over the year, the fifth-highest of the 86 ranked markets. In a typical month the median listing brings in about R$6,280, and the best quarter clear R$13,800. Revenue per listing rose 12% over the year, helped by nightly rates 13% higher, even as the number of listings grew 15%.
- When it earns
- São Sebastião's season runs from December to March, peaking in January at about R$19,900 per listing; August, the quietest month, brings in about R$6,310.
- What sells
- Big homes set the market: 54% of entire homes have three or more bedrooms, against about 33% in the typical market in São Paulo, and houses make up 78% of supply.
- Who it suits
- Best for buyers who can furnish and price for a premium stay and can carry costs through a quiet August.
Revenue per listing by month
R$19,900 R$6,310- Median listing
- R$6,280/mo
- Top 25% of listings
- R$13,800+/mo
- Booked ahead
- 39 days
- Average stay
- 5 nights
- Most common home size
- 3 bedrooms
- Superhosts
- 44%
Areas in the full report: Maçãs Beach · Camburi Beach · Boiçucanga
Full São Sebastião Airbnb report3. Atibaia
Known for: High earnings · Growing revenue
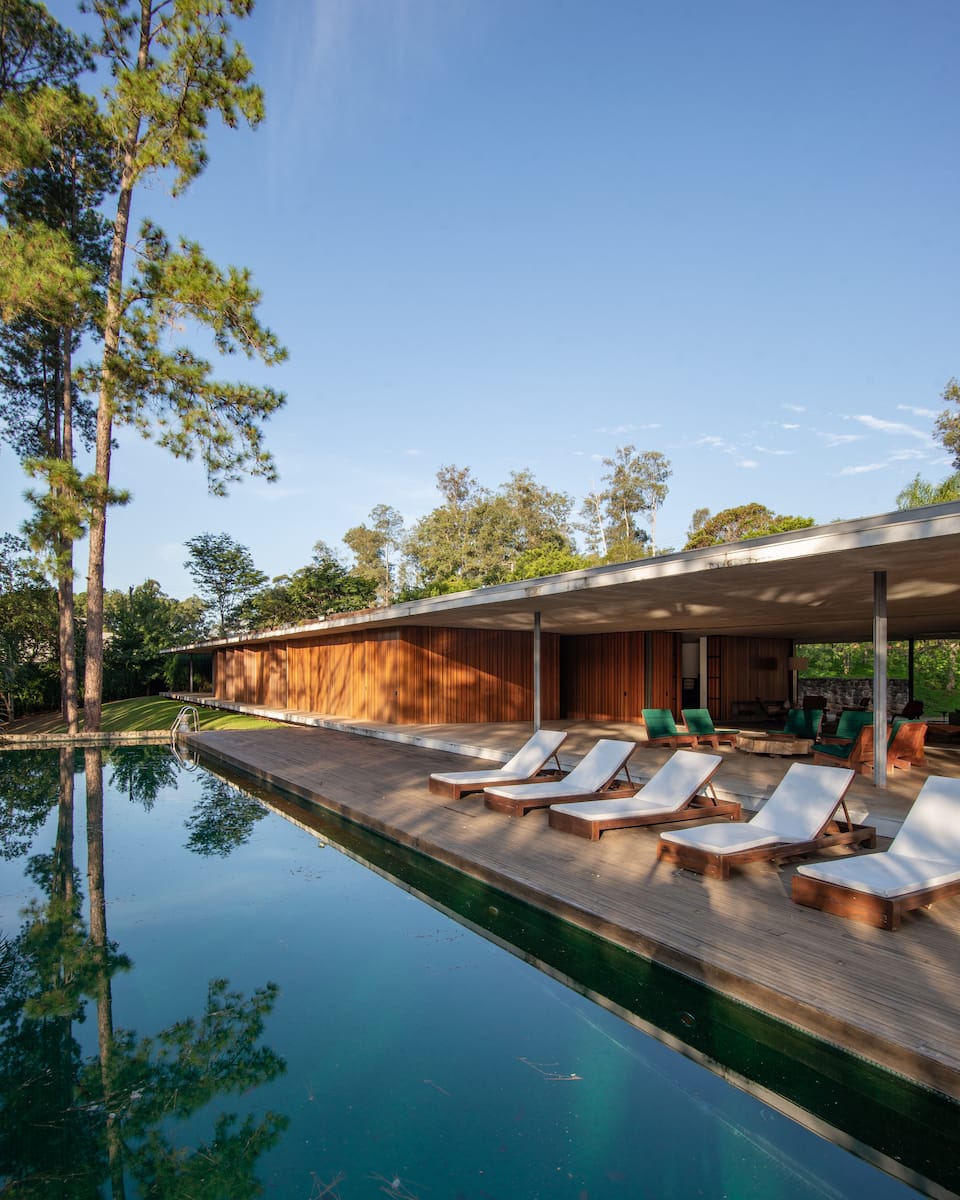
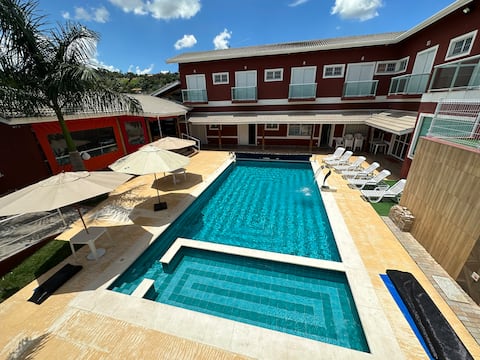

Top-earning Airbnb listings in Atibaia - Avg. revenue
- R$77,800 +12% vs. last year
- Occupancy
- 29%
- Nightly rate
- R$1,040
- Active listings
- 682
Where it places among the 86 ranked markets in São Paulo
- Revenue 6th of 86
- Occupancy 48th of 86
- Market size 24th of 86
- Year-round 45th of 86
- Growth 14th of 85
- How it earns
- Nightly rates set Atibaia apart: about R$1,040, 83% above the São Paulo average. Average revenue per listing came to R$77,800, the sixth-highest of the 86 ranked markets. Month to month, the median listing earns about R$6,370 and a top-quarter listing R$12,800 or more. Revenue per listing rose 12% over the year, helped by nightly rates 21% higher.
- When it earns
- Revenue in Atibaia concentrates from December to March: December earns about R$14,400 per listing, about 1.9 times as much as August.
- What sells
- Big homes set the market: 70% of entire homes have three or more bedrooms, against about 33% in the typical market in São Paulo, and houses make up 84% of supply.
- Who it suits
- A good fit for buyers who can furnish and price for a premium stay and want a large home for groups and families.
Revenue per listing by month
R$14,400 R$7,590- Median listing
- R$6,370/mo
- Top 25% of listings
- R$12,800+/mo
- Booked ahead
- 37 days
- Average stay
- 4 nights
- Most common home size
- 3 bedrooms
- Superhosts
- 46%
Areas in the full report: Centro · Caminho dos Antiquários · Pico do Olho d'Água
Full Atibaia Airbnb report4. Bertioga
Known for: High earnings · Large market
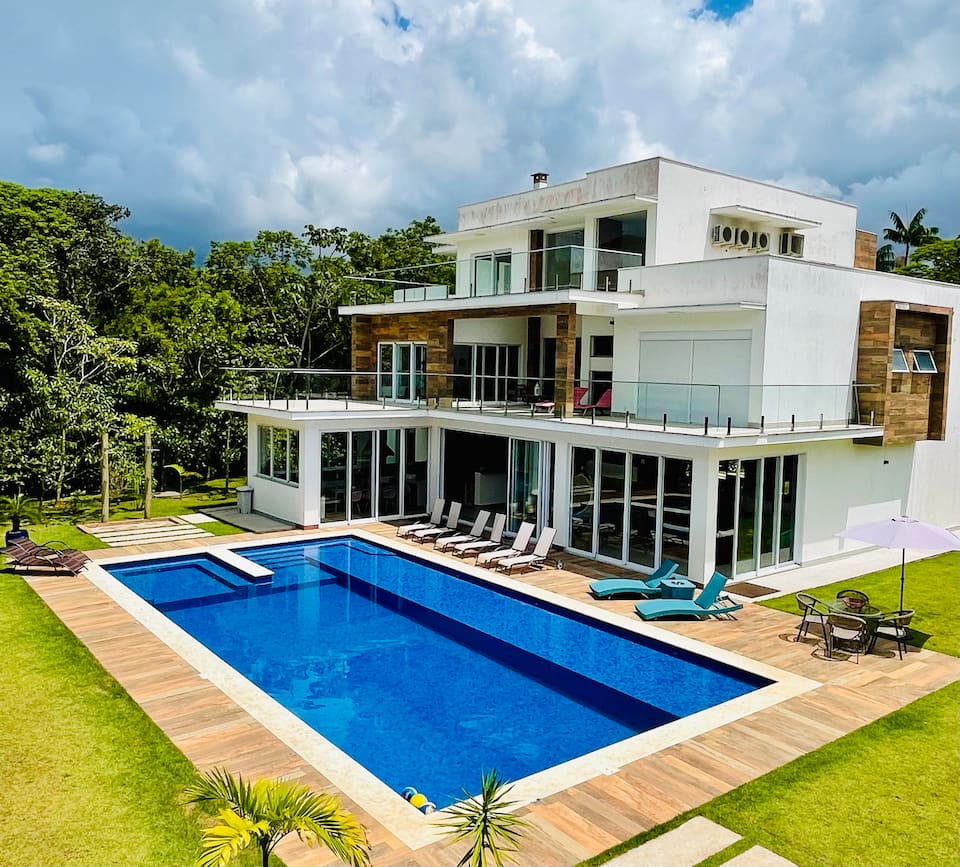
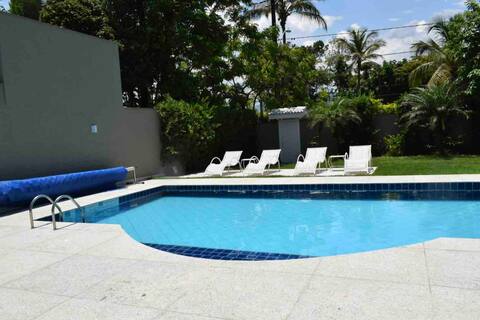

Top-earning Airbnb listings in Bertioga - Avg. revenue
- R$84,600 +3% vs. last year
- Occupancy
- 31%
- Nightly rate
- R$1,135
- Active listings
- 5,340
Where it places among the 86 ranked markets in São Paulo
- Revenue 3rd of 86
- Occupancy 38th of 86
- Market size 6th of 86
- Year-round 86th of 86
- Growth 43rd of 85
- How it earns
- Bertioga earns on price: guests pay about R$1,135 a night, about twice the São Paulo average. That adds up to R$84,600 per listing over the year, the third-highest of the 86 ranked markets. A typical listing takes in about R$7,030 a month; the top quarter clear R$14,700 or more.
- When it earns
- In Bertioga, the months from December to March earn above the yearly average, led by January at about R$22,700 per listing; August is the low point at about R$5,640.
- What sells
- Big homes set the market: 57% of entire homes have three or more bedrooms, against about 33% in the typical market in São Paulo, and apartments and condos make up 48% of supply.
- Who it suits
- It suits buyers who can furnish and price for a premium stay and can ride out a slow August.
Revenue per listing by month
R$22,700 R$5,640- Median listing
- R$7,030/mo
- Top 25% of listings
- R$14,700+/mo
- Booked ahead
- 36 days
- Average stay
- 5 nights
- Most common home size
- 3 bedrooms
- Superhosts
- 42%
Areas in the full report: Praia da Enseada · Praia da Barra do Una · Centro de Bertioga
Full Bertioga Airbnb report5. Santo Antônio do Pinhal
Known for: Growing revenue · High earnings
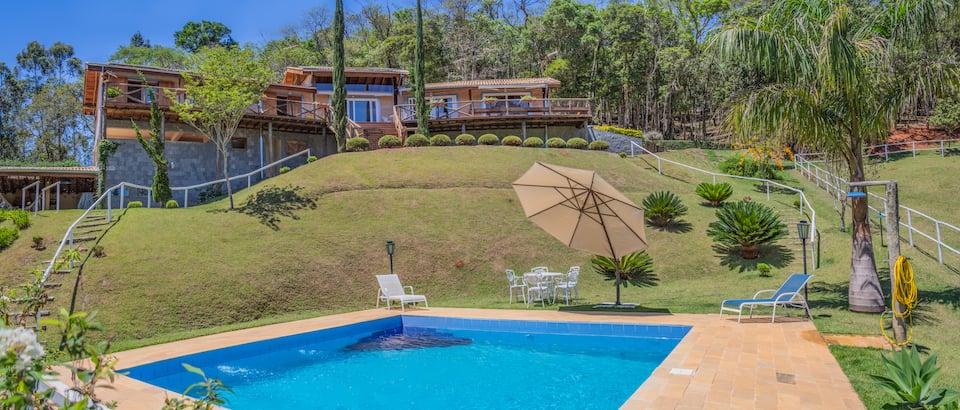
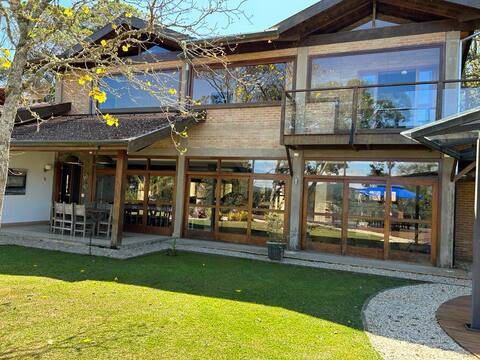

Top-earning Airbnb listings in Santo Antônio do Pinhal - Avg. revenue
- R$66,300 +16% vs. last year
- Occupancy
- 32%
- Nightly rate
- R$695
- Active listings
- 593
Where it places among the 86 ranked markets in São Paulo
- Revenue 18th of 86
- Occupancy 30th of 86
- Market size 27th of 86
- Year-round 56th of 86
- Growth 10th of 85
- How it earns
- Santo Antônio do Pinhal listings charge about R$695 a night, 22% above the São Paulo average, and are booked on 32% of nights. Listings averaged R$66,300 in revenue over the year, 49% above the São Paulo average. In a typical month the median listing brings in about R$5,420, and the best quarter clear R$10,600. Revenue per listing rose 16% over the year, helped by nightly rates 13% higher, even as the number of listings grew 17%.
- When it earns
- Santo Antônio do Pinhal's season runs from June to August, peaking in July at about R$10,600 per listing; February, the quietest month, brings in about R$5,140. Stays are shorter than in most of São Paulo, about 3 nights, so listings turn over often; guests book about 29 days ahead.
- What sells
- The most common entire home has 1 bedroom (60% of entire homes), and houses make up 63% of supply.
- Guest expectations
- Guests rate listings highly, 4.92 stars on average against 4.86 for the typical market in São Paulo, so reviews set a high bar.
Revenue per listing by month
R$10,600 R$5,140- Median listing
- R$5,420/mo
- Top 25% of listings
- R$10,600+/mo
- Booked ahead
- 29 days
- Average stay
- 3 nights
- Most common home size
- 1 bedroom
- Superhosts
- 71%
Areas in the full report: Centro · Pico Agudo · Estância São Pedro
Full Santo Antônio do Pinhal Airbnb report6. Olímpia
Known for: High occupancy · Large market
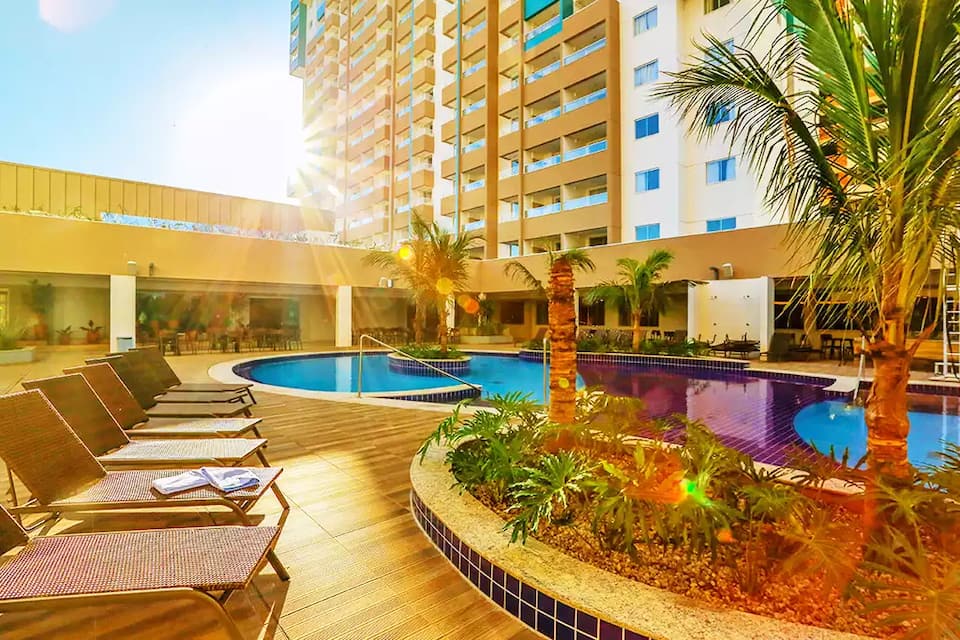
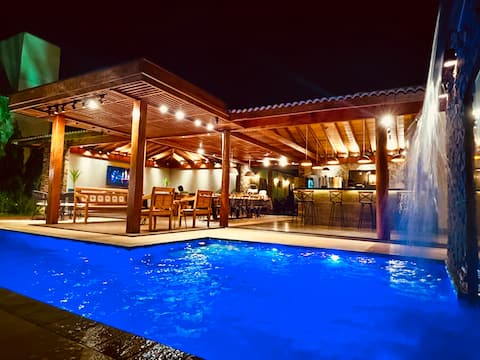
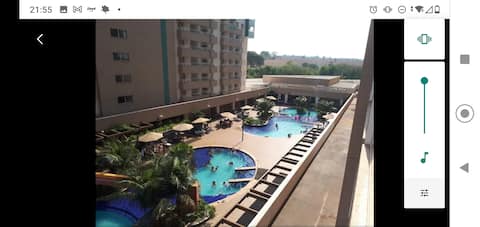
Top-earning Airbnb listings in Olímpia - Avg. revenue
- R$38,300 +4% vs. last year
- Occupancy
- 39%
- Nightly rate
- R$495
- Active listings
- 2,470
Where it places among the 86 ranked markets in São Paulo
- Revenue 48th of 86
- Occupancy 7th of 86
- Market size 11th of 86
- Year-round 22nd of 86
- Growth 39th of 85
- How it earns
- Rates in Olímpia sit below the São Paulo average, at about R$495 a night, but listings are booked on 39% of nights. Moderate rates keep revenue per listing at R$38,300, 14% below the São Paulo average. Its place at #6 rests on occupancy (7th of 86) and market size (11th of 86) rather than on revenue per listing. Month to month, the median listing earns about R$5,010 and a top-quarter listing R$9,000 or more.
- When it earns
- Olímpia has two seasons, July–August and December–January. July is the strongest month at about R$7,920 per listing, and May the quietest at about R$4,710. Guests plan ahead and stay a while: they book about 79 days out and stay about 7 nights, both well above the typical market in São Paulo.
- What sells
- One-bedroom homes lead the market (48% of entire homes), and apartments and condos make up 56% of supply.
- Who it suits
- Best for buyers who would rather price for occupancy than for rate and want income that holds up all year.
Revenue per listing by month
R$7,920 R$4,710- Median listing
- R$5,010/mo
- Top 25% of listings
- R$9,000+/mo
- Booked ahead
- 79 days
- Average stay
- 7 nights
- Most common home size
- 1 bedroom
- Superhosts
- 39%
Areas in the full report: Thermas dos Laranjais · Centro · Jardim das Oliveiras
Full Olímpia Airbnb report7. Mairiporã
Known for: High earnings · Growing revenue



Top-earning Airbnb listings in Mairiporã - Avg. revenue
- R$74,300 +10% vs. last year
- Occupancy
- 29%
- Nightly rate
- R$965
- Active listings
- 590
Where it places among the 86 ranked markets in São Paulo
- Revenue 11th of 86
- Occupancy 54th of 86
- Market size 29th of 86
- Year-round 37th of 86
- Growth 23rd of 85
- How it earns
- Nightly rates set Mairiporã apart: about R$965, 70% above the São Paulo average. That adds up to R$74,300 per listing over the year, 67% above the São Paulo average. A typical listing takes in about R$6,560 a month; the top quarter clear R$13,000 or more. Revenue per listing rose 10% over the year, helped by nightly rates 16% higher, even as the number of listings grew 35%.
- When it earns
- Revenue in Mairiporã concentrates in December and January: December earns about R$12,600 per listing, about 1.8 times as much as October. Guests book early, about 45 days ahead against roughly 32 for the typical market in São Paulo, and stay about 3 nights.
- What sells
- Big homes set the market: 67% of entire homes have three or more bedrooms, against about 33% in the typical market in São Paulo, and houses make up 78% of supply.
- Who it suits
- A good fit for buyers who can furnish and price for a premium stay and want a large home for groups and families.
Revenue per listing by month
R$12,600 R$6,990- Median listing
- R$6,560/mo
- Top 25% of listings
- R$13,000+/mo
- Booked ahead
- 45 days
- Average stay
- 3 nights
- Most common home size
- 3 bedrooms
- Superhosts
- 46%
Areas in the full report: Centro de Mairiporã · Represa de Mairiporã · Parque Estadual da Cantareira
Full Mairiporã Airbnb report8. São Pedro
Known for: Growing revenue · Year-round demand
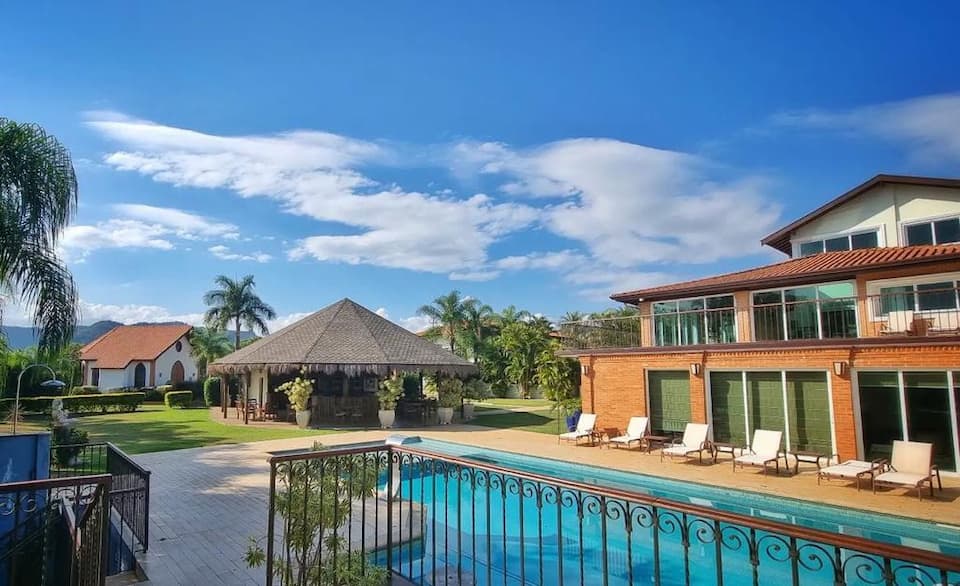

Top-earning Airbnb listings in São Pedro - Avg. revenue
- R$52,900 +11% vs. last year
- Occupancy
- 32%
- Nightly rate
- R$705
- Active listings
- 498
Where it places among the 86 ranked markets in São Paulo
- Revenue 29th of 86
- Occupancy 31st of 86
- Market size 33rd of 86
- Year-round 25th of 86
- Growth 18th of 85
- How it earns
- São Pedro has a milder off-season than most of São Paulo: October, its slowest month, brings in about 59% of December's revenue. Average revenue per listing came to R$52,900, 19% above the São Paulo average. In a typical month the median listing brings in about R$4,460, and the best quarter clear R$9,030. Revenue per listing rose 11% over the year, helped by nightly rates 16% higher, even as the number of listings grew 31%.
- When it earns
- In São Pedro, the months from December to January earn above the yearly average, led by December at about R$9,380 per listing; October is the low point at about R$5,520.
- What sells
- The most common entire home has 1 bedroom (34% of entire homes), and houses make up 60% of supply.
Revenue per listing by month
R$9,380 R$5,520- Median listing
- R$4,460/mo
- Top 25% of listings
- R$9,030+/mo
- Booked ahead
- 40 days
- Average stay
- 5 nights
- Most common home size
- 1 bedroom
- Superhosts
- 51%
Areas in the full report: Centro · Parque das Águas · São Pedro town center
Full São Pedro Airbnb report9. Campinas
Known for: High occupancy · Year-round demand
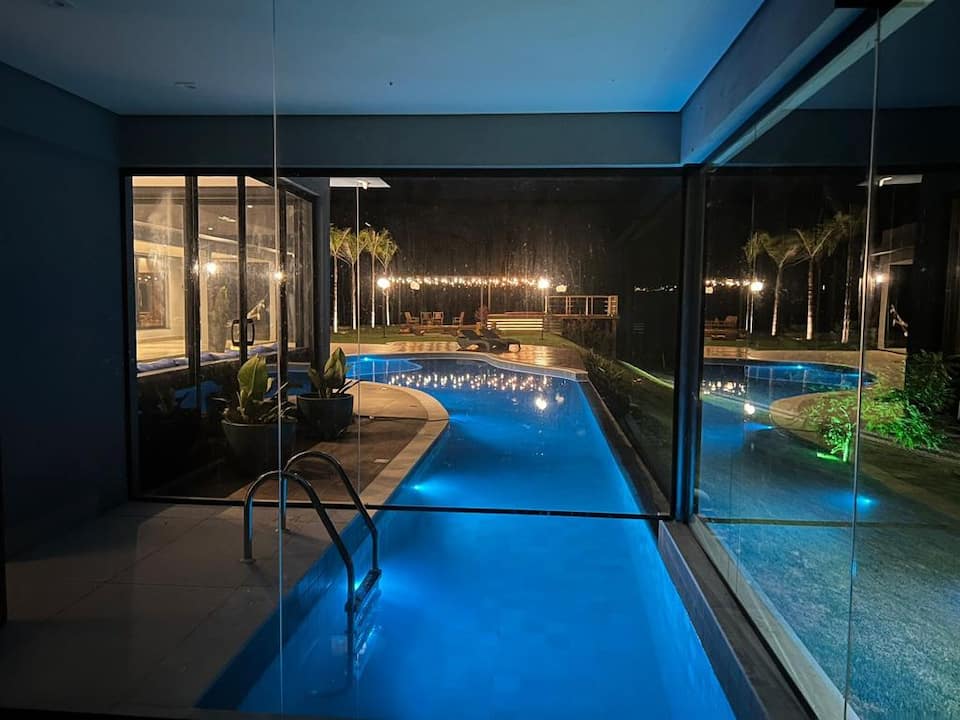
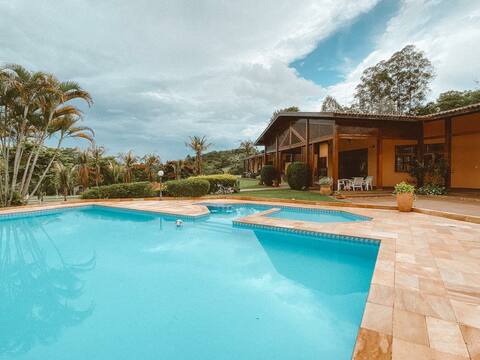
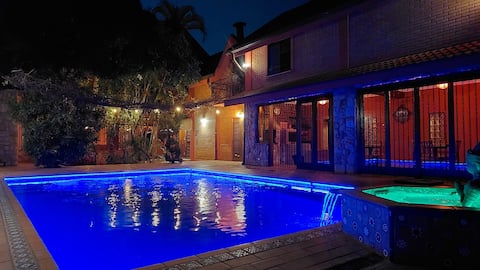
Top-earning Airbnb listings in Campinas - Avg. revenue
- R$31,000 +8% vs. last year
- Occupancy
- 39%
- Nightly rate
- R$315
- Active listings
- 1,870
Where it places among the 86 ranked markets in São Paulo
- Revenue 61st of 86
- Occupancy 6th of 86
- Market size 13th of 86
- Year-round 6th of 86
- Growth 28th of 85
- How it earns
- Campinas earns on volume. Rates run below the São Paulo average at about R$315 a night, but listings book 39% of nights. Moderate rates keep revenue per listing at R$31,000, 31% below the São Paulo average. Its place at #9 rests on occupancy (6th of 86) and year-round demand (6th of 86) rather than on revenue per listing. Month to month, the median listing earns about R$2,630 and a top-quarter listing R$5,120 or more. Revenue per listing rose 8% over the year, helped by nightly rates 19% higher, even as the number of listings grew 43%.
- When it earns
- Campinas earns steadily through the year, from about R$3,260 per listing in April to R$4,410 in December. Guests book later than in most of São Paulo, about 21 days ahead against roughly 32 for the typical market in São Paulo, so pricing close to the date matters; stays average 6 nights.
- What sells
- Few listings are large: just 13% have three or more bedrooms, against about 33% in the typical market in São Paulo; apartments and condos make up 56% of supply.
- Who it suits
- It suits buyers who want income that holds up all year and would rather price for occupancy than for rate.
Revenue per listing by month
R$4,410 R$3,260- Median listing
- R$2,630/mo
- Top 25% of listings
- R$5,120+/mo
- Booked ahead
- 21 days
- Average stay
- 6 nights
- Most common home size
- 1 bedroom
- Superhosts
- 67%
Areas in the full report: Cambui · Barão Geraldo · Centro
Full Campinas Airbnb report10. Ilhabela
Known for: Large market · High earnings
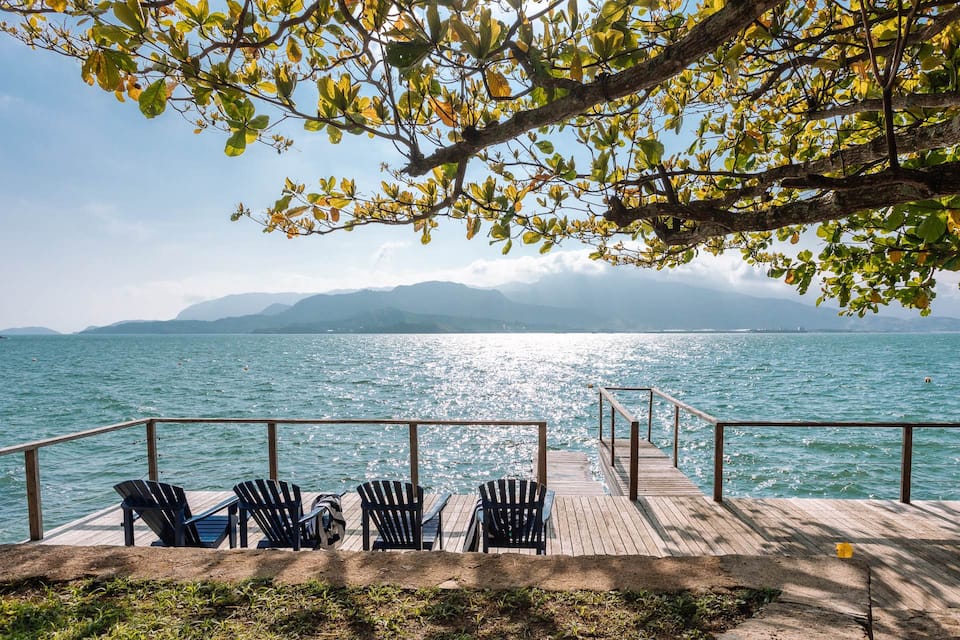


Top-earning Airbnb listings in Ilhabela - Avg. revenue
- R$64,300 +4% vs. last year
- Occupancy
- 32%
- Nightly rate
- R$805
- Active listings
- 3,110
Where it places among the 86 ranked markets in São Paulo
- Revenue 21st of 86
- Occupancy 32nd of 86
- Market size 9th of 86
- Year-round 67th of 86
- Growth 40th of 85
- How it earns
- Ilhabela earns on price: guests pay about R$805 a night, 42% above the São Paulo average. That adds up to R$64,300 per listing over the year, 44% above the São Paulo average. A typical listing takes in about R$4,850 a month; the top quarter clear R$9,940 or more.
- When it earns
- Ilhabela's season runs from December to March, peaking in January at about R$13,600 per listing; August, the quietest month, brings in about R$5,660.
- What sells
- One-bedroom homes lead the market (40% of entire homes), and houses make up 69% of supply.
- Who books
- Guests are overwhelmingly domestic (91%); the most common home cities are São Paulo, Campinas and Guarulhos.
- Who it suits
- Best for buyers who can furnish and price for a premium stay.
Revenue per listing by month
R$13,600 R$5,660- Median listing
- R$4,850/mo
- Top 25% of listings
- R$9,940+/mo
- Booked ahead
- 37 days
- Average stay
- 4 nights
- Most common home size
- 1 bedroom
- Superhosts
- 54%
Areas in the full report: Praia do Curral · Praia da Feiticeira · Centro Histórico
Full Ilhabela Airbnb report
Full ranking
How All 86 Ranked Markets in São Paulo Compare
The overall ranking with the five measures behind it. "Slow month" is a market's weakest month of revenue as a share of its best, so a higher figure means steadier income. Select a column heading to re-sort.
| São Paulo Large market, year-round demand | R$35,732 | 40% | R$332 | 79% | +5% | 35,728 | |
| São Sebastião High earnings, large market | R$81,842 | 30% | R$1,107 | 32% | +12% | 6,938 | |
| Atibaia High earnings, growing revenue | R$77,768 | 29% | R$1,041 | 53% | +12% | 682 | |
| 4 | Bertioga High earnings, large market | R$84,644 | 31% | R$1,135 | 25% | +3% | 5,337 |
| 5 | Santo Antônio do Pinhal Growing revenue, high earnings | R$66,311 | 32% | R$693 | 49% | +16% | 593 |
| 6 | Olímpia High occupancy, large market | R$38,311 | 39% | R$495 | 60% | +4% | 2,471 |
| 7 | Mairiporã High earnings, growing revenue | R$74,297 | 29% | R$967 | 55% | +10% | 590 |
| 8 | São Pedro Growing revenue, year-round demand | R$52,934 | 32% | R$704 | 59% | +11% | 498 |
| 9 | Campinas High occupancy, year-round demand | R$30,953 | 39% | R$316 | 74% | +8% | 1,865 |
| 10 | Ilhabela Large market, high earnings | R$64,292 | 32% | R$807 | 42% | +4% | 3,111 |
| 11 | São Roque High earnings, year-round demand | R$67,707 | 29% | R$799 | 63% | −4% | 576 |
| 12 | Itu High earnings, growing revenue | R$76,549 | 27% | R$1,132 | 54% | +12% | 357 |
| 13 | Campos do Jordão Large market, high earnings | R$69,565 | 29% | R$886 | 36% | +7% | 3,566 |
| 14 | Socorro Large market, high earnings | R$57,189 | 29% | R$662 | 54% | +7% | 880 |
| 15 | São José dos Campos High occupancy, large market | R$40,309 | 37% | R$485 | 56% | +2% | 981 |
| 16 | Osasco High occupancy, year-round demand | R$32,027 | 42% | R$268 | 76% | +13% | 300 |
| 17 | Jundiaí High occupancy, year-round demand | R$44,813 | 41% | R$492 | 68% | −6% | 323 |
| 18 | Jarinu High earnings, year-round demand | R$76,767 | 29% | R$947 | 57% | +5% | 176 |
| 19 | Ubatuba Large market, high earnings | R$52,015 | 33% | R$632 | 32% | +1% | 12,813 |
| 20 | Serra Negra Growing revenue, large market | R$47,106 | 30% | R$511 | 52% | +18% | 636 |
| 21 | Águas de Lindóia Growing revenue, year-round demand | R$41,834 | 31% | R$442 | 57% | +28% | 425 |
| 22 | Barueri Year-round demand, high occupancy | R$35,083 | 38% | R$361 | 75% | −14% | 697 |
| 23 | Sorocaba Growing revenue, high occupancy | R$26,869 | 36% | R$338 | 59% | +18% | 781 |
| 24 | Piracaia High earnings, growing revenue | R$71,588 | 28% | R$1,033 | 56% | +8% | 260 |
| 25 | Joanópolis High earnings, year-round demand | R$61,833 | 30% | R$728 | 57% | +7% | 257 |
| 26 | Mogi das Cruzes High earnings | R$54,112 | 32% | R$720 | 55% | +3% | 287 |
| 27 | São José do Rio Preto Year-round demand, high occupancy | R$27,040 | 36% | R$284 | 70% | +5% | 606 |
| 28 | Bauru High occupancy, year-round demand | R$21,337 | 40% | R$228 | 74% | +21% | 593 |
| 29 | Mairinque High earnings, large market | R$77,748 | 26% | R$1,068 | 50% | −1% | 453 |
| 30 | Ibiúna High earnings, large market | R$70,000 | 26% | R$1,019 | 52% | −1% | 700 |
| 31 | São Bento do Sapucaí High earnings, growing revenue | R$63,716 | 29% | R$684 | 47% | +9% | 535 |
| 32 | Aparecida Growing revenue, year-round demand | R$35,862 | 31% | R$421 | 60% | +11% | 543 |
| 33 | Itatiba High earnings | R$84,135 | 29% | R$962 | 50% | −3% | 207 |
| 34 | Santos Large market, high occupancy | R$37,174 | 35% | R$424 | 45% | −1% | 2,631 |
| 35 | São Bernardo do Campo High occupancy, year-round demand | R$33,563 | 37% | R$361 | 70% | +8% | 241 |
| 36 | Guarulhos Year-round demand, high occupancy | R$22,318 | 36% | R$244 | 77% | 0% | 982 |
| 37 | Cotia Year-round demand, high earnings | R$50,977 | 31% | R$783 | 57% | −4% | 359 |
| 38 | Santo André Growing revenue, high occupancy | R$25,624 | 39% | R$272 | 73% | +33% | 167 |
| 39 | Holambra High occupancy, growing revenue | R$48,238 | 33% | R$521 | 57% | +7% | 160 |
| 40 | Americana High occupancy, year-round demand | R$35,441 | 38% | R$375 | 60% | – | 216 |
| 41 | Ribeirão Preto Large market, growing revenue | R$30,122 | 33% | R$421 | 42% | +11% | 1,689 |
| 42 | Botucatu Year-round demand, growing revenue | R$22,292 | 35% | R$310 | 75% | +10% | 295 |
| 43 | Itupeva High earnings | R$100,398 | 28% | R$1,296 | 41% | −7% | 173 |
| 44 | Brotas Growing revenue, year-round demand | R$42,504 | 26% | R$621 | 59% | +14% | 327 |
| 45 | Guarujá Large market | R$41,845 | 29% | R$671 | 33% | +3% | 8,523 |
| 46 | Pindamonhangaba Growing revenue, year-round demand | R$37,449 | 31% | R$506 | 57% | +25% | 161 |
| 47 | Araraquara Growing revenue, high occupancy | R$22,406 | 38% | R$244 | 71% | +32% | 167 |
| 48 | Santa Isabel High earnings, year-round demand | R$65,984 | 23% | R$1,146 | 57% | +6% | 182 |
| 49 | Indaiatuba High occupancy | R$45,876 | 36% | R$589 | 49% | −16% | 295 |
| 50 | Cunha Growing revenue | R$40,371 | 26% | R$529 | 55% | +12% | 451 |
| 51 | Guararema High earnings | R$65,657 | 27% | R$942 | 48% | +3% | 219 |
| 52 | Boituva High earnings, growing revenue | R$57,900 | 28% | R$860 | 39% | +7% | 286 |
| 53 | Taubaté Growing revenue, year-round demand | R$25,271 | 35% | R$301 | 64% | +23% | 160 |
| 54 | São Carlos Year-round demand, growing revenue | R$21,088 | 33% | R$275 | 71% | +9% | 424 |
| 55 | São Caetano do Sul Growing revenue, high occupancy | R$23,097 | 37% | R$223 | 70% | +36% | 118 |
| 56 | Itaí High earnings | R$85,863 | 22% | R$1,426 | 55% | −1% | 104 |
| 57 | Igaratá High earnings | R$74,816 | 24% | R$1,228 | 45% | −2% | 221 |
| 58 | Nazaré Paulista High earnings | R$67,157 | 26% | R$914 | 52% | −6% | 192 |
| 59 | Piracicaba Year-round demand | R$25,177 | 33% | R$337 | 63% | −5% | 386 |
| 60 | Paranapanema High earnings | R$69,513 | 26% | R$1,181 | 41% | −2% | 214 |
| 61 | Bragança Paulista High earnings | R$53,478 | 27% | R$864 | 51% | −10% | 270 |
| 62 | Jacareí High earnings | R$51,076 | 31% | R$704 | 48% | −10% | 157 |
| 63 | Águas de São Pedro High occupancy | R$44,766 | 34% | R$597 | 42% | +2% | 119 |
| 64 | Caraguatatuba Large market | R$34,398 | 28% | R$569 | 32% | −1% | 3,631 |
| 65 | Pardinho High earnings | R$54,931 | 26% | R$866 | 43% | +2% | 170 |
| 66 | Guaratinguetá Growing revenue, year-round demand | R$33,376 | 28% | R$497 | 63% | +16% | 158 |
| 67 | Marília Year-round demand, high occupancy | R$23,890 | 34% | R$285 | 61% | −5% | 180 |
| 68 | Presidente Prudente High occupancy, year-round demand | R$19,023 | 36% | R$217 | 62% | −2% | 274 |
| 69 | Limeira | R$46,888 | 30% | R$575 | 51% | −2% | 123 |
| 70 | Suzano High earnings | R$49,405 | 31% | R$702 | 42% | −10% | 129 |
| 71 | Águas de Santa Bárbara Growing revenue, high earnings | R$48,777 | 26% | R$830 | 40% | +10% | 132 |
| 72 | Praia Grande Large market | R$23,397 | 28% | R$399 | 38% | −2% | 8,314 |
| 73 | São Vicente Large market | R$20,222 | 30% | R$301 | 48% | +1% | 1,198 |
| 74 | Peruíbe Large market | R$32,260 | 25% | R$633 | 34% | −2% | 1,377 |
| 75 | Araçatuba High occupancy | R$22,718 | 35% | R$293 | 53% | −16% | 196 |
| 76 | Franca Year-round demand | R$17,508 | 29% | R$287 | 71% | −4% | 279 |
| 77 | Araçoiaba da Serra High earnings | R$49,379 | 23% | R$874 | 53% | −14% | 159 |
| 78 | Itanhaem Large market | R$26,459 | 25% | R$552 | 38% | −2% | 2,184 |
| 79 | Espírito Santo do Pinhal | R$46,665 | 26% | R$620 | 51% | −13% | 132 |
| 80 | Pirassununga | R$21,649 | 30% | R$314 | 55% | +1% | 107 |
| 81 | Barretos Large market | R$21,405 | 29% | R$553 | 29% | −2% | 485 |
| 82 | Mongaguá Large market | R$21,607 | 25% | R$462 | 34% | −5% | 1,181 |
| 83 | Juquitiba | R$36,853 | 22% | R$762 | 43% | −6% | 167 |
| 84 | Cachoeira Paulista | R$16,340 | 23% | R$368 | 54% | 0% | 400 |
| 85 | Ilha Comprida | R$18,779 | 24% | R$419 | 34% | +6% | 450 |
| 86 | Cananéia | R$20,315 | 25% | R$439 | 46% | +2% | 146 |
By measure
São Paulo Airbnb Markets Ranked by Revenue, Nightly Rate and Occupancy
The overall ranking balances five measures. These lists take one at a time, for buyers who care most about income, pricing power, bookings, a steady calendar, momentum or market size.
Highest-earning Airbnb markets in São Paulo
Average annual revenue per active listing over the past 12 months. Markets with at least 200 listings.
| # | Market | Revenue |
|---|---|---|
| Bertioga #4 overall | R$84,600 | |
| Itatiba #33 overall | R$84,100 | |
| São Sebastião #2 overall | R$81,800 | |
| 4 | Atibaia #3 overall | R$77,800 |
| 5 | Mairinque #29 overall | R$77,700 |
| 6 | Itu #12 overall | R$76,500 |
| 7 | Igaratá #57 overall | R$74,800 |
| 8 | Mairiporã #7 overall | R$74,300 |
| 9 | Piracaia #24 overall | R$71,600 |
| 10 | Ibiúna #30 overall | R$70,000 |
| 11 | Campos do Jordão #13 overall | R$69,600 |
| 12 | Paranapanema #60 overall | R$69,500 |
| 13 | São Roque #11 overall | R$67,700 |
| 14 | Santo Antônio do Pinhal #5 overall | R$66,300 |
| 15 | Guararema #51 overall | R$65,700 |
| 16 | Ilhabela #10 overall | R$64,300 |
| 17 | São Bento do Sapucaí #31 overall | R$63,700 |
| 18 | Joanópolis #25 overall | R$61,800 |
| 19 | Boituva #52 overall | R$57,900 |
| 20 | Socorro #14 overall | R$57,200 |
| 21 | Mogi das Cruzes #26 overall | R$54,100 |
| 22 | Bragança Paulista #61 overall | R$53,500 |
| 23 | São Pedro #8 overall | R$52,900 |
| 24 | Ubatuba #19 overall | R$52,000 |
| 25 | Cotia #37 overall | R$51,000 |
Most expensive Airbnb markets in São Paulo by nightly rate
Average rate per booked night. A high rate earns most where occupancy holds up too. Markets with at least 200 listings.
| # | Market | Nightly |
|---|---|---|
| Igaratá #57 overall | R$1,230 | |
| Paranapanema #60 overall | R$1,180 | |
| Bertioga #4 overall | R$1,135 | |
| 4 | Itu #12 overall | R$1,130 |
| 5 | São Sebastião #2 overall | R$1,105 |
| 6 | Mairinque #29 overall | R$1,070 |
| 7 | Atibaia #3 overall | R$1,040 |
| 8 | Piracaia #24 overall | R$1,035 |
| 9 | Ibiúna #30 overall | R$1,020 |
| 10 | Mairiporã #7 overall | R$965 |
| 11 | Itatiba #33 overall | R$960 |
| 12 | Guararema #51 overall | R$940 |
| 13 | Campos do Jordão #13 overall | R$885 |
| 14 | Bragança Paulista #61 overall | R$865 |
| 15 | Boituva #52 overall | R$860 |
| 16 | Ilhabela #10 overall | R$805 |
| 17 | São Roque #11 overall | R$800 |
| 18 | Cotia #37 overall | R$785 |
| 19 | Joanópolis #25 overall | R$730 |
| 20 | Mogi das Cruzes #26 overall | R$720 |
| 21 | São Pedro #8 overall | R$705 |
| 22 | Santo Antônio do Pinhal #5 overall | R$695 |
| 23 | São Bento do Sapucaí #31 overall | R$685 |
| 24 | Guarujá #45 overall | R$670 |
| 25 | Socorro #14 overall | R$660 |
Highest-occupancy Airbnb markets in São Paulo
Share of available nights booked over the past 12 months. Markets with at least 200 listings.
| # | Market | Occupancy |
|---|---|---|
| Osasco #16 overall | 42% | |
| Jundiaí #17 overall | 41% | |
| São Paulo #1 overall | 40% | |
| 4 | Bauru #28 overall | 40% |
| 5 | Campinas #9 overall | 39% |
| 6 | Olímpia #6 overall | 39% |
| 7 | Americana #40 overall | 38% |
| 8 | Barueri #22 overall | 38% |
| 9 | São Bernardo do Campo #35 overall | 37% |
| 10 | São José dos Campos #15 overall | 37% |
| 11 | São José do Rio Preto #27 overall | 36% |
| 12 | Guarulhos #36 overall | 36% |
| 13 | Sorocaba #23 overall | 36% |
| 14 | Presidente Prudente #68 overall | 36% |
| 15 | Indaiatuba #49 overall | 36% |
| 16 | Santos #34 overall | 35% |
| 17 | Botucatu #42 overall | 35% |
| 18 | São Carlos #54 overall | 33% |
| 19 | Piracicaba #59 overall | 33% |
| 20 | Ubatuba #19 overall | 33% |
| 21 | Ribeirão Preto #41 overall | 33% |
| 22 | Santo Antônio do Pinhal #5 overall | 32% |
| 23 | São Pedro #8 overall | 32% |
| 24 | Ilhabela #10 overall | 32% |
| 25 | Mogi das Cruzes #26 overall | 32% |
Most year-round Airbnb markets in São Paulo
Revenue in the slowest month as a share of the best month, so a higher figure means steadier income. Markets with at least 200 listings.
| # | Market | Slow month |
|---|---|---|
| São Paulo #1 overall | 79% | |
| Guarulhos #36 overall | 77% | |
| Osasco #16 overall | 76% | |
| 4 | Barueri #22 overall | 75% |
| 5 | Botucatu #42 overall | 75% |
| 6 | Campinas #9 overall | 74% |
| 7 | Bauru #28 overall | 74% |
| 8 | São Carlos #54 overall | 71% |
| 9 | Franca #76 overall | 71% |
| 10 | São José do Rio Preto #27 overall | 70% |
| 11 | São Bernardo do Campo #35 overall | 70% |
| 12 | Jundiaí #17 overall | 68% |
| 13 | São Roque #11 overall | 63% |
| 14 | Piracicaba #59 overall | 63% |
| 15 | Presidente Prudente #68 overall | 62% |
| 16 | Olímpia #6 overall | 60% |
| 17 | Aparecida #32 overall | 60% |
| 18 | Americana #40 overall | 60% |
| 19 | Sorocaba #23 overall | 59% |
| 20 | São Pedro #8 overall | 59% |
| 21 | Brotas #44 overall | 59% |
| 22 | Águas de Lindóia #21 overall | 57% |
| 23 | Cotia #37 overall | 57% |
| 24 | Joanópolis #25 overall | 57% |
| 25 | São José dos Campos #15 overall | 56% |
Fastest-growing Airbnb markets in São Paulo
Change in revenue per listing from the year before, among markets where it rose. Markets with at least 200 listings.
| # | Market | Change |
|---|---|---|
| Águas de Lindóia #21 overall | +28% | |
| Bauru #28 overall | +21% | |
| Serra Negra #20 overall | +18% | |
| 4 | Sorocaba #23 overall | +18% |
| 5 | Santo Antônio do Pinhal #5 overall | +16% |
| 6 | Brotas #44 overall | +14% |
| 7 | Osasco #16 overall | +13% |
| 8 | Atibaia #3 overall | +12% |
| 9 | Itu #12 overall | +12% |
| 10 | Cunha #50 overall | +12% |
| 11 | São Sebastião #2 overall | +12% |
| 12 | São Pedro #8 overall | +11% |
| 13 | Ribeirão Preto #41 overall | +11% |
| 14 | Aparecida #32 overall | +11% |
| 15 | Botucatu #42 overall | +10% |
| 16 | Mairiporã #7 overall | +10% |
| 17 | São Bento do Sapucaí #31 overall | +9% |
| 18 | São Carlos #54 overall | +9% |
| 19 | São Bernardo do Campo #35 overall | +8% |
| 20 | Piracaia #24 overall | +8% |
| 21 | Campinas #9 overall | +8% |
| 22 | Campos do Jordão #13 overall | +7% |
| 23 | Joanópolis #25 overall | +7% |
| 24 | Socorro #14 overall | +7% |
| 25 | Boituva #52 overall | +7% |
Largest Airbnb markets in São Paulo
Active listings. Bigger markets have more comparable rentals to price against and more buyers at resale.
| # | Market | Listings |
|---|---|---|
| São Paulo #1 overall | 35,700 | |
| Ubatuba #19 overall | 12,800 | |
| Guarujá #45 overall | 8,520 | |
| 4 | Praia Grande #72 overall | 8,310 |
| 5 | São Sebastião #2 overall | 6,940 |
| 6 | Bertioga #4 overall | 5,340 |
| 7 | Caraguatatuba #64 overall | 3,630 |
| 8 | Campos do Jordão #13 overall | 3,570 |
| 9 | Ilhabela #10 overall | 3,110 |
| 10 | Santos #34 overall | 2,630 |
| 11 | Olímpia #6 overall | 2,470 |
| 12 | Itanhaem #78 overall | 2,180 |
| 13 | Campinas #9 overall | 1,870 |
| 14 | Ribeirão Preto #41 overall | 1,690 |
| 15 | Peruíbe #74 overall | 1,380 |
| 16 | São Vicente #73 overall | 1,200 |
| 17 | Mongaguá #82 overall | 1,180 |
| 18 | Guarulhos #36 overall | 982 |
| 19 | São José dos Campos #15 overall | 981 |
| 20 | Socorro #14 overall | 880 |
| 21 | Sorocaba #23 overall | 781 |
| 22 | Ibiúna #30 overall | 700 |
| 23 | Barueri #22 overall | 697 |
| 24 | Atibaia #3 overall | 682 |
| 25 | Serra Negra #20 overall | 636 |
Seasonality
When Airbnbs in São Paulo Earn the Most
December is the best month for nearly six in ten ranked markets in São Paulo. August is the most common slowest month, in 27 markets.
January earns about 1.8 times what August does
Average revenue per listing across the 86 ranked markets in São Paulo, by month
| Month | Avg. revenue per listing | Best month for | Highest-ranked examples |
|---|---|---|---|
| January | R$8,190 | 12 markets | São Sebastião, Bertioga, Ilhabela |
| February | R$5,490 | – | – |
| March | R$5,850 | – | – |
| April | R$5,210 | 1 market | Ribeirão Preto |
| May | R$4,520 | – | – |
| June | R$4,650 | – | – |
| July | R$5,760 | 18 markets | Santo Antônio do Pinhal, Olímpia, Campos do Jordão |
| August | R$4,500 | 2 markets | Bauru, Barretos |
| September | R$4,730 | 3 markets | São Paulo, Osasco, Marília |
| October | R$4,840 | 1 market | Barueri |
| November | R$5,120 | – | – |
| December | R$7,620 | 49 markets | Atibaia, Mairiporã, São Pedro |
Average revenue is per listing across the ranked markets, the line in the chart above. "Best month for" counts the ranked markets whose own revenue peaks in that month.
Method
How the Ranking Works
The ranking covers the 86 markets in São Paulo with at least 100 active Airbnb listings and data through October 2026. Each market is compared with the others on five measures, and markets are ordered by a weighted blend of where they place on each:
- Revenue per listing (35%): average revenue an active listing earned over the past 12 months.
- Occupancy (20%): share of available nights that were booked.
- Market size (20%): active listings. Bigger markets offer more comparable rentals to price against and more buyers when you sell.
- Year-round demand (15%): revenue in the slowest month as a share of the best month. The latest month is left out when its bookings look incomplete.
- Growth (10%): change in revenue per listing from the year before. Markets whose boundaries changed between years are scored in the middle.
Left out: 8 markets whose data predate the latest refresh and one town listed a second time under another spelling. The score measures how rentals perform. It does not include purchase prices, financing, operating costs or local short-term rental rules, which vary by address and should be checked before buying. Figures are in Brazilian reals and match each market's own report; see the data methodology for how listings are tracked.
To check one property before buying, run its address and size through the Airbnb calculator for a revenue, occupancy and nightly-rate range from comparable listings.
FAQ
Frequently Asked Questions About Airbnb Investing in São Paulo
What is the best place to buy an Airbnb in São Paulo?
São Paulo ranks first of the 86 markets in São Paulo in AirROI's ranking, with R$35,700 in average revenue per listing and 40% occupancy. São Sebastião and Atibaia follow. The ranking weighs revenue, occupancy, market size, seasonality and growth; it leaves out purchase prices.
What are the most profitable Airbnb locations in São Paulo?
By revenue per listing, among markets with at least 200 listings, Bertioga leads at R$84,600 a year, ahead of Itatiba at R$84,100. Profit also depends on what a property costs to buy and run, which varies far more between markets than revenue does.
How much does an Airbnb make in São Paulo?
The average active listing in São Paulo earned R$44,600 over the 12 months to October 2026, at 33% occupancy. Across the ranked markets, the middle half averaged between R$26,500 and R$61,800 per listing. Averages include listings that operated for only part of the year, so a listing rented all year typically earns more.
What is a good Airbnb occupancy rate in São Paulo?
The average listing in São Paulo was booked on 33% of available nights over the past 12 months. Half of the ranked markets fall between 27% and 34%, so a market above about 34% sits in the top quarter. Occupancy is only half the picture: a market with lower occupancy can still earn more if its nightly rates are higher.
Where is Airbnb demand highest in São Paulo?
Among ranked markets with at least 200 listings, Osasco has the highest occupancy, with 42% of available nights booked, followed by Jundiaí at 41%. Its listings average about R$270 a night and R$32,000 a year.
Where are Airbnb nightly rates highest in São Paulo?
Among ranked markets with at least 200 listings, Igaratá has the highest average nightly rate, about R$1,230, followed by Paranapanema at R$1,180. Presidente Prudente is the least expensive, at about R$215. The average booked night in São Paulo costs about R$570.
What is the best month for Airbnb in São Paulo?
December is the highest-earning month for 49 of the 86 ranked markets, followed by July (18). August is the most common slowest month, in 27 of the 86 markets. Each market's report shows its own month-by-month revenue, occupancy and rates.
Which Airbnb markets in São Paulo earn the most evenly through the year?
Among ranked markets with at least 200 listings, São Paulo has the steadiest income: its slowest month, January, still earns about 79% of its best. Guarulhos follows, at 77%. Steadier markets are easier to budget for, though they do not always earn the most per listing.
Which Airbnb markets are growing fastest in São Paulo?
Among ranked markets with at least 200 listings, revenue per listing grew most in Águas de Lindóia, up 28% on the year before, and in Bauru, up 21%. A single strong year can reflect events or new supply, so it is worth checking a market's monthly trend before relying on it.
Is Airbnb still profitable in São Paulo in 2026?
Revenue per listing grew in 52 of the 85 ranked markets with a comparable year of data; in the typical market it rose 3%. Whether a given property profits depends on its purchase price, financing and running costs.
What are the best smaller Airbnb markets in São Paulo?
Among ranked markets with fewer than 300 active listings, Jarinu (#18 overall, R$76,800 per listing), Piracaia (#24, R$71,600) and Joanópolis (#25, R$61,800) place highest. Smaller markets have fewer comparable rentals to price against, so their averages can move more from year to year.
How many Airbnb listings are there in São Paulo?
AirROI tracked 132,000 active Airbnb listings in São Paulo over the 12 months to October 2026, across 207 markets. The largest ranked market is São Paulo, with 35,700 listings, followed by Ubatuba with 12,800.
Directory
All 207 Airbnb Markets in São Paulo
Every São Paulo city with an AirROI Airbnb market report, A–Z, with its active listing count.
A
- Águas da Prata 51 listings
- Águas de Lindóia 425 listings
- Águas de Santa Bárbara 132 listings
- Águas de São Pedro 119 listings
- Alumínio 33 listings
- Americana 216 listings
- Amparo 94 listings
- Analândia 27 listings
- Andradina 54 listings
- Aparecida 543 listings
- Apiaí 20 listings
- Araçariguama 55 listings
- Araçatuba 196 listings
- Araçoiaba da Serra 159 listings
- Arandu 35 listings
- Araraquara 167 listings
- Araras 24 listings
- Artur Nogueira 31 listings
- Arujá 49 listings
- Assis 64 listings
- Atibaia 682 listings
- Avaré 89 listings
B
- Bananal 38 listings
- Barretos 485 listings
- Barueri 697 listings
- Bauru 593 listings
- Bertioga 5,337 listings
- Biritiba Mirim 45 listings
- Bofete 32 listings
- Boituva 286 listings
- Bom Jesus dos Perdões 96 listings
- Botucatu 295 listings
- Bragança Paulista 270 listings
- Brotas 327 listings
- Buritama 20 listings
C
- Cabreúva 39 listings
- Caçapava 69 listings
- Cachoeira Paulista 400 listings
- Caconde 38 listings
- Caieiras 37 listings
- Cajamar 37 listings
- Cajuru 22 listings
- Campinas 1,865 listings
- Campo Limpo Paulista 62 listings
- Campos do Jordão 3,566 listings
- Cananéia 146 listings
- Capela do Alto 25 listings
- Caraguatatuba 3,631 listings
- Carapicuíba 71 listings
- Catanduva 48 listings
- Cesário Lange 57 listings
- Cotia 359 listings
- Cruzeiro 38 listings
- Cunha 451 listings
D
- Diadema 31 listings
E
- Eldorado 24 listings
- Embu das Artes 49 listings
- Embu-Guaçu 50 listings
- Espírito Santo do Pinhal 132 listings
F
- Franca 279 listings
- Franco da Rocha 34 listings
G
- Guararema 219 listings
- Guaratinguetá 158 listings
- Guarujá 8,523 listings
- Guarulhos 982 listings
H
- Holambra 160 listings
- Hortolândia 70 listings
I
- Ibiúna 700 listings
- Igaratá 221 listings
- Iguape 96 listings
- Ilha Comprida 450 listings
- Ilhabela 3,111 listings
- Indaiatuba 295 listings
- Iperó 28 listings
- Iporanga 49 listings
- Itaí 104 listings
- Itanhaem 2,184 listings
- Itapecerica da Serra 63 listings
- Itapetininga 88 listings
- Itapeva 31 listings
- Itapevi 37 listings
- Itapira 36 listings
- Itaquaquecetuba 21 listings
- Itariri 31 listings
- Itatiba 207 listings
- Itirapina 39 listings
- Itu 357 listings
- Itupeva 173 listings
J
- Jaboticabal 38 listings
- Jacareí 157 listings
- Jaguariúna 92 listings
- Jambeiro 22 listings
- Jandira 21 listings
- Jardinópolis 20 listings
- Jarinu 176 listings
- Jaú 59 listings
- Joanópolis 257 listings
- Jundiaí 323 listings
- Juquitiba 167 listings
L
M
- Mairinque 453 listings
- Mairiporã 590 listings
- Marília 180 listings
- Mauá 24 listings
- Miracatu 18 listings
- Mococa 33 listings
- Mogi das Cruzes 287 listings
- Mogi Guaçu 47 listings
- Mogi Mirim 31 listings
- Mongaguá 1,181 listings
- Monte Alegre do Sul 83 listings
- Monte Mor 28 listings
- Monteiro Lobato 78 listings
- Morungaba 39 listings
N
- Natividade da Serra 35 listings
- Nazaré Paulista 192 listings
- Nova Odessa 26 listings
P
- Paraibuna 64 listings
- Paranapanema 214 listings
- Pardinho 170 listings
- Paulínia 41 listings
- Pederneiras 19 listings
- Pedra Bela 31 listings
- Pedro de Toledo 24 listings
- Penápolis 26 listings
- Peruíbe 1,377 listings
- Piedade 99 listings
- Pindamonhangaba 161 listings
- Pinhalzinho 84 listings
- Piracaia 260 listings
- Piracicaba 386 listings
- Piraju 23 listings
- Pirassununga 107 listings
- Porangaba 79 listings
- Porto Feliz 85 listings
- Potim 29 listings
- Praia Grande 8,314 listings
- Presidente Epitácio 79 listings
- Presidente Prudente 274 listings
R
- Região Imediata de Taubaté-Pindamonhangaba 84 listings
- Ribeirão Pires 32 listings
- Ribeirão Preto 1,689 listings
- Rifaina 62 listings
- Rio Claro 64 listings
- Rosana 26 listings
- Roseira 21 listings
S
- Salesópolis 32 listings
- Salto 84 listings
- Salto de Pirapora 49 listings
- Santa Bárbara d'Oeste 45 listings
- Santa Branca 69 listings
- Santa Clara d'Oeste 28 listings
- Santa Fé do Sul 25 listings
- Santa Isabel 182 listings
- Santa Rita do Passa Quatro 29 listings
- Santana de Parnaíba 84 listings
- Santo André 167 listings
- Santo Antônio de Posse 18 listings
- Santo Antônio do Pinhal 593 listings
- Santos 2,631 listings
- São Bento do Sapucaí 535 listings
- São Bernardo do Campo 241 listings
- São Caetano do Sul 118 listings
- São Carlos 424 listings
- São João da Boa Vista 72 listings
- Sao Jose do Barreiro 47 listings
- São José do Rio Preto 606 listings
- São José dos Campos 981 listings
- São Lourenço da Serra 53 listings
- São Luís do Paraitinga 30 listings
- São Luiz do Paraitinga 78 listings
- São Miguel Arcanjo 22 listings
- São Paulo 35,728 listings
- São Pedro 498 listings
- São Roque 576 listings
- São Sebastião 6,938 listings
- São Vicente 1,198 listings
- Sarapuí 43 listings
- Serra Negra 636 listings
- Socorro 880 listings
- Sorocaba 781 listings
- Sumaré 70 listings
- Suzano 129 listings
T
U
- Ubatuba 12,813 listings
V
- Valinhos 69 listings
- Vargem 59 listings
- Vargem Grande Paulista 48 listings
- Vinhedo 64 listings
- Votorantim 67 listings