AirROI ranking · 202633 markets ranked
Best Places to Buy an Airbnb in Baden-Württemberg, Germany (2026)
Freiburg im Breisgau is the best place to buy an Airbnb in Baden-Württemberg in 2026, according to AirROI's ranking of 33 markets. Its listings averaged €17,800 in revenue over the 12 months to October 2026 and were booked on 50% of nights. It leads on the blend rather than on any one measure, placing 3rd of 33 for occupancy, 4th of 33 for revenue per listing and 4th of 33 for market size. Heidelberg and Rust come next.
- Markets tracked
- 274
- Active Airbnb listings
- 16,500
- Avg. revenue per listing
- €13,000
- Occupancy rate
- 39%
- Avg. nightly rate
- €135
- Revenue change, typical market
- +5%
The short answer
Baden-Württemberg Airbnb Market at a Glance
Across Baden-Württemberg, the 16,500 active Airbnb listings tracked by AirROI, a short-term-rental data firm, averaged €13,000 over the same period. They were booked on 39% of nights at about €135 a night; the ranking covers the 33 markets with at least 100 active listings. Revenue per listing rose in 23 of the 33 ranked markets with a comparable year of data, by 5% in the typical one.
The ranking weighs revenue per listing most, then occupancy and market size, then how evenly income spreads across the year and how it changed on the year. It reflects rental performance, not purchase prices or local short-term rental rules. How the ranking works.
Where the top 10 Airbnb markets in Baden-Württemberg are
Each dot is one of the 274 markets AirROI tracks in Baden-Württemberg (2 outlying ones fall outside the map), sized by active listings and coloured by average revenue per listing. Select a number to jump to its profile.
Money figures on this page are in euros, converted from US dollars at €0.86 per US$, the typical rate from November 2025 to October 2026.
Top 10
The Top 10 Airbnb Markets in Baden-Württemberg
Each profile draws on the market's full AirROI report: how it earns, when in the year, who books and what sells. Monthly figures are averages per listing active in that month, so twelve of them add up to more than the annual average, which also counts listings that operated for only part of the year.
| # | Market | Avg. revenue | Occupancy |
|---|---|---|---|
 Freiburg im Breisgau High occupancy · High earnings | €17,800 | 50% | |
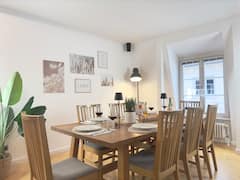 Heidelberg Large market · High occupancy | €15,900 | 44% | |
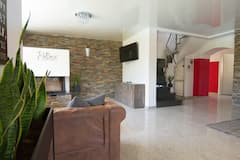 Rust High earnings · High occupancy | €31,500 | 52% | |
| 4 | 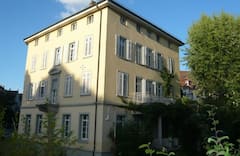 Constance High earnings · High occupancy | €18,800 | 47% |
| 5 | 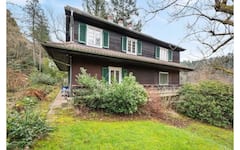 Baden-Baden Growing revenue · High earnings | €16,600 | 41% |
| 6 | 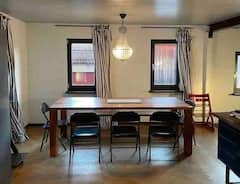 Tübingen High occupancy · Year-round demand | €14,100 | 50% |
| 7 | 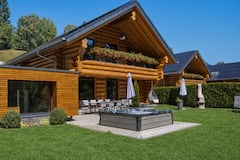 Feldberg High earnings · Growing revenue | €19,300 | 35% |
| 8 |  Friedrichshafen Large market · High earnings | €16,300 | 39% |
| 9 | 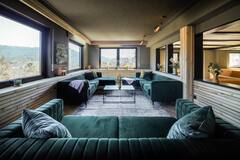 Baiersbronn Growing revenue · High earnings | €15,300 | 41% |
| 10 | 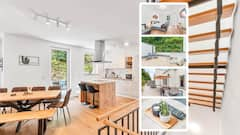 Offenburg Growing revenue · High occupancy | €15,300 | 43% |
1. Freiburg im Breisgau
Known for: High occupancy · High earnings
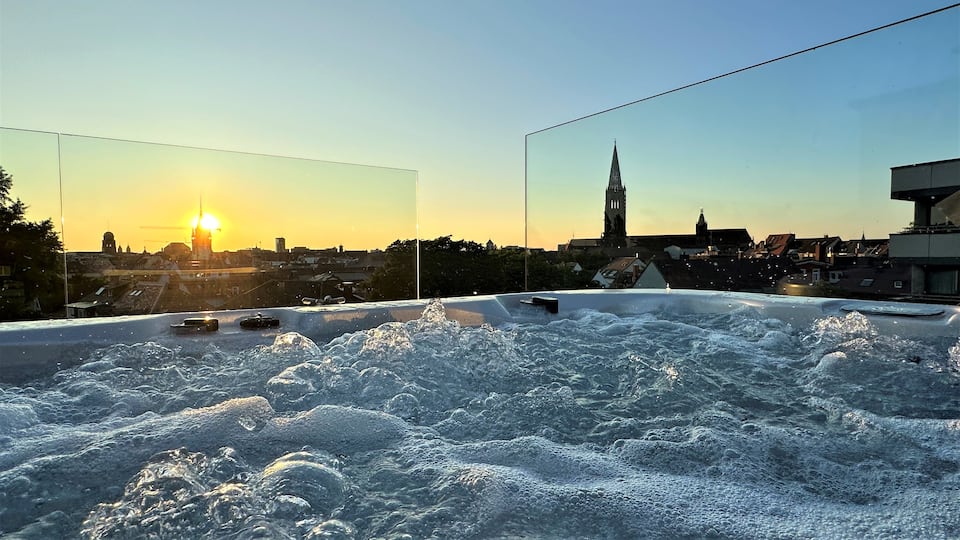


Top-earning Airbnb listings in Freiburg im Breisgau - Avg. revenue
- €17,800 +9% vs. last year
- Occupancy
- 50%
- Nightly rate
- €125
- Active listings
- 484
Where it places among the 33 ranked markets in Baden-Württemberg
- Revenue 4th of 33
- Occupancy 3rd of 33
- Market size 4th of 33
- Year-round 14th of 33
- Growth 11th of 33
- How it earns
- Freiburg im Breisgau fills more nights than most of Baden-Württemberg: 50% of them, the third-highest occupancy of the 33 ranked markets, at about €125 a night. That adds up to €17,800 per listing over the year, the fourth-highest of the 33 ranked markets. A typical listing takes in about €1,650 a month; the top quarter clear €2,610 or more. Revenue per listing rose 9% over the year, helped by nightly rates 23% higher, even as the number of listings grew 19%.
- When it earns
- Freiburg im Breisgau's season runs from May to September, peaking in July at about €2,550 per listing; February, the quietest month, brings in about €1,220.
- What sells
- The most common entire home has 1 bedroom (63% of entire homes), and apartments and condos make up 82% of supply.
Revenue per listing by month
€2,550 €1,220- Median listing
- €1,650/mo
- Top 25% of listings
- €2,610+/mo
- Booked ahead
- 61 days
- Average stay
- 6 nights
- Most common home size
- 1 bedroom
- Superhosts
- 45%
Areas in the full report: Old Town (Altstadt) · Vauban · Wiehre
Full Freiburg im Breisgau Airbnb report2. Heidelberg
Known for: Large market · High occupancy
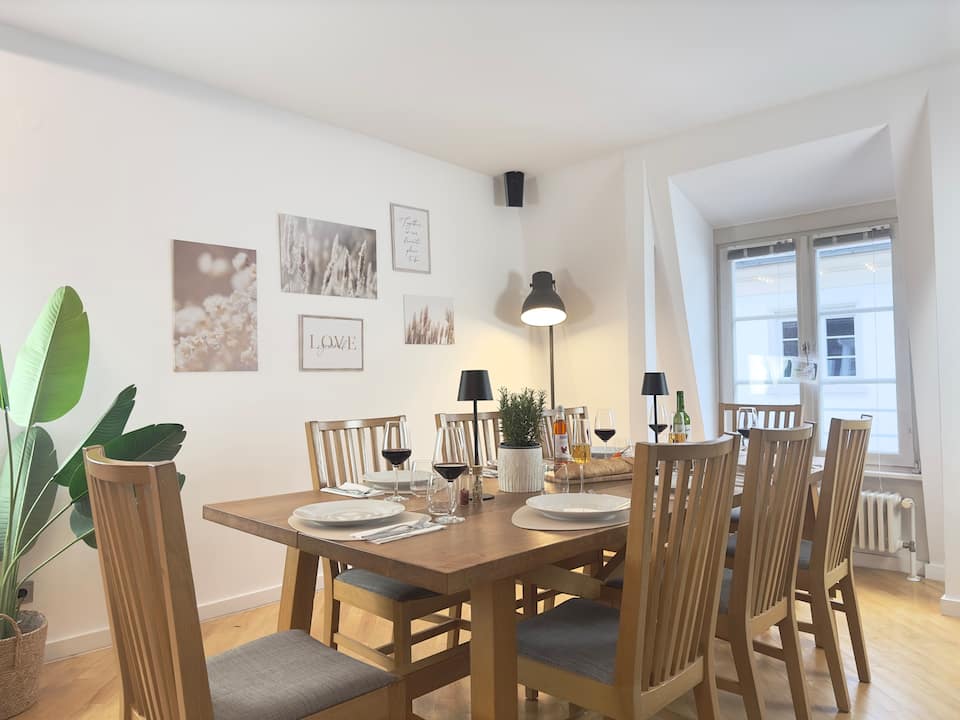


Top-earning Airbnb listings in Heidelberg - Avg. revenue
- €15,900 +12% vs. last year
- Occupancy
- 44%
- Nightly rate
- €130
- Active listings
- 420
Where it places among the 33 ranked markets in Baden-Württemberg
- Revenue 9th of 33
- Occupancy 5th of 33
- Market size 5th of 33
- Year-round 11th of 33
- Growth 7th of 33
- How it earns
- Listings in Heidelberg are booked on 44% of nights, the fifth-highest occupancy of the 33 ranked markets, at about €130 a night. Listings averaged €15,900 in revenue over the year, the ninth-highest of the 33 ranked markets. In a typical month the median listing brings in about €1,500, and the best quarter clear €2,580. Revenue per listing rose 12% over the year, helped by nightly rates 6% higher.
- When it earns
- Revenue in Heidelberg concentrates from May to October: July earns about €2,350 per listing, about twice as much as January.
- What sells
- One-bedroom homes lead the market (62% of entire homes), and apartments and condos make up 76% of supply.
- Who books
- Most guests come from abroad (54%), led by visitors from the United States, France and the Netherlands.
Revenue per listing by month
€2,350 €1,200- Median listing
- €1,500/mo
- Top 25% of listings
- €2,580+/mo
- Booked ahead
- 57 days
- Average stay
- 6 nights
- Guests from abroad
- 54%
- Most common home size
- 1 bedroom
Areas in the full report: Neckarstadt-West · Altstadt (Old Town) · Weststadt
Full Heidelberg Airbnb report3. Rust
Known for: High earnings · High occupancy
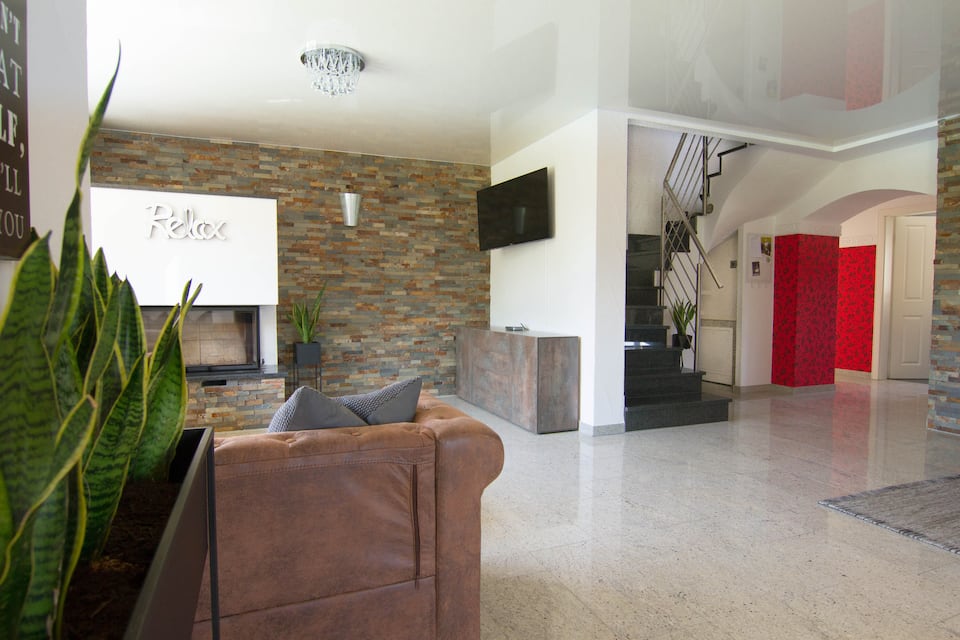
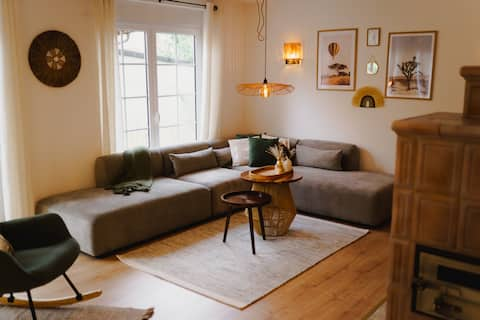
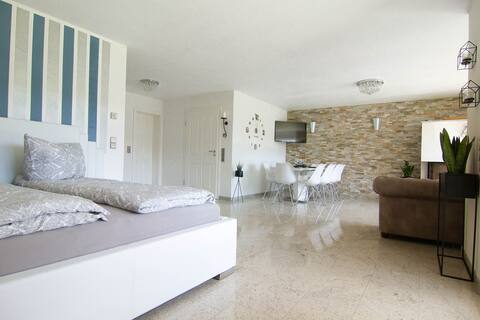
Top-earning Airbnb listings in Rust - Avg. revenue
- €31,500 +5% vs. last year
- Occupancy
- 52%
- Nightly rate
- €185
- Active listings
- 250
Where it places among the 33 ranked markets in Baden-Württemberg
- Revenue 1st of 33
- Occupancy 1st of 33
- Market size 9th of 33
- Year-round 31st of 33
- Growth 18th of 33
- How it earns
- Demand runs high in Rust: 52% of nights booked, the highest occupancy of the 33 ranked markets, at about €185 a night. Average revenue per listing came to €31,500, the highest of the 33 ranked markets. Month to month, the median listing earns about €2,710 and a top-quarter listing €3,840 or more. With 250 listings it is a small market, so its averages can move more from year to year.
- When it earns
- In Rust, the months from April to October earn above the yearly average, led by August at about €4,530 per listing; January is the low point at about €1,250. Stays are shorter than in most of Baden-Württemberg, about 2.6 nights, so listings turn over often; guests book about 62 days ahead. Most hosts take one- or two-night bookings (93% of listings), more than in the typical market.
- Who books
- Most guests come from abroad (80%), led by visitors from France, Switzerland and the Netherlands.
- What sells
- The most common entire home has 1 bedroom (50% of entire homes), and apartments and condos make up 78% of supply.
- Who it suits
- It suits buyers who can carry costs through a quiet January.
Revenue per listing by month
€4,530 €1,250- Median listing
- €2,710/mo
- Top 25% of listings
- €3,840+/mo
- Booked ahead
- 62 days
- Average stay
- 2.6 nights
- Guests from abroad
- 80%
- Most common home size
- 1 bedroom
4. Constance
Known for: High earnings · High occupancy
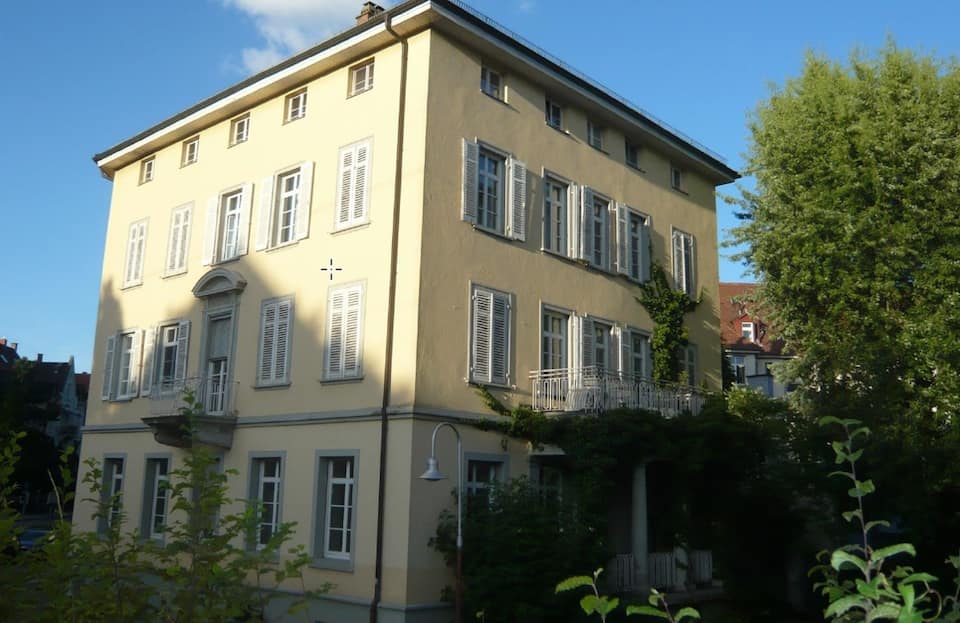


Top-earning Airbnb listings in Constance - Avg. revenue
- €18,800 +13% vs. last year
- Occupancy
- 47%
- Nightly rate
- €165
- Active listings
- 186
Where it places among the 33 ranked markets in Baden-Württemberg
- Revenue 3rd of 33
- Occupancy 4th of 33
- Market size 12th of 33
- Year-round 24th of 33
- Growth 6th of 33
- How it earns
- Constance books 47% of available nights, the fourth-highest occupancy of the 33 ranked markets, and charges about €165 a night. That adds up to €18,800 per listing over the year, the third-highest of the 33 ranked markets. A typical listing takes in about €1,770 a month; the top quarter clear €2,640 or more. Revenue per listing rose 13% over the year, helped by nightly rates 24% higher. Its 186 listings make it one of the smaller ranked markets, so its figures are less settled than those of larger ones.
- When it earns
- Constance's season runs from April to September, peaking in August at about €3,050 per listing; January, the quietest month, brings in about €1,060. Guests book early, about 67 days ahead against roughly 50 for the typical market in Baden-Württemberg, and stay about 6 nights.
- What sells
- One-bedroom homes lead the market (63% of entire homes), and apartments and condos make up 86% of supply.
- Who it suits
- Best for buyers who can ride out a slow January.
Revenue per listing by month
€3,050 €1,060- Median listing
- €1,770/mo
- Top 25% of listings
- €2,640+/mo
- Booked ahead
- 67 days
- Average stay
- 6 nights
- Most common home size
- 1 bedroom
- Superhosts
- 56%
5. Baden-Baden
Known for: Growing revenue · High earnings
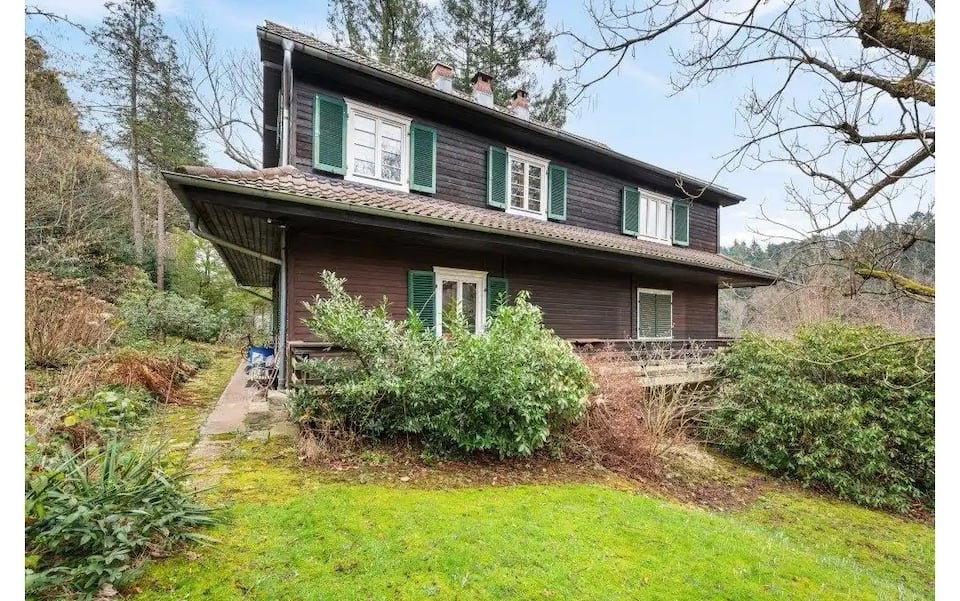


Top-earning Airbnb listings in Baden-Baden - Avg. revenue
- €16,600 +14% vs. last year
- Occupancy
- 41%
- Nightly rate
- €145
- Active listings
- 285
Where it places among the 33 ranked markets in Baden-Württemberg
- Revenue 7th of 33
- Occupancy 13th of 33
- Market size 7th of 33
- Year-round 14th of 33
- Growth 5th of 33
- How it earns
- Baden-Baden books 41% of nights at about €145 a night, close to the typical market in Baden-Württemberg. Listings averaged €16,600 in revenue over the year, the seventh-highest of the 33 ranked markets. In a typical month the median listing brings in about €1,570, and the best quarter clear €2,580. Revenue per listing rose 14% over the year, helped by nightly rates 18% higher. With 285 listings it is a small market, so its averages can move more from year to year.
- When it earns
- Revenue in Baden-Baden concentrates from April to October: August earns about €2,320 per listing, about twice as much as January. Bookings arrive well in advance, about 65 days before check-in, so much of a season's calendar fills early; stays average 5 nights.
- Who books
- Most guests come from abroad (67%), led by visitors from France, the United Kingdom and the United States.
- What sells
- The most common entire home has 1 bedroom (58% of entire homes), and apartments and condos make up 84% of supply.
Revenue per listing by month
€2,320 €1,120- Median listing
- €1,570/mo
- Top 25% of listings
- €2,580+/mo
- Booked ahead
- 65 days
- Average stay
- 5 nights
- Guests from abroad
- 67%
- Most common home size
- 1 bedroom
6. Tübingen
Known for: High occupancy · Year-round demand
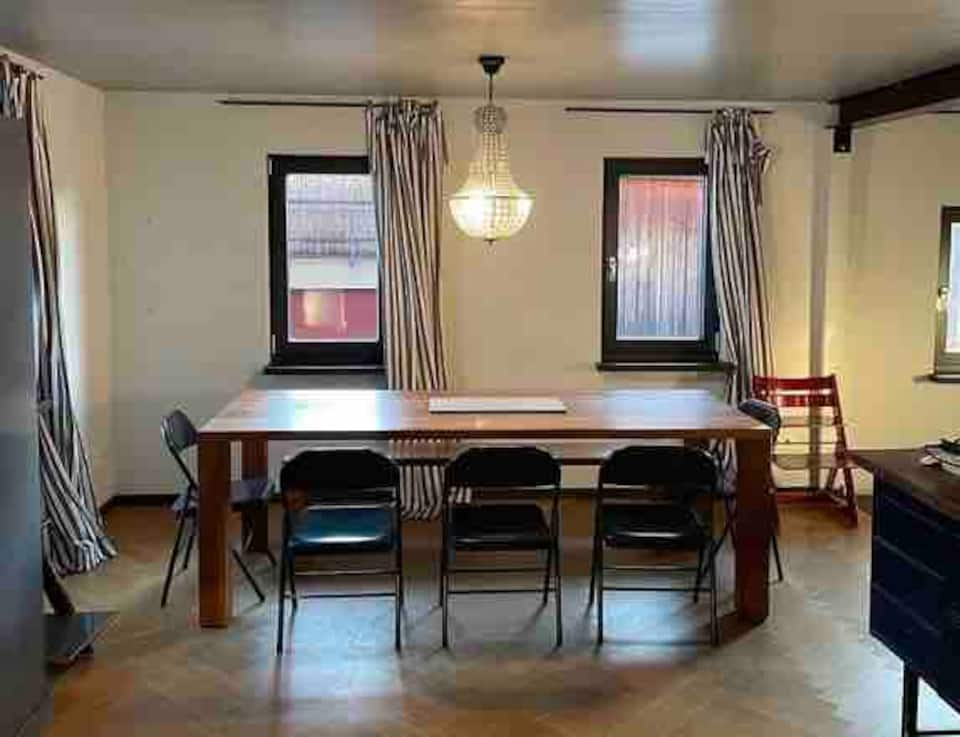
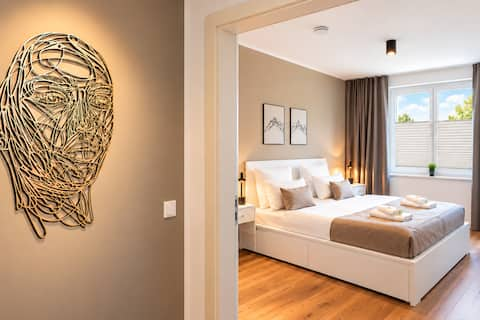

Top-earning Airbnb listings in Tübingen - Avg. revenue
- €14,100 +4% vs. last year
- Occupancy
- 50%
- Nightly rate
- €98
- Active listings
- 200
Where it places among the 33 ranked markets in Baden-Württemberg
- Revenue 15th of 33
- Occupancy 2nd of 33
- Market size 10th of 33
- Year-round 9th of 33
- Growth 19th of 33
- How it earns
- Tübingen earns on volume. Rates run below the Baden-Württemberg average at about €98 a night, but listings book 50% of nights. Average revenue per listing came to €14,100, 8% above the Baden-Württemberg average. Its place at #6 rests on occupancy (2nd of 33) and year-round demand (9th of 33) rather than on revenue per listing. Month to month, the median listing earns about €1,340 and a top-quarter listing €1,990 or more. Its 200 listings make it one of the smaller ranked markets, so its figures are less settled than those of larger ones.
- When it earns
- In Tübingen, the months from May to October earn above the yearly average, led by July at about €1,980 per listing; February is the low point at about €1,130. Trips run long, about 7 nights on average against 5 nights for the typical market in Baden-Württemberg, booked about 48 days ahead.
- What sells
- One-bedroom homes lead the market (74% of entire homes), and apartments and condos make up 80% of supply.
- Who it suits
- A good fit for buyers who would rather price for occupancy than for rate.
Revenue per listing by month
€1,980 €1,130- Median listing
- €1,340/mo
- Top 25% of listings
- €1,990+/mo
- Booked ahead
- 48 days
- Average stay
- 7 nights
- Most common home size
- 1 bedroom
- Superhosts
- 63%
7. Feldberg
Known for: High earnings · Growing revenue
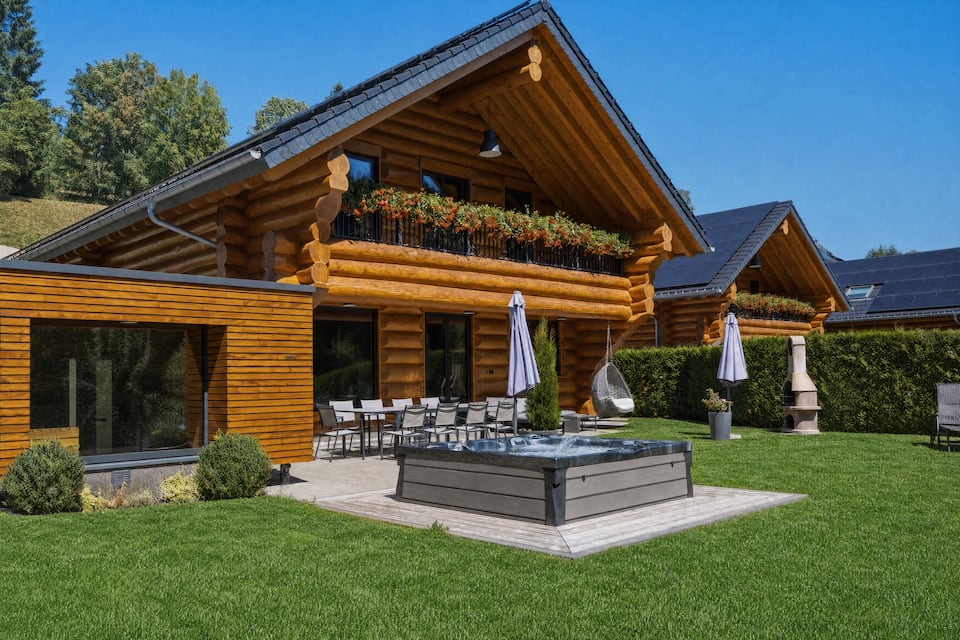
Top-earning Airbnb listings in Feldberg - Avg. revenue
- €19,300 +15% vs. last year
- Occupancy
- 35%
- Nightly rate
- €240
- Active listings
- 144
Where it places among the 33 ranked markets in Baden-Württemberg
- Revenue 2nd of 33
- Occupancy 27th of 33
- Market size 22nd of 33
- Year-round 10th of 33
- Growth 3rd of 33
- How it earns
- Feldberg earns on price: guests pay about €240 a night, 78% above the Baden-Württemberg average. That adds up to €19,300 per listing over the year, the second-highest of the 33 ranked markets. A typical listing takes in about €1,570 a month; the top quarter clear €2,890 or more. Revenue per listing rose 15% over the year, the third-biggest gain in Baden-Württemberg, helped by nightly rates 23% higher, even as the number of listings grew 35%. With 144 listings it is a small market, so its averages can move more from year to year.
- When it earns
- Feldberg's season covers July and August, peaking in August at about €3,130 per listing; November, the quietest month, brings in about €1,690. Guests book early, about 70 days ahead against roughly 50 for the typical market in Baden-Württemberg, and stay about 5 nights.
- Who books
- Most guests come from abroad (57%), led by visitors from France, Switzerland and the Netherlands.
- Who it suits
- It suits buyers who can furnish and price for a premium stay and plan to use a professional manager or run a polished operation.
Revenue per listing by month
€3,130 €1,690- Median listing
- €1,570/mo
- Top 25% of listings
- €2,890+/mo
- Booked ahead
- 70 days
- Average stay
- 5 nights
- Guests from abroad
- 57%
- Most common home size
- 1 bedroom
8. Friedrichshafen
Known for: Large market · High earnings
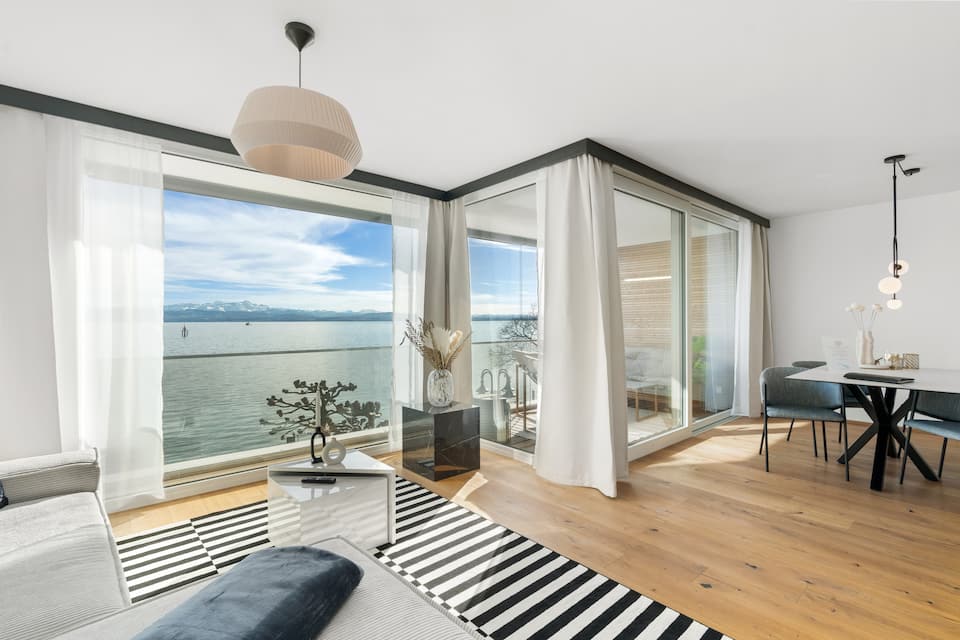

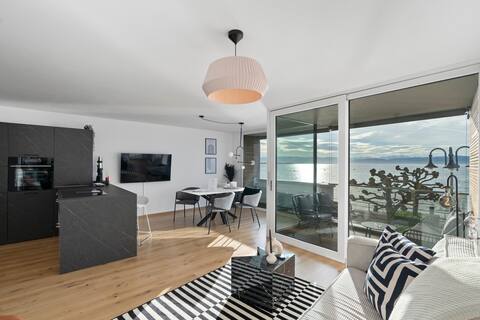
Top-earning Airbnb listings in Friedrichshafen - Avg. revenue
- €16,300 +5% vs. last year
- Occupancy
- 39%
- Nightly rate
- €160
- Active listings
- 502
Where it places among the 33 ranked markets in Baden-Württemberg
- Revenue 8th of 33
- Occupancy 20th of 33
- Market size 3rd of 33
- Year-round 28th of 33
- Growth 17th of 33
- How it earns
- Friedrichshafen is Baden-Württemberg's third-largest Airbnb market, with 502 active listings to price against. Average revenue per listing came to €16,300, the eighth-highest of the 33 ranked markets. In a typical month the median listing brings in about €1,580, and the best quarter clear €2,620. Revenue per listing rose 5% over the year.
- When it earns
- Revenue in Friedrichshafen concentrates from May to September: August earns about €3,280 per listing, about 3.2 times as much as February.
- What sells
- The most common entire home has 1 bedroom (48% of entire homes), and apartments and condos make up 89% of supply.
- Who it suits
- Best for buyers who are prepared for thin bookings around February.
Revenue per listing by month
€3,280 €1,020- Median listing
- €1,580/mo
- Top 25% of listings
- €2,620+/mo
- Booked ahead
- 59 days
- Average stay
- 5 nights
- Most common home size
- 1 bedroom
- Superhosts
- 38%
Areas in the full report: Lake Constance Promenade · City Center Friedrichshafen · Bodenseehafen
Full Friedrichshafen Airbnb report9. Baiersbronn
Known for: Growing revenue · High earnings
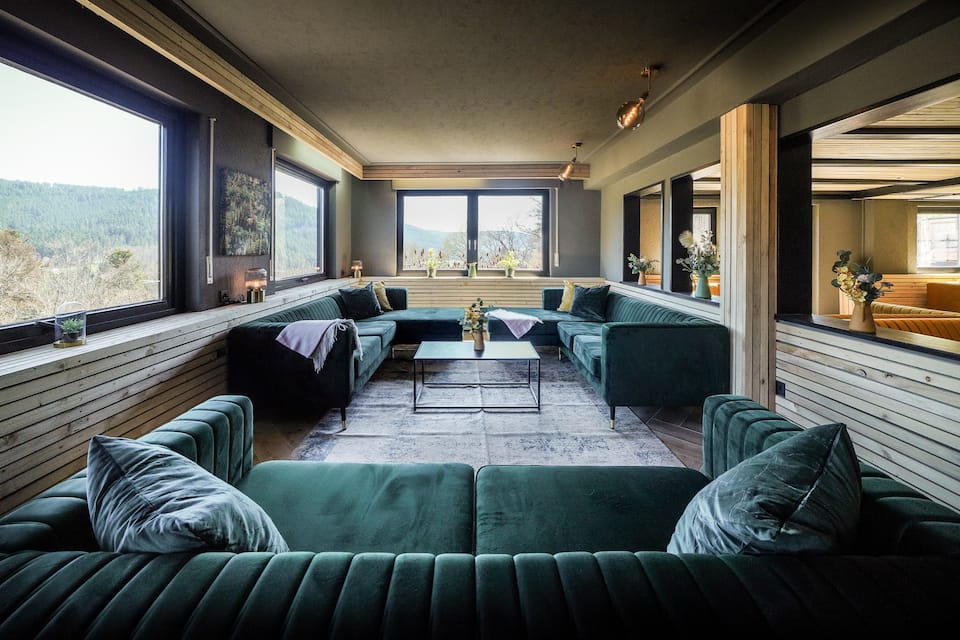
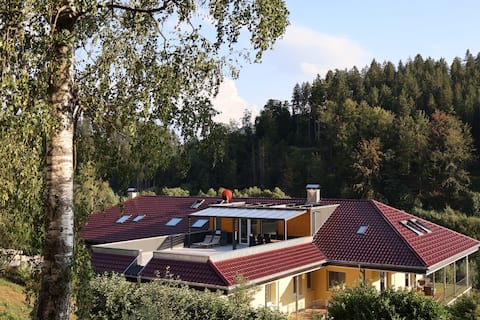

Top-earning Airbnb listings in Baiersbronn - Avg. revenue
- €15,300 +11% vs. last year
- Occupancy
- 41%
- Nightly rate
- €140
- Active listings
- 154
Where it places among the 33 ranked markets in Baden-Württemberg
- Revenue 11th of 33
- Occupancy 14th of 33
- Market size 19th of 33
- Year-round 14th of 33
- Growth 9th of 33
- How it earns
- Baiersbronn books 41% of nights at about €140 a night, close to the typical market in Baden-Württemberg. Average revenue per listing came to €15,300, 17% above the Baden-Württemberg average. Month to month, the median listing earns about €1,270 and a top-quarter listing €1,920 or more. Revenue per listing rose 11% over the year, helped by nightly rates 24% higher, even as the number of listings grew 40%. Its 154 listings make it one of the smaller ranked markets, so its figures are less settled than those of larger ones.
- When it earns
- In Baiersbronn, the months from May to October earn above the yearly average, led by August at about €2,500 per listing; January is the low point at about €1,190.
- What sells
- One-bedroom homes lead the market (60% of entire homes), and apartments and condos make up 82% of supply.
- Guest expectations
- Guests rate listings highly, 4.84 stars on average against 4.78 for the typical market in Baden-Württemberg, so reviews set a high bar.
Revenue per listing by month
€2,500 €1,190- Median listing
- €1,270/mo
- Top 25% of listings
- €1,920+/mo
- Booked ahead
- 61 days
- Average stay
- 5 nights
- Guests from abroad
- 53%
- Most common home size
- 1 bedroom
10. Offenburg
Known for: Growing revenue · High occupancy
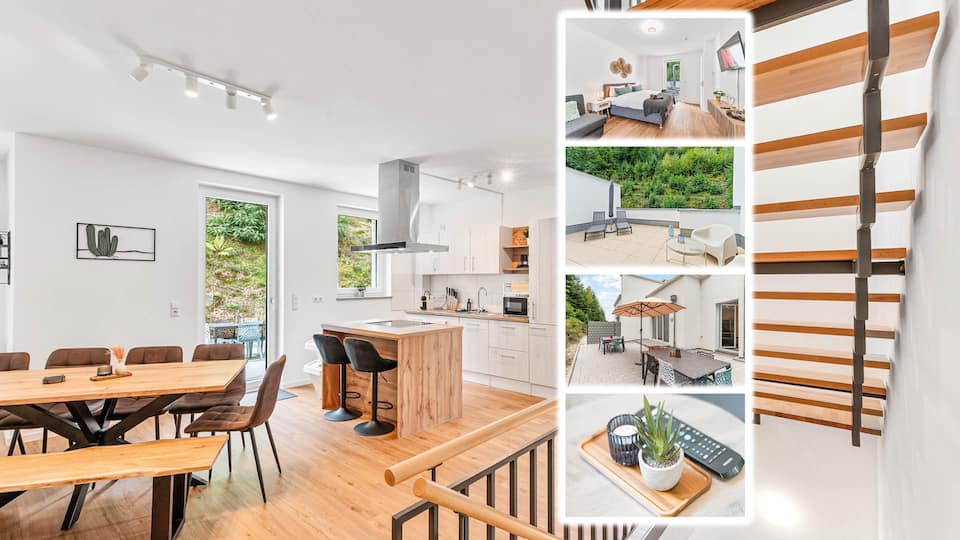
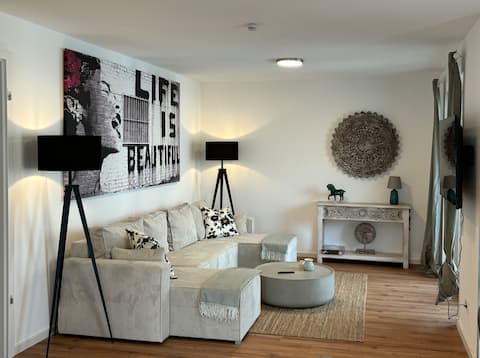
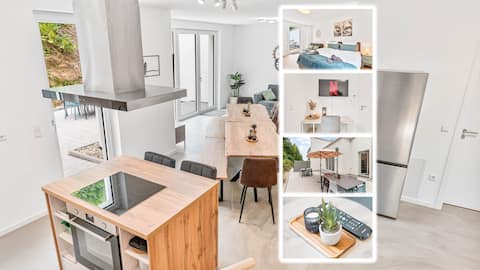
Top-earning Airbnb listings in Offenburg - Avg. revenue
- €15,300 +19% vs. last year
- Occupancy
- 43%
- Nightly rate
- €130
- Active listings
- 123
Where it places among the 33 ranked markets in Baden-Württemberg
- Revenue 12th of 33
- Occupancy 7th of 33
- Market size 26th of 33
- Year-round 20th of 33
- Growth 1st of 33
- How it earns
- Offenburg fills more nights than most of Baden-Württemberg: 43% of them, the seventh-highest occupancy of the 33 ranked markets, at about €130 a night. That adds up to €15,300 per listing over the year, 17% above the Baden-Württemberg average. A typical listing takes in about €1,440 a month; the top quarter clear €2,330 or more. Revenue per listing rose 19% over the year, the biggest gain in Baden-Württemberg, helped by nightly rates 43% higher, even as the number of listings grew 40%. With 123 listings it is a small market, so its averages can move more from year to year.
- When it earns
- Offenburg's season runs from May to September, peaking in August at about €2,290 per listing; January, the quietest month, brings in about €948. Most hosts take one- or two-night bookings (74% of listings), more than in the typical market.
- Who books
- Most guests come from abroad (60%), led by visitors from France, the Netherlands and Spain.
- Guest expectations
- Guests rate listings highly, 4.85 stars on average against 4.78 for the typical market in Baden-Württemberg, so reviews set a high bar.
Revenue per listing by month
€2,290 €948- Median listing
- €1,440/mo
- Top 25% of listings
- €2,330+/mo
- Booked ahead
- 40 days
- Average stay
- 5 nights
- Guests from abroad
- 60%
- Most common home size
- 1 bedroom
Full ranking
How All 33 Ranked Markets in Baden-Württemberg Compare
The overall ranking with the five measures behind it. "Slow month" is a market's weakest month of revenue as a share of its best, so a higher figure means steadier income. Select a column heading to re-sort.
| Freiburg im Breisgau High occupancy, high earnings | €17,842 | 50% | €127 | 48% | +9% | 484 | |
| Heidelberg Large market, high occupancy | €15,913 | 44% | €131 | 51% | +12% | 420 | |
| Rust High earnings, high occupancy | €31,528 | 52% | €187 | 28% | +5% | 250 | |
| 4 | Constance High earnings, high occupancy | €18,850 | 47% | €164 | 35% | +13% | 186 |
| 5 | Baden-Baden Growing revenue, high earnings | €16,639 | 41% | €147 | 48% | +14% | 285 |
| 6 | Tübingen High occupancy, year-round demand | €14,110 | 50% | €98 | 57% | +4% | 200 |
| 7 | Feldberg High earnings, growing revenue | €19,315 | 35% | €238 | 54% | +15% | 144 |
| 8 | Friedrichshafen Large market, high earnings | €16,283 | 39% | €159 | 31% | +5% | 502 |
| 9 | Baiersbronn Growing revenue, high earnings | €15,307 | 41% | €141 | 48% | +11% | 154 |
| 10 | Offenburg Growing revenue, high occupancy | €15,273 | 43% | €130 | 41% | +19% | 123 |
| 11 | Schluchsee High earnings, growing revenue | €16,807 | 38% | €162 | 31% | +12% | 174 |
| 12 | Radolfzell am Bodensee High occupancy, high earnings | €15,466 | 42% | €161 | 38% | +7% | 133 |
| 13 | Ludwigsburg High occupancy, year-round demand | €12,468 | 43% | €110 | 60% | 0% | 160 |
| 14 | Überlingen Growing revenue, high earnings | €14,808 | 40% | €167 | 27% | +8% | 270 |
| 15 | Karlsruhe Large market, year-round demand | €10,303 | 42% | €94 | 63% | −1% | 583 |
| 16 | Todtnau High earnings, year-round demand | €17,554 | 34% | €217 | 50% | +1% | 162 |
| 17 | Stuttgart Large market, year-round demand | €10,602 | 39% | €109 | 66% | −2% | 921 |
| 18 | Ravensburg Growing revenue | €13,323 | 40% | €119 | 35% | +15% | 168 |
| 19 | Mannheim Year-round demand, large market | €9,127 | 38% | €89 | 73% | +5% | 347 |
| 20 | Ulm | €12,409 | 39% | €108 | 48% | −4% | 186 |
| 21 | Lörrach Year-round demand | €10,658 | 39% | €104 | 51% | +6% | 144 |
| 22 | Meersburg High occupancy, growing revenue | €14,595 | 42% | €172 | 21% | +10% | 102 |
| 23 | Villingen-Schwenningen High occupancy | €10,514 | 42% | €98 | 48% | −6% | 145 |
| 24 | Kehl High occupancy | €11,485 | 41% | €104 | 38% | −2% | 121 |
| 25 | Heilbronn Year-round demand | €6,528 | 36% | €90 | 72% | +3% | 163 |
| 26 | Titisee-Neustadt | €13,547 | 34% | €172 | 33% | −12% | 149 |
| 27 | Pforzheim Year-round demand | €6,784 | 33% | €90 | 72% | −6% | 191 |
| 28 | Triberg im Schwarzwald | €12,527 | 31% | €130 | 32% | +2% | 119 |
| 29 | Böblingen Year-round demand | €8,691 | 35% | €113 | 77% | −7% | 106 |
| 30 | Reutlingen Year-round demand | €8,153 | 36% | €97 | 58% | −9% | 138 |
| 31 | Freudenstadt | €10,340 | 35% | €124 | 43% | −1% | 110 |
| 32 | Schönwald im Schwarzwald | €11,271 | 30% | €156 | 38% | +6% | 102 |
| 33 | Singen (Hohentwiel) Growing revenue | €8,500 | 34% | €108 | 29% | +16% | 102 |
By measure
Baden-Württemberg Airbnb Markets Ranked by Revenue, Nightly Rate and Occupancy
The overall ranking balances five measures. These lists take one at a time, for buyers who care most about income, pricing power, bookings, a steady calendar, momentum or market size.
Highest-earning Airbnb markets in Baden-Württemberg
Average annual revenue per active listing over the past 12 months. Markets with at least 200 listings.
| # | Market | Revenue |
|---|---|---|
| Rust #3 overall | €31,500 | |
| Freiburg im Breisgau #1 overall | €17,800 | |
| Baden-Baden #5 overall | €16,600 | |
| 4 | Friedrichshafen #8 overall | €16,300 |
| 5 | Heidelberg #2 overall | €15,900 |
| 6 | Überlingen #14 overall | €14,800 |
| 7 | Tübingen #6 overall | €14,100 |
| 8 | Stuttgart #17 overall | €10,600 |
| 9 | Karlsruhe #15 overall | €10,300 |
| 10 | Mannheim #19 overall | €9,130 |
Most expensive Airbnb markets in Baden-Württemberg by nightly rate
Average rate per booked night. A high rate earns most where occupancy holds up too. Markets with at least 200 listings.
| # | Market | Nightly |
|---|---|---|
| Rust #3 overall | €185 | |
| Überlingen #14 overall | €165 | |
| Friedrichshafen #8 overall | €160 | |
| 4 | Baden-Baden #5 overall | €145 |
| 5 | Heidelberg #2 overall | €130 |
| 6 | Freiburg im Breisgau #1 overall | €125 |
| 7 | Stuttgart #17 overall | €110 |
| 8 | Tübingen #6 overall | €98 |
| 9 | Karlsruhe #15 overall | €94 |
| 10 | Mannheim #19 overall | €89 |
Highest-occupancy Airbnb markets in Baden-Württemberg
Share of available nights booked over the past 12 months. Markets with at least 200 listings.
| # | Market | Occupancy |
|---|---|---|
| Rust #3 overall | 52% | |
| Tübingen #6 overall | 50% | |
| Freiburg im Breisgau #1 overall | 50% | |
| 4 | Heidelberg #2 overall | 44% |
| 5 | Karlsruhe #15 overall | 42% |
| 6 | Baden-Baden #5 overall | 41% |
| 7 | Überlingen #14 overall | 40% |
| 8 | Stuttgart #17 overall | 39% |
| 9 | Friedrichshafen #8 overall | 39% |
| 10 | Mannheim #19 overall | 38% |
Most year-round Airbnb markets in Baden-Württemberg
Revenue in the slowest month as a share of the best month, so a higher figure means steadier income. Markets with at least 200 listings.
| # | Market | Slow month |
|---|---|---|
| Mannheim #19 overall | 73% | |
| Stuttgart #17 overall | 66% | |
| Karlsruhe #15 overall | 63% | |
| 4 | Tübingen #6 overall | 57% |
| 5 | Heidelberg #2 overall | 51% |
| 6 | Freiburg im Breisgau #1 overall | 48% |
| 7 | Baden-Baden #5 overall | 48% |
| 8 | Friedrichshafen #8 overall | 31% |
| 9 | Rust #3 overall | 28% |
| 10 | Überlingen #14 overall | 27% |
Fastest-growing Airbnb markets in Baden-Württemberg
Change in revenue per listing from the year before, among markets where it rose. Markets with at least 200 listings.
| # | Market | Change |
|---|---|---|
| Baden-Baden #5 overall | +14% | |
| Heidelberg #2 overall | +12% | |
| Freiburg im Breisgau #1 overall | +9% | |
| 4 | Überlingen #14 overall | +8% |
| 5 | Mannheim #19 overall | +5% |
| 6 | Friedrichshafen #8 overall | +5% |
| 7 | Rust #3 overall | +5% |
| 8 | Tübingen #6 overall | +4% |
Largest Airbnb markets in Baden-Württemberg
Active listings. Bigger markets have more comparable rentals to price against and more buyers at resale.
| # | Market | Listings |
|---|---|---|
| Stuttgart #17 overall | 921 | |
| Karlsruhe #15 overall | 583 | |
| Friedrichshafen #8 overall | 502 | |
| 4 | Freiburg im Breisgau #1 overall | 484 |
| 5 | Heidelberg #2 overall | 420 |
| 6 | Mannheim #19 overall | 347 |
| 7 | Baden-Baden #5 overall | 285 |
| 8 | Überlingen #14 overall | 270 |
| 9 | Rust #3 overall | 250 |
| 10 | Tübingen #6 overall | 200 |
| 11 | Pforzheim #27 overall | 191 |
| 12 | Constance #4 overall | 186 |
| 13 | Ulm #20 overall | 186 |
| 14 | Schluchsee #11 overall | 174 |
| 15 | Ravensburg #18 overall | 168 |
| 16 | Heilbronn #25 overall | 163 |
| 17 | Todtnau #16 overall | 162 |
| 18 | Ludwigsburg #13 overall | 160 |
| 19 | Baiersbronn #9 overall | 154 |
| 20 | Titisee-Neustadt #26 overall | 149 |
| 21 | Villingen-Schwenningen #23 overall | 145 |
| 22 | Feldberg #7 overall | 144 |
| 23 | Lörrach #21 overall | 144 |
| 24 | Reutlingen #30 overall | 138 |
| 25 | Radolfzell am Bodensee #12 overall | 133 |
Seasonality
When Airbnbs in Baden-Württemberg Earn the Most
August is the best month for more than half of ranked markets in Baden-Württemberg. January is the most common slowest month, in 16 markets.
July earns about twice what January does
Average revenue per listing across the 33 ranked markets in Baden-Württemberg, by month
| Month | Avg. revenue per listing | Best month for | Highest-ranked examples |
|---|---|---|---|
| January | €1,080 | – | – |
| February | €1,130 | – | – |
| March | €1,330 | – | – |
| April | €1,560 | – | – |
| May | €1,740 | – | – |
| June | €1,830 | – | – |
| July | €2,220 | 10 markets | Freiburg im Breisgau, Heidelberg, Tübingen |
| August | €2,170 | 17 markets | Rust, Constance, Baden-Baden |
| September | €1,840 | 2 markets | Mannheim, Heilbronn |
| October | €1,670 | 2 markets | Ludwigsburg, Stuttgart |
| November | €1,200 | – | – |
| December | €1,480 | 2 markets | Kehl, Pforzheim |
Average revenue is per listing across the ranked markets, the line in the chart above. "Best month for" counts the ranked markets whose own revenue peaks in that month.
Method
How the Ranking Works
The ranking covers the 33 markets in Baden-Württemberg with at least 100 active Airbnb listings and data through October 2026. Each market is compared with the others on five measures, and markets are ordered by a weighted blend of where they place on each:
- Revenue per listing (35%): average revenue an active listing earned over the past 12 months.
- Occupancy (20%): share of available nights that were booked.
- Market size (20%): active listings. Bigger markets offer more comparable rentals to price against and more buyers when you sell.
- Year-round demand (15%): revenue in the slowest month as a share of the best month. The latest month is left out when its bookings look incomplete.
- Growth (10%): change in revenue per listing from the year before. Markets whose boundaries changed between years are scored in the middle.
Left out: 54 markets whose data predate the latest refresh and one town listed a second time under another spelling. The score measures how rentals perform. It does not include purchase prices, financing, operating costs or local short-term rental rules, which vary by address and should be checked before buying. Figures are in euros and match each market's own report; see the data methodology for how listings are tracked.
To check one property before buying, run its address and size through the Airbnb estimator for a revenue, occupancy and nightly-rate range from comparable listings.
FAQ
Frequently Asked Questions About Airbnb Investing in Baden-Württemberg
What is the best place to buy an Airbnb in Baden-Württemberg?
Freiburg im Breisgau ranks first of the 33 markets in Baden-Württemberg in AirROI's ranking, with €17,800 in average revenue per listing and 50% occupancy. Heidelberg and Rust follow. The ranking weighs revenue, occupancy, market size, seasonality and growth; it leaves out purchase prices.
What are the most profitable Airbnb locations in Baden-Württemberg?
By revenue per listing, among markets with at least 200 listings, Rust leads at €31,500 a year, ahead of Freiburg im Breisgau at €17,800. Profit also depends on what a property costs to buy and run, which varies far more between markets than revenue does.
How much does an Airbnb make in Baden-Württemberg?
The average active listing in Baden-Württemberg earned €13,000 over the 12 months to October 2026, at 39% occupancy. Across the ranked markets, the middle half averaged between €10,500 and €15,900 per listing. Averages include listings that operated for only part of the year, so a listing rented all year typically earns more.
What is a good Airbnb occupancy rate in Baden-Württemberg?
The average listing in Baden-Württemberg was booked on 39% of available nights over the past 12 months. Half of the ranked markets fall between 35% and 42%, so a market above about 42% sits in the top quarter. Occupancy is only half the picture: a market with lower occupancy can still earn more if its nightly rates are higher.
Where is Airbnb demand highest in Baden-Württemberg?
Among ranked markets with at least 200 listings, Rust has the highest occupancy, with 52% of available nights booked, followed by Tübingen at 50%. Its listings average about €185 a night and €31,500 a year.
Where are Airbnb nightly rates highest in Baden-Württemberg?
Among ranked markets with at least 200 listings, Rust has the highest average nightly rate, about €185, followed by Überlingen at €165. Mannheim is the least expensive, at about €89. The average booked night in Baden-Württemberg costs about €135.
What is the best month for Airbnb in Baden-Württemberg?
August is the highest-earning month for 17 of the 33 ranked markets, followed by July (10). January is the most common slowest month, in 16 of the 33 markets. Each market's report shows its own month-by-month revenue, occupancy and rates.
Which Airbnb markets in Baden-Württemberg earn the most evenly through the year?
Among ranked markets with at least 200 listings, Mannheim has the steadiest income: its slowest month, February, still earns about three-quarters of its best. Stuttgart follows, at 66%. Steadier markets are easier to budget for, though they do not always earn the most per listing.
Which Airbnb markets are growing fastest in Baden-Württemberg?
Among ranked markets with at least 200 listings, revenue per listing grew most in Baden-Baden, up 14% on the year before, and in Heidelberg, up 12%. A single strong year can reflect events or new supply, so it is worth checking a market's monthly trend before relying on it.
Is Airbnb still profitable in Baden-Württemberg in 2026?
Revenue per listing grew in 23 of the 33 ranked markets with a comparable year of data; in the typical market it rose 5%. Whether a given property profits depends on its purchase price, financing and running costs.
What are the best smaller Airbnb markets in Baden-Württemberg?
Among ranked markets with fewer than 150 active listings, Feldberg (#7 overall, €19,300 per listing), Offenburg (#10, €15,300) and Radolfzell am Bodensee (#12, €15,500) place highest. Smaller markets have fewer comparable rentals to price against, so their averages can move more from year to year.
How many Airbnb listings are there in Baden-Württemberg?
AirROI tracked 16,500 active Airbnb listings in Baden-Württemberg over the 12 months to October 2026, across 274 markets. The largest ranked market is Stuttgart, with 921 listings, followed by Karlsruhe with 583.
Directory
All 274 Airbnb Markets in Baden-Württemberg
Every Baden-Württemberg city with an AirROI Airbnb market report, A–Z, with its active listing count.
A
- Aalen 69 listings
- Achern 26 listings
- Albbruck 29 listings
- Albstadt 60 listings
- Allensbach 31 listings
- Alpirsbach 55 listings
- Altensteig 23 listings
- Ammerbuch 17 listings
- Argenbühl 33 listings
- Aulendorf 32 listings
B
- Backnang 29 listings
- Bad Bellingen 25 listings
- Bad Buchau 25 listings
- Bad Dürrheim 52 listings
- Bad Friedrichshall 20 listings
- Bad Herrenalb 50 listings
- Bad Krozingen 79 listings
- Bad Liebenzell 43 listings
- Bad Mergentheim 50 listings
- Bad Peterstal-Griesbach 52 listings
- Bad Rappenau 23 listings
- Bad Rippoldsau-Schapbach 25 listings
- Bad Säckingen 55 listings
- Bad Saulgau 28 listings
- Bad Schönborn 18 listings
- Bad Überkingen 18 listings
- Bad Urach 45 listings
- Bad Waldsee 40 listings
- Bad Wildbad 74 listings
- Bad Wimpfen 23 listings
- Bad Wurzach 31 listings
- Baden-Baden 285 listings
- Badenweiler 52 listings
- Baiersbronn 154 listings
- Balingen 64 listings
- Beilstein 19 listings
- Bermatingen 27 listings
- Bernau im Schwarzwald 45 listings
- Besigheim 28 listings
- Biberach an der Riß 74 listings
- Bietigheim-Bissingen 49 listings
- Blaubeuren 24 listings
- Blaustein 25 listings
- Böblingen 106 listings
- Bodman-Ludwigshafen 76 listings
- Bonndorf im Schwarzwald 18 listings
- Breisach am Rhein 18 listings
- Breitnau 25 listings
- Bruchsal 36 listings
- Bühl 68 listings
- Bühlertal 30 listings
- Burladingen 18 listings
C
- Calw 27 listings
- Constance 186 listings
- Crailsheim 25 listings
- Creglingen 26 listings
D
- Daisendorf 27 listings
- Deggenhausertal 27 listings
- Dettingen an der Erms 28 listings
- Donaueschingen 32 listings
- Dornstetten 29 listings
- Dossenheim 22 listings
- Durbach 23 listings
E
- Echterdingen 30 listings
- Edingen-Neckarhausen 25 listings
- Efringen-Kirchen 22 listings
- Eggenstein-Leopoldshafen 25 listings
- Eisenbach 24 listings
- Elzach 37 listings
- Emmendingen 30 listings
- Endingen 39 listings
- Enzklösterle 22 listings
- Eppelheim 18 listings
- Eppingen 18 listings
- Eriskirch 29 listings
- Esslingen am Neckar 89 listings
- Ettenheim 59 listings
- Ettlingen 31 listings
F
- Feldberg 144 listings
- Fellbach 41 listings
- Filderstadt 75 listings
- Forbach 41 listings
- Freiamt 26 listings
- Freiburg im Breisgau 484 listings
- Freudenstadt 110 listings
- Friedrichshafen 502 listings
- Friesenheim 33 listings
- Furtwangen im Schwarzwald 23 listings
G
- Gaggenau 36 listings
- Gaienhofen 54 listings
- Geislingen an der Steige 20 listings
- Gengenbach 79 listings
- Gernsbach 62 listings
- Göppingen 55 listings
- Görwihl 21 listings
- Gottmadingen 28 listings
- Grenzach 18 listings
- Gundelfingen 22 listings
H
- Hagnau am Bodensee 29 listings
- Hechingen 21 listings
- Heidelberg 420 listings
- Heidenheim an der Brenz 64 listings
- Heilbronn 163 listings
- Hemsbach 23 listings
- Herbolzheim 48 listings
- Herdwangen-Schönach 18 listings
- Herrenberg 32 listings
- Herrischried 23 listings
- Hilzingen 24 listings
- Hinterzarten 63 listings
- Höchenschwand 34 listings
- Hockenheim 25 listings
- Hohenfels 20 listings
- Hohentengen am Hochrhein 22 listings
- Horb am Neckar 43 listings
- Hornberg 33 listings
I
- Illmensee 21 listings
- Immenstaad am Bodensee 75 listings
- Isny im Allgäu 38 listings
J
- Jestetten 19 listings
K
- Kandern 40 listings
- Kappel-Grafenhausen 92 listings
- Karlsdorf-Neuthard 18 listings
- Karlsruhe 583 listings
- Kehl 121 listings
- Kenzingen 25 listings
- Kippenheim 32 listings
- Kirchberg an der Jagst 22 listings
- Kirchheim unter Teck 43 listings
- Kißlegg 24 listings
- Kleines Wiesental 29 listings
- Klettgau 22 listings
- Konstanz 88 listings
- Korntal-Münchingen 21 listings
- Kornwestheim 18 listings
- Kressbronn am Bodensee 57 listings
- Küssaberg 44 listings
L
- Lahr 23 listings
- Lahr/Schwarzwald 64 listings
- Langenargen 58 listings
- Laufenburg (Baden) 18 listings
- Leimen 33 listings
- Leinfelden 18 listings
- Leinfelden-Echterdingen 31 listings
- Lenzkirch 86 listings
- Leonberg 47 listings
- Leutkirch im Allgäu 71 listings
- Löffingen 83 listings
- Lörrach 144 listings
- Loßburg 23 listings
- Ludwigsburg 160 listings
M
- Mahlberg 33 listings
- Malsch 21 listings
- Mannheim 347 listings
- Markdorf 54 listings
- Meckenbeuren 60 listings
- Meersburg 102 listings
- Metzingen 41 listings
- Moos 18 listings
- Mosbach 23 listings
- Mühlacker 20 listings
- Müllheim im Markgräflerland 46 listings
- Münsingen 22 listings
- Münstertal 26 listings
N
- Nagold 29 listings
- Neckargemünd 36 listings
- Neckarsulm 33 listings
- Neukirch 25 listings
- Neuried 35 listings
- Nürtingen 35 listings
O
- Oberharmersbach 27 listings
- Oberkirch 54 listings
- Oberkochen 24 listings
- Oberried 29 listings
- Oberrotweil 19 listings
- Oberteuringen 45 listings
- Offenburg 123 listings
- Öhningen 77 listings
- Oppenau 22 listings
- Ostrach 22 listings
- Ottenhöfen im Schwarzwald 18 listings
- Owingen 30 listings
P
- Pforzheim 191 listings
- Pfullendorf 21 listings
R
- Radolfzell am Bodensee 133 listings
- Rastatt 46 listings
- Ravensburg 168 listings
- Reichenau 43 listings
- Renningen 20 listings
- Reutlingen 138 listings
- Rheinau 17 listings
- Rheinfelden (Baden) 56 listings
- Rheinhausen 62 listings
- Rheinstetten 31 listings
- Riedlingen 21 listings
- Rielasingen-Worblingen 17 listings
- Ringsheim 17 listings
- Rottenburg am Neckar 36 listings
- Rottweil 53 listings
- Rust 250 listings
S
- Sachsenheim 24 listings
- Salem 40 listings
- Sasbach 24 listings
- Sasbachwalden 99 listings
- Schallstadt 17 listings
- Schliengen 21 listings
- Schluchsee 174 listings
- Schonach im Schwarzwald 82 listings
- Schönwald im Schwarzwald 102 listings
- Schopfheim 45 listings
- Schorndorf 30 listings
- Schramberg 40 listings
- Schwäbisch Gmünd 50 listings
- Schwäbisch Hall 85 listings
- Schwanau 32 listings
- Schwetzingen 31 listings
- Seebach 26 listings
- Sigmaringen 28 listings
- Simonswald 30 listings
- Sindelfingen 63 listings
- Singen (Hohentwiel) 102 listings
- Sinsheim 77 listings
- Sipplingen 35 listings
- St. Blasien 68 listings
- St. Georgen im Schwarzwald 26 listings
- St. Märgen 24 listings
- Steinen 23 listings
- Steinenbronn 17 listings
- Stetten 26 listings
- Stockach 62 listings
- Stühlingen 25 listings
- Stuttgart 921 listings
T
- Talheim 18 listings
- Tauberbischofsheim 26 listings
- Tengen 22 listings
- Teningen 27 listings
- Tettnang 71 listings
- Titisee-Neustadt 149 listings
- Todtmoos 80 listings
- Todtnau 162 listings
- Triberg im Schwarzwald 119 listings
- Trossingen 21 listings
- Tübingen 200 listings
- Tuttlingen 33 listings
U
- Überlingen 270 listings
- Uhldingen-Mühlhofen 82 listings
- Ühlingen-Birkendorf 38 listings
- Ulm 186 listings
- Unterkirnach 18 listings
V
- Villingen-Schwenningen 145 listings
W
- Waiblingen 53 listings
- Waldbronn 17 listings
- Waldkirch 35 listings
- Waldshut-Tiengen 77 listings
- Walldorf 23 listings
- Wangen im Allgäu 95 listings
- Wehr 27 listings
- Weikersheim 31 listings
- Weil am Rhein 74 listings
- Weilheim 22 listings
- Weingarten 52 listings
- Weinheim 84 listings
- Weinsberg 27 listings
- Weisweil 23 listings
- Wendlingen am Neckar 18 listings
- Wertheim 53 listings
- Wiesloch 36 listings
- Wilhelmsdorf 16 listings
- Winnenden 29 listings
- Wolfach 30 listings
- Wolfegg 20 listings
- Wyhlen 20 listings
Z
- Zell am Harmersbach 18 listings
- Zell im Wiesental 21 listings