AirROI ranking · 2026153 markets ranked
Best Places to Buy an Airbnb in Auvergne-Rhône-Alpes, France (2026)
Chamonix-Mont-Blanc is the best place to buy an Airbnb in Auvergne-Rhône-Alpes in 2026, according to AirROI's ranking of 153 markets. Its listings averaged €35,400 in revenue over the 12 months to October 2026 and were booked on 44% of nights. It leads on the blend rather than on any one measure, placing in the top 5% of ranked markets for market size and revenue per listing and the top 10% for occupancy. Annecy and Les Houches come next.
- Markets tracked
- 821
- Active Airbnb listings
- 85,400
- Avg. revenue per listing
- €16,500
- Occupancy rate
- 40%
- Avg. nightly rate
- €180
- Revenue change, typical market
- +7%
The short answer
Auvergne-Rhône-Alpes Airbnb Market at a Glance
Across Auvergne-Rhône-Alpes, the 85,400 active Airbnb listings tracked by AirROI, a short-term-rental data firm, averaged €16,500 over the same period. They were booked on 40% of nights at about €180 a night; the ranking covers the 153 markets with at least 100 active listings. Revenue per listing rose in 132 of the 153 ranked markets with a comparable year of data, by 7% in the typical one.
The ranking weighs revenue per listing most, then occupancy and market size, then how evenly income spreads across the year and how it changed on the year. It reflects rental performance, not purchase prices or local short-term rental rules. How the ranking works.
Where the top 10 Airbnb markets in Auvergne-Rhône-Alpes are
Each dot is one of the 821 markets AirROI tracks in Auvergne-Rhône-Alpes (10 outlying ones fall outside the map), sized by active listings and coloured by average revenue per listing. Select a number to jump to its profile.
Money figures on this page are in euros, converted from US dollars at €0.86 per US$, the typical rate from November 2025 to October 2026.
Top 10
The Top 10 Airbnb Markets in Auvergne-Rhône-Alpes
Each profile draws on the market's full AirROI report: how it earns, when in the year, who books and what sells. Monthly figures are averages per listing active in that month, so twelve of them add up to more than the annual average, which also counts listings that operated for only part of the year.
| # | Market | Avg. revenue | Occupancy |
|---|---|---|---|
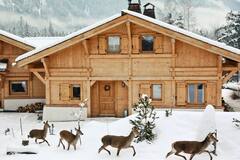 Chamonix-Mont-Blanc Large market · High earnings | €35,400 | 44% | |
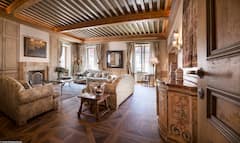 Annecy Large market · High occupancy | €22,400 | 49% | |
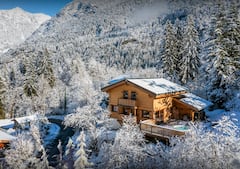 Les Houches High earnings · High occupancy | €30,500 | 43% | |
| 4 |  Thônes High occupancy · High earnings | €30,100 | 47% |
| 5 |  Sevrier High occupancy · High earnings | €28,400 | 47% |
| 6 | 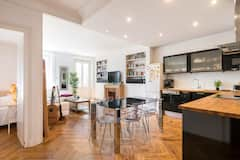 Lyon Large market · High occupancy | €15,900 | 46% |
| 7 |  Sallanches High occupancy · Growing revenue | €17,600 | 46% |
| 8 |  Tignes Large market · High earnings | €23,400 | 42% |
| 9 |  Val-d'Isère High earnings · High occupancy | €36,700 | 43% |
| 10 |  Morzine Large market · High earnings | €27,400 | 39% |
1. Chamonix-Mont-Blanc
Known for: Large market · High earnings
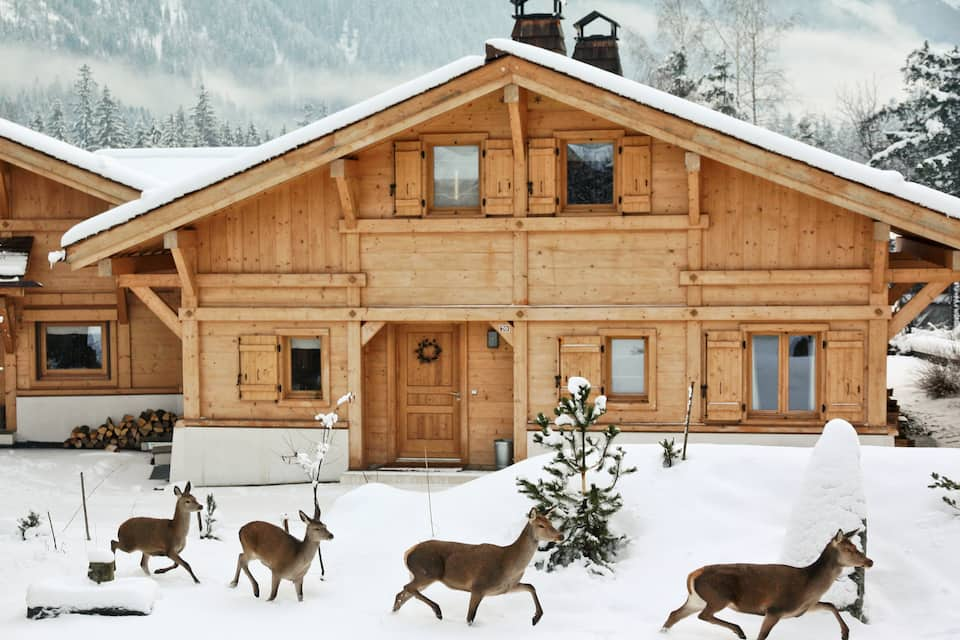
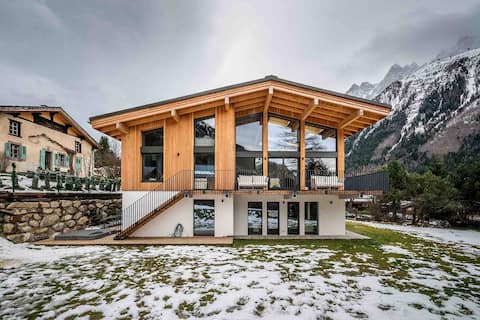
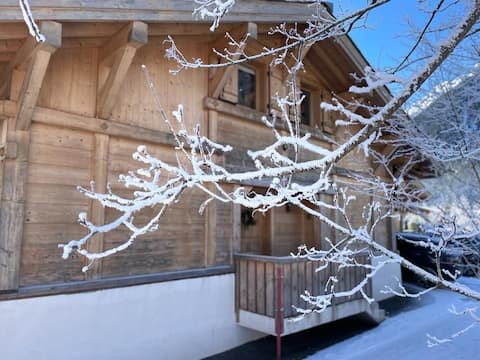
Top-earning Airbnb listings in Chamonix-Mont-Blanc - Avg. revenue
- €35,400 +14% vs. last year
- Occupancy
- 44%
- Nightly rate
- €325
- Active listings
- 2,180
Where it places among the 153 ranked markets in Auvergne-Rhône-Alpes
- Revenue Top 3%
- Occupancy Top 9%
- Market size Top 2%
- Year-round Bottom 49%
- Growth Top 17%
- How it earns
- Chamonix-Mont-Blanc commands premium rates, about €325 a night, and still books 44% of nights, 4 points above the Auvergne-Rhône-Alpes average. That adds up to €35,400 per listing over the year, the fourth-highest of the 153 ranked markets. A typical listing takes in about €2,730 a month; the top quarter clear €4,790 or more. Revenue per listing rose 14% over the year, helped by nightly rates 14% higher.
- When it earns
- Chamonix-Mont-Blanc has two seasons, December–March and July–August. February is the strongest month at about €6,460 per listing, and October the quietest at about €1,810. Guests book early, about 83 days ahead against roughly 58 for the typical market in Auvergne-Rhône-Alpes, and stay about 6 nights.
- Who books
- Most guests come from abroad (71%), led by visitors from the United States, the United Kingdom and Switzerland.
- Who it suits
- It suits buyers who can furnish and price for a premium stay and can carry costs through a quiet October.
- Registration
- 94% of listings display a registration number, so confirm the local rules before buying.
Revenue per listing by month
€6,460 €1,810- Median listing
- €2,730/mo
- Top 25% of listings
- €4,790+/mo
- Booked ahead
- 83 days
- Average stay
- 6 nights
- Guests from abroad
- 71%
- Most common home size
- 2 bedrooms
Areas in the full report: Chamonix-Mont-Blanc · Les Houches · Argentiere
Full Chamonix-Mont-Blanc Airbnb report2. Annecy
Known for: Large market · High occupancy
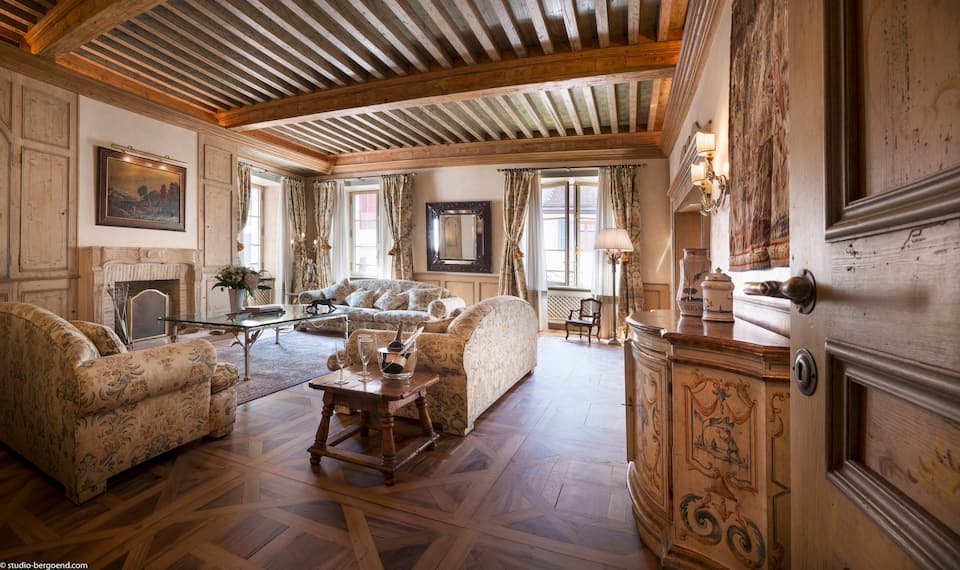
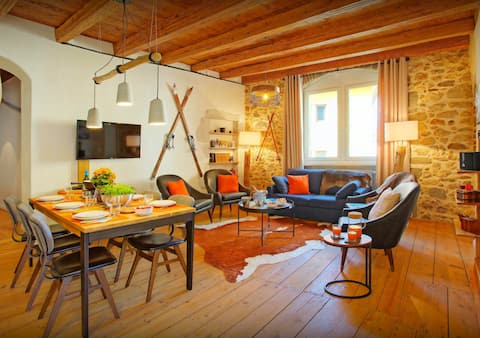

Top-earning Airbnb listings in Annecy - Avg. revenue
- €22,400 +11% vs. last year
- Occupancy
- 49%
- Nightly rate
- €170
- Active listings
- 3,140
Where it places among the 153 ranked markets in Auvergne-Rhône-Alpes
- Revenue Top 18%
- Occupancy Top 2%
- Market size Top 2%
- Year-round Top 44%
- Growth Top 26%
- How it earns
- Annecy fills more nights than most of Auvergne-Rhône-Alpes: 49% of them, the second-highest occupancy of the 153 ranked markets, at about €170 a night. Listings averaged €22,400 in revenue over the year, 36% above the Auvergne-Rhône-Alpes average. In a typical month the median listing brings in about €2,060, and the best quarter clear €3,180. Revenue per listing rose 11% over the year, helped by nightly rates 17% higher.
- When it earns
- Annecy's season runs from May to September, peaking in August at about €4,420 per listing; November, the quietest month, brings in about €1,360.
- Who books
- About four in ten guests (41%) travel from abroad, most often from the United Kingdom and the United States.
- What sells
- The most common entire home has 1 bedroom (47% of entire homes), and apartments and condos make up 91% of supply.
- Who it suits
- Best for buyers who can ride out a slow November.
- Registration
- Registration numbers appear on about nine in ten listings; check with the local authority before buying.
Revenue per listing by month
€4,420 €1,360- Median listing
- €2,060/mo
- Top 25% of listings
- €3,180+/mo
- Booked ahead
- 56 days
- Average stay
- 5 nights
- Guests from abroad
- 41%
- Most common home size
- 1 bedroom
Areas in the full report: Vieille Ville · Lake Annecy (Lac d'Annecy) · Le Pâquier
Full Annecy Airbnb report3. Les Houches
Known for: High earnings · High occupancy
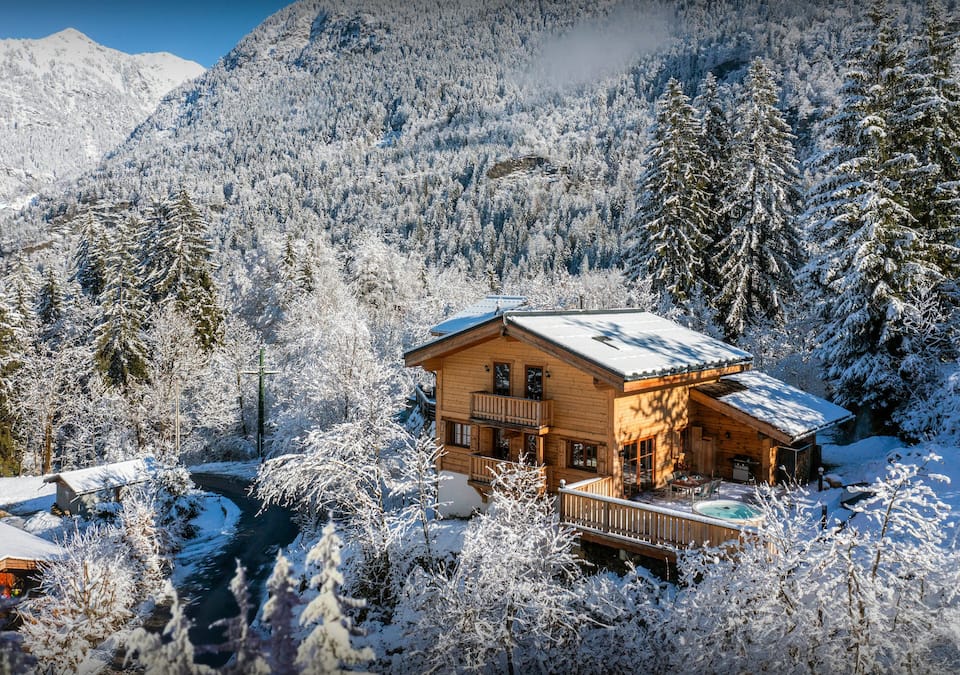

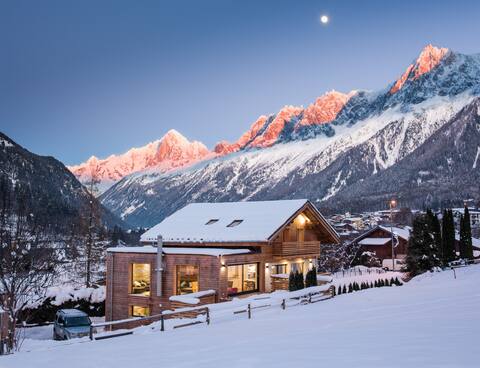
Top-earning Airbnb listings in Les Houches - Avg. revenue
- €30,500 +7% vs. last year
- Occupancy
- 43%
- Nightly rate
- €285
- Active listings
- 633
Where it places among the 153 ranked markets in Auvergne-Rhône-Alpes
- Revenue Top 6%
- Occupancy Top 14%
- Market size Top 19%
- Year-round Top 41%
- Growth Bottom 48%
- How it earns
- Les Houches earns on price and volume at once: guests pay about €285 a night, and listings are booked on 43% of nights, 3 points above the Auvergne-Rhône-Alpes average. Average revenue per listing came to €30,500, the eighth-highest of the 153 ranked markets. Month to month, the median listing earns about €2,300 and a top-quarter listing €4,210 or more. Revenue per listing rose 7% over the year, helped by nightly rates 9% higher.
- When it earns
- Revenue in Les Houches peaks twice, over December–March and again over July–August; February leads at about €5,790 per listing, while October brings in about €1,850.
- Who books
- Most guests come from abroad (54%), led by visitors from the United Kingdom, the United States and Switzerland.
- What sells
- Big homes are common: 42% of entire homes have three or more bedrooms, against about 26% in the typical market in Auvergne-Rhône-Alpes, and apartments and condos make up 61% of supply.
- Who it suits
- A good fit for buyers who can furnish and price for a premium stay and are prepared for thin bookings around October.
- Registration
- More than nine in ten listings show a permit or registration number, so check the local rules before buying.
Revenue per listing by month
€5,790 €1,850- Median listing
- €2,300/mo
- Top 25% of listings
- €4,210+/mo
- Booked ahead
- 71 days
- Average stay
- 6 nights
- Guests from abroad
- 54%
- Most common home size
- 2 bedrooms
Areas in the full report: Chalet des Granges · Les Houches Village · Prarion
Full Les Houches Airbnb report4. Thônes
Known for: High occupancy · High earnings
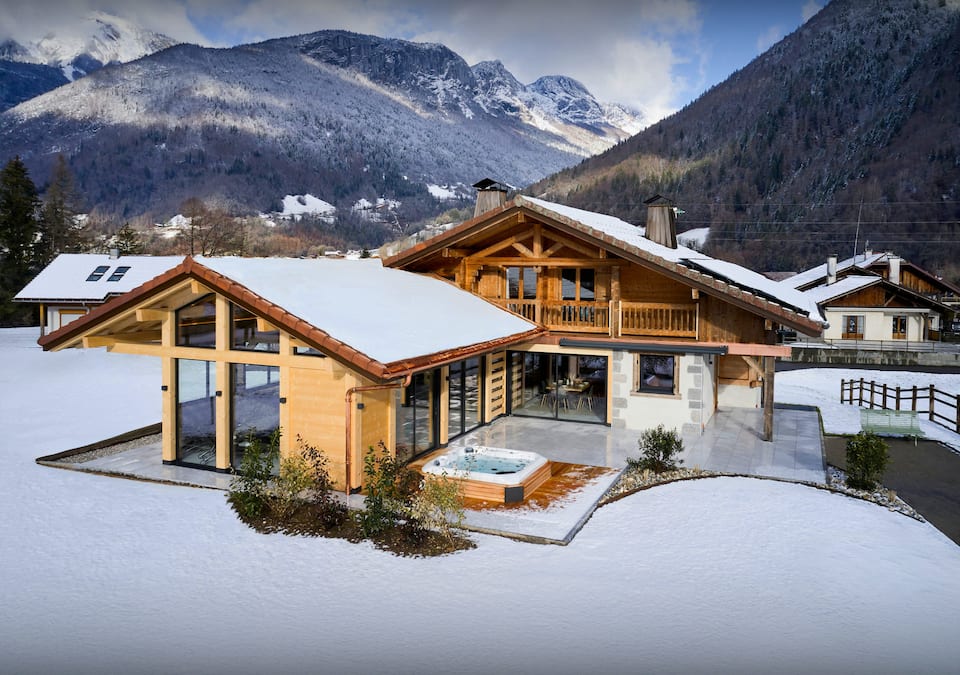
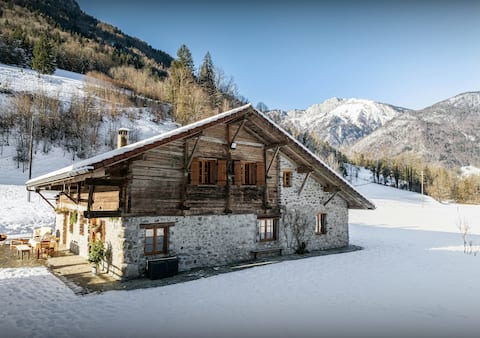
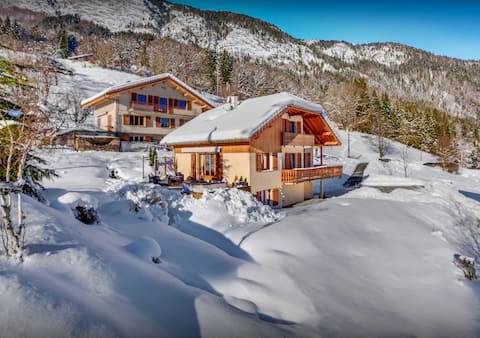
Top-earning Airbnb listings in Thônes - Avg. revenue
- €30,100 +23% vs. last year
- Occupancy
- 47%
- Nightly rate
- €190
- Active listings
- 140
Where it places among the 153 ranked markets in Auvergne-Rhône-Alpes
- Revenue Top 7%
- Occupancy Top 3%
- Market size Bottom 30%
- Year-round Top 25%
- Growth Top 7%
- How it earns
- Listings in Thônes are booked on 47% of nights, the fourth-highest occupancy of the 153 ranked markets, at about €190 a night. That adds up to €30,100 per listing over the year, the tenth-highest of the 153 ranked markets. A typical listing takes in about €1,530 a month; the top quarter clear €2,360 or more. Revenue per listing rose 23% over the year, helped by nightly rates 8% higher. With 140 listings it is a small market, so its averages can move more from year to year.
- When it earns
- Revenue in Thônes concentrates from June to August: August earns about €4,570 per listing, about 2.4 times as much as November.
- Guest expectations
- Guests rate listings highly, 4.87 stars on average against 4.79 for the typical market in Auvergne-Rhône-Alpes, so reviews set a high bar.
- What sells
- One-bedroom homes lead the market (44% of entire homes), and apartments and condos make up 64% of supply.
Revenue per listing by month
€4,570 €1,930- Median listing
- €1,530/mo
- Top 25% of listings
- €2,360+/mo
- Booked ahead
- 58 days
- Average stay
- 6 nights
- Most common home size
- 1 bedroom
- Superhosts
- 56%
5. Sevrier
Known for: High occupancy · High earnings
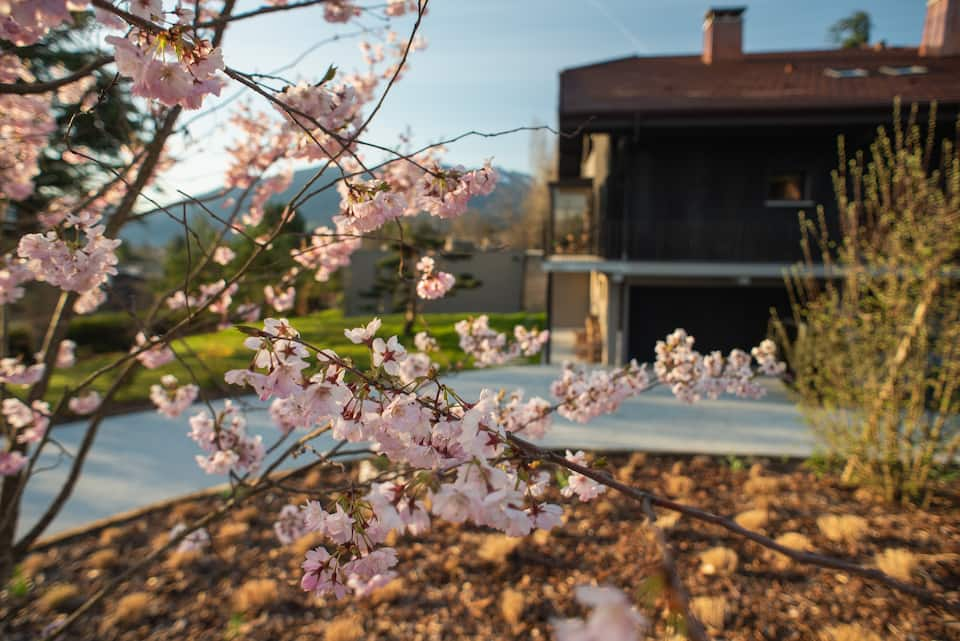
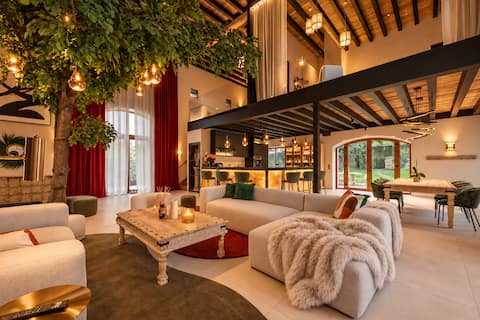

Top-earning Airbnb listings in Sevrier - Avg. revenue
- €28,400 +8% vs. last year
- Occupancy
- 47%
- Nightly rate
- €250
- Active listings
- 270
Where it places among the 153 ranked markets in Auvergne-Rhône-Alpes
- Revenue Top 8%
- Occupancy Top 2%
- Market size Top 36%
- Year-round Bottom 47%
- Growth Top 41%
- How it earns
- Rates in Sevrier run about €250 a night, 41% above the Auvergne-Rhône-Alpes average, yet listings still fill 47% of nights. Listings averaged €28,400 in revenue over the year, 73% above the Auvergne-Rhône-Alpes average. In a typical month the median listing brings in about €2,290, and the best quarter clear €3,950. Revenue per listing rose 8% over the year, helped by nightly rates 4% higher. Its 270 listings make it one of the smaller ranked markets, so its figures are less settled than those of larger ones.
- When it earns
- In Sevrier, the months from May to September earn above the yearly average, led by August at about €6,060 per listing; November is the low point at about €1,650.
- Who books
- More than a third of guests (36%) travel from abroad, most often from the United Kingdom and Germany.
- What sells
- The most common entire home has 1 bedroom (32% of entire homes), and apartments and condos make up 61% of supply.
- Who it suits
- It suits buyers who can carry costs through a quiet November and can furnish and price for a premium stay.
- Registration
- A registration number appears on about nine in ten listings; the local authority can say what a new listing needs.
Revenue per listing by month
€6,060 €1,650- Median listing
- €2,290/mo
- Top 25% of listings
- €3,950+/mo
- Booked ahead
- 69 days
- Average stay
- 6 nights
- Guests from abroad
- 36%
- Most common home size
- 1 bedroom
6. Lyon
Known for: Large market · High occupancy
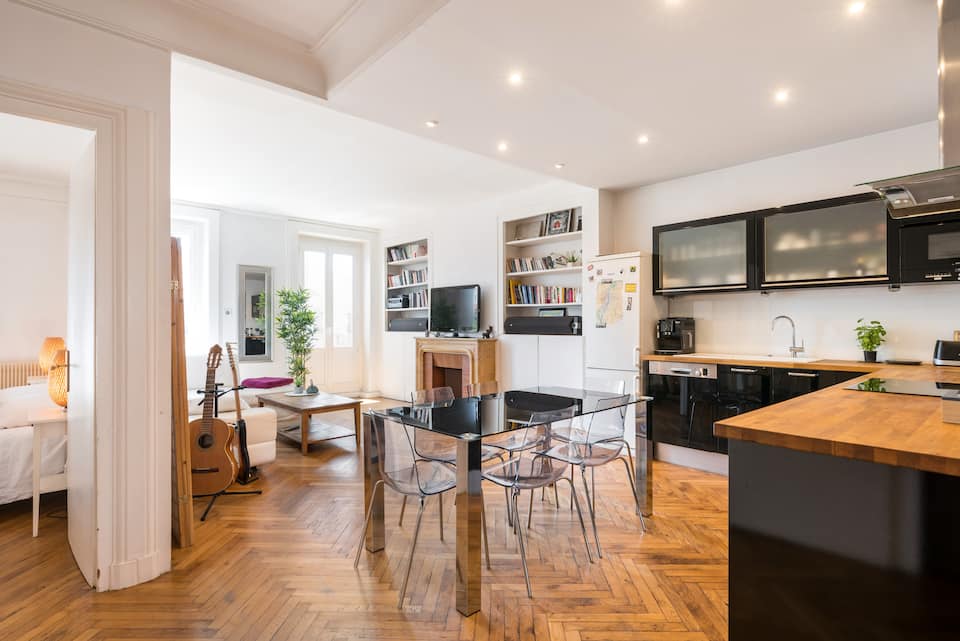
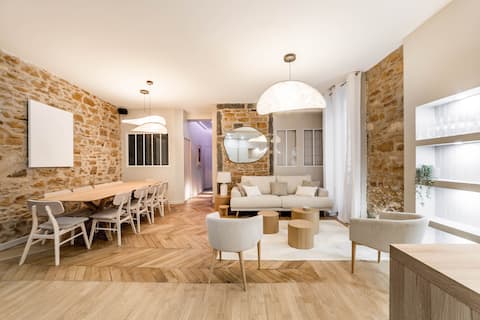

Top-earning Airbnb listings in Lyon - Avg. revenue
- €15,900 +3% vs. last year
- Occupancy
- 46%
- Nightly rate
- €125
- Active listings
- 4,470
Where it places among the 153 ranked markets in Auvergne-Rhône-Alpes
- Revenue Top 37%
- Occupancy Top 4%
- Market size Top 1%
- Year-round Top 8%
- Growth Bottom 29%
- How it earns
- Lyon earns on volume. Rates run below the Auvergne-Rhône-Alpes average at about €125 a night, but listings book 46% of nights. Revenue per listing, €15,900, is close to the Auvergne-Rhône-Alpes average. Month to month, the median listing earns about €1,520 and a top-quarter listing €2,450 or more.
- When it earns
- Demand in Lyon holds up through the year: February, the slowest month, still brings in about two-thirds of September's revenue. Guests book later than in most of Auvergne-Rhône-Alpes, about 43 days ahead against roughly 58 for the typical market in Auvergne-Rhône-Alpes; stays average 5 nights. Most hosts take one- or two-night bookings (75% of listings), more than in the typical market.
- Who books
- Nearly four in ten guests (38%) travel from abroad, most often from the United States and the United Kingdom.
- What sells
- Smaller places set the market: only 10% of entire homes have three or more bedrooms, against about 26% in the typical market in Auvergne-Rhône-Alpes; apartments and condos make up 95% of supply.
- Who it suits
- Best for buyers who want income that holds up all year and would rather price for occupancy than for rate.
- Registration
- About three-quarters of listings display a registration number, so confirm the local rules before buying.
Revenue per listing by month
€2,150 €1,460- Median listing
- €1,520/mo
- Top 25% of listings
- €2,450+/mo
- Booked ahead
- 43 days
- Average stay
- 5 nights
- Guests from abroad
- 38%
- Most common home size
- 1 bedroom
Areas in the full report: Vieux Lyon · La Croix-Rousse · Part-Dieu
Full Lyon Airbnb report7. Sallanches
Known for: High occupancy · Growing revenue
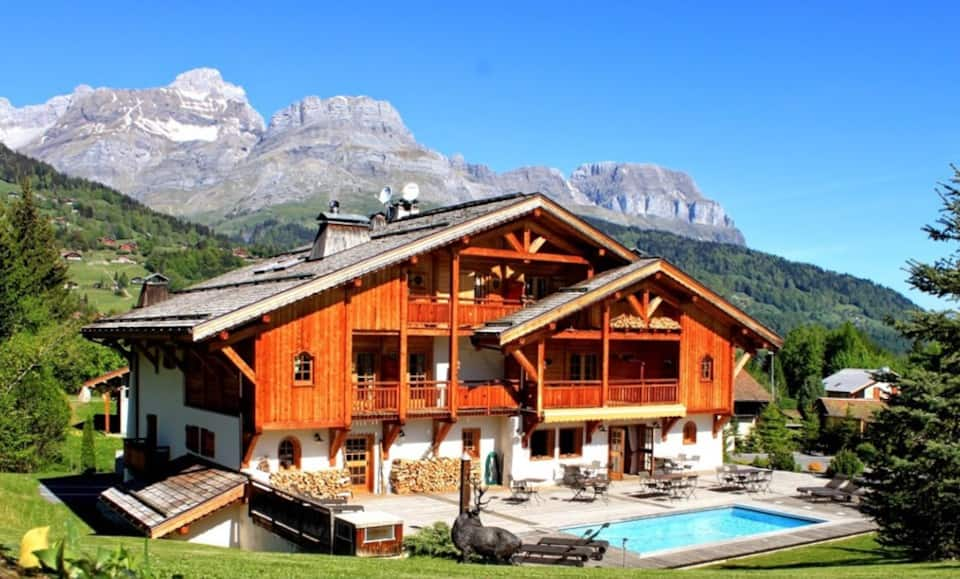


Top-earning Airbnb listings in Sallanches - Avg. revenue
- €17,600 +19% vs. last year
- Occupancy
- 46%
- Nightly rate
- €160
- Active listings
- 261
Where it places among the 153 ranked markets in Auvergne-Rhône-Alpes
- Revenue Top 28%
- Occupancy Top 5%
- Market size Top 39%
- Year-round Top 37%
- Growth Top 10%
- How it earns
- Rates in Sallanches sit below the Auvergne-Rhône-Alpes average, at about €160 a night, but listings are booked on 46% of nights. That adds up to €17,600 per listing over the year, 7% above the Auvergne-Rhône-Alpes average. A typical listing takes in about €1,360 a month; the top quarter clear €2,170 or more. Revenue per listing rose 19% over the year, helped by nightly rates 22% higher, even as the number of listings grew 21%. With 261 listings it is a small market, so its averages can move more from year to year.
- When it earns
- Sallanches has two seasons, December–February and July–August. August is the strongest month at about €3,120 per listing, and November the quietest at about €1,070.
- Guest expectations
- Guests rate listings highly, 4.87 stars on average against 4.79 for the typical market in Auvergne-Rhône-Alpes, so reviews set a high bar.
- Who books
- About three in ten guests (30%) travel from abroad, most often from the United Kingdom and Germany.
- Who it suits
- A good fit for buyers who can ride out a slow November and would rather price for occupancy than for rate.
Revenue per listing by month
€3,120 €1,070- Median listing
- €1,360/mo
- Top 25% of listings
- €2,170+/mo
- Booked ahead
- 58 days
- Average stay
- 6 nights
- Most common home size
- 1 bedroom
- Superhosts
- 54%
8. Tignes
Known for: Large market · High earnings
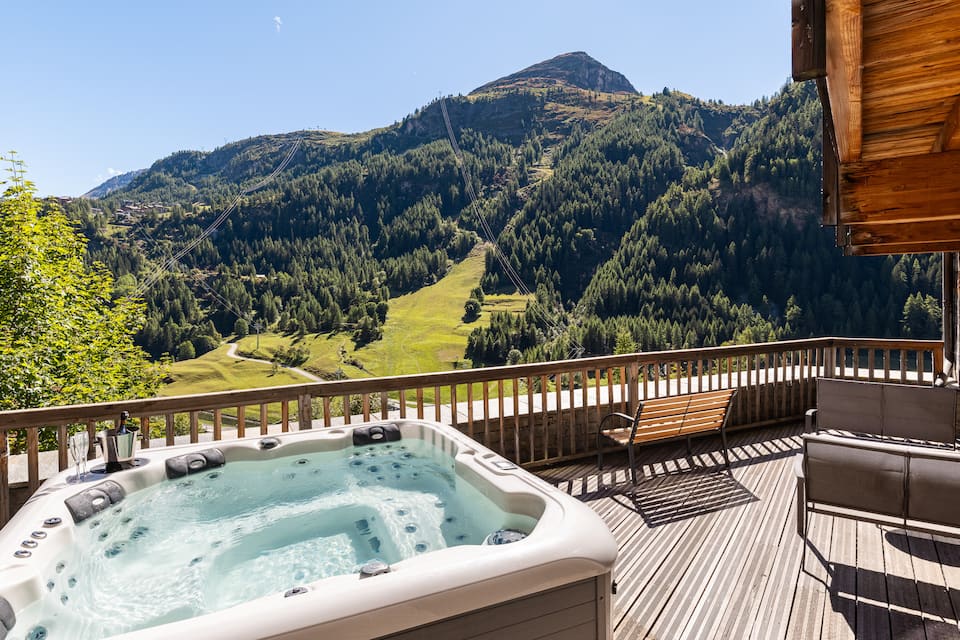
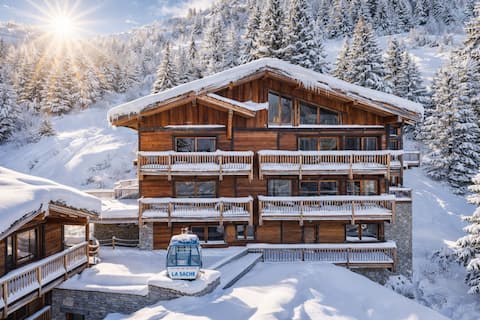

Top-earning Airbnb listings in Tignes - Avg. revenue
- €23,400 +9% vs. last year
- Occupancy
- 42%
- Nightly rate
- €230
- Active listings
- 1,170
Where it places among the 153 ranked markets in Auvergne-Rhône-Alpes
- Revenue Top 16%
- Occupancy Top 18%
- Market size Top 8%
- Year-round Bottom 17%
- Growth Top 34%
- How it earns
- Tignes listings charge about €230 a night, 28% above the Auvergne-Rhône-Alpes average, and are booked on 42% of nights. Listings averaged €23,400 in revenue over the year, 42% above the Auvergne-Rhône-Alpes average. In a typical month the median listing brings in about €1,970, and the best quarter clear €3,450. Revenue per listing rose 9% over the year, helped by nightly rates 11% higher, even as the number of listings grew 18%.
- When it earns
- Tignes' season runs from December to April, peaking in February at about €6,030 per listing; October, the quietest month, brings in about €1,030. Bookings arrive well in advance, about 82 days before check-in, so much of a season's calendar fills early; stays average 7 nights.
- Guest expectations
- Average ratings (4.66 stars) trail the typical market in Auvergne-Rhône-Alpes (4.79), which leaves room for a well-run listing to stand out.
- Who books
- 45% of guests travel from abroad, most often from the United Kingdom and Belgium.
- Who it suits
- It suits buyers who are prepared for thin bookings around October and plan to use a professional manager or run a polished operation.
Revenue per listing by month
€6,030 €1,030- Median listing
- €1,970/mo
- Top 25% of listings
- €3,450+/mo
- Booked ahead
- 82 days
- Average stay
- 7 nights
- Guests from abroad
- 45%
- Most common home size
- 1 bedroom
Areas in the full report: Tignes Le Lac · Val Claret · Tignes 1800
Full Tignes Airbnb report9. Val-d'Isère
Known for: High earnings · High occupancy
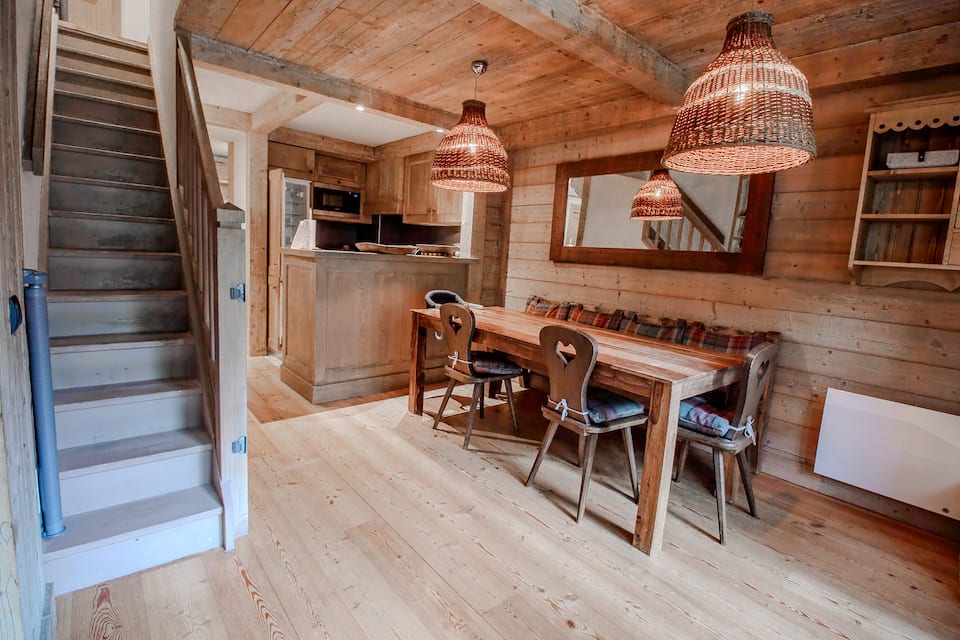
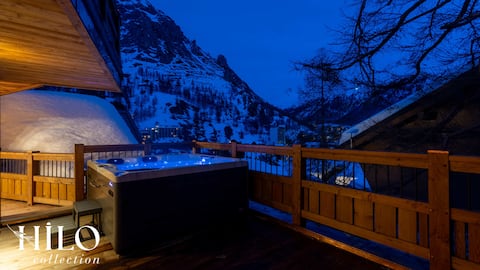

Top-earning Airbnb listings in Val-d'Isère - Avg. revenue
- €36,700 +5% vs. last year
- Occupancy
- 43%
- Nightly rate
- €400
- Active listings
- 537
Where it places among the 153 ranked markets in Auvergne-Rhône-Alpes
- Revenue Top 2%
- Occupancy Top 13%
- Market size Top 21%
- Year-round Bottom 2%
- Growth Bottom 38%
- How it earns
- Val-d'Isère commands premium rates, about €400 a night, and still books 43% of nights, 3 points above the Auvergne-Rhône-Alpes average. Average revenue per listing came to €36,700, the second-highest of the 153 ranked markets. Month to month, the median listing earns about €3,120 and a top-quarter listing €5,520 or more. Revenue per listing rose 5% over the year, helped by nightly rates 14% higher.
- When it earns
- Revenue in Val-d'Isère concentrates from December to April: February earns about €9,640 per listing, about 8.5 times as much as September. Guests book early, about 80 days ahead against roughly 58 for the typical market in Auvergne-Rhône-Alpes, and stay about 7 nights. About a quarter of listings (26%) ask for a stay of a week or more.
- Who books
- Most guests come from abroad (61%), led by visitors from the United Kingdom, the United States and Australia.
- What sells
- Two-bedroom homes lead the market (30% of entire homes), and apartments and condos make up 93% of supply.
- Who it suits
- Best for buyers who can furnish and price for a premium stay and can carry costs through a quiet September.
- Registration
- Registration numbers appear on nearly all listings; check with the local authority before buying.
Revenue per listing by month
€9,640 €1,140- Median listing
- €3,120/mo
- Top 25% of listings
- €5,520+/mo
- Booked ahead
- 80 days
- Average stay
- 7 nights
- Guests from abroad
- 61%
- Most common home size
- 2 bedrooms
Areas in the full report: La Daille · Le Fornet · Val-d'Isère Village
Full Val-d'Isère Airbnb report10. Morzine
Known for: Large market · High earnings
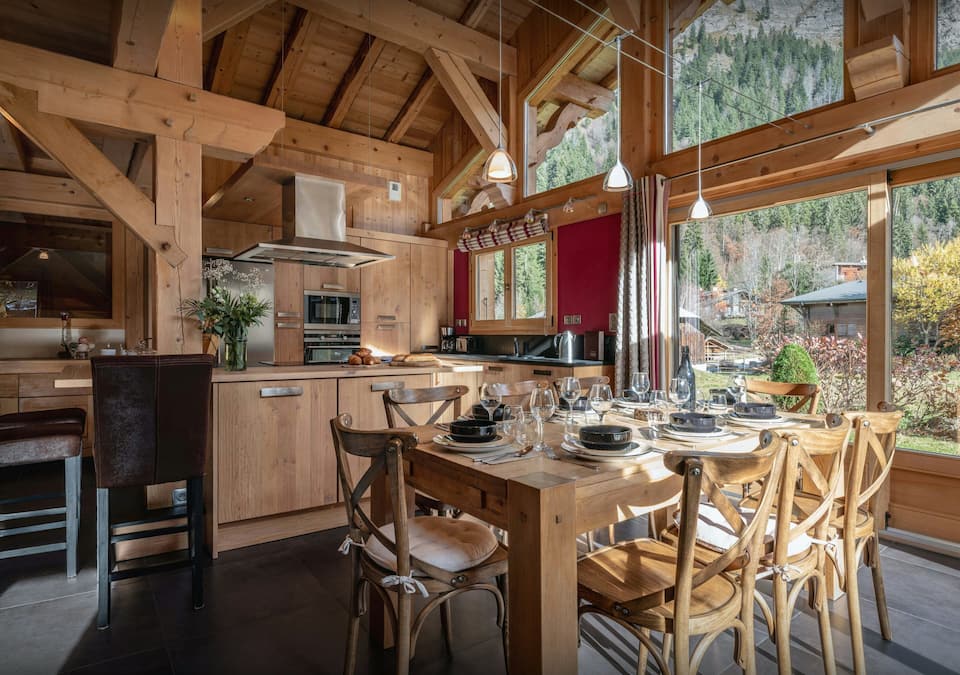

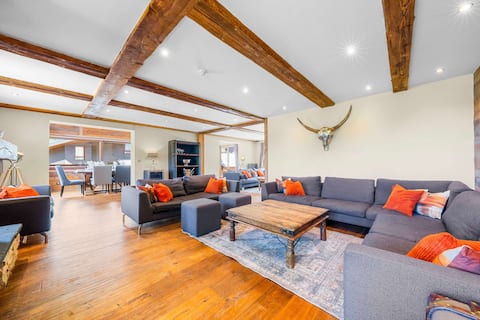
Top-earning Airbnb listings in Morzine - Avg. revenue
- €27,400 +9% vs. last year
- Occupancy
- 39%
- Nightly rate
- €335
- Active listings
- 1,840
Where it places among the 153 ranked markets in Auvergne-Rhône-Alpes
- Revenue Top 10%
- Occupancy Top 44%
- Market size Top 3%
- Year-round Bottom 17%
- Growth Top 34%
- How it earns
- Morzine earns on price: guests pay about €335 a night, 87% above the Auvergne-Rhône-Alpes average. That adds up to €27,400 per listing over the year, 67% above the Auvergne-Rhône-Alpes average. A typical listing takes in about €2,440 a month; the top quarter clear €4,460 or more. Revenue per listing rose 9% over the year, helped by nightly rates 10% higher.
- When it earns
- Revenue in Morzine peaks twice, over December–March and again over July–August; February leads at about €7,380 per listing, while October brings in about €1,230. Bookings arrive well in advance, about 83 days before check-in, so much of a season's calendar fills early; stays average 6 nights.
- Who books
- Most guests come from abroad (65%), led by visitors from the United Kingdom, Switzerland and Belgium.
- What sells
- The most common entire home has 2 bedrooms (26% of entire homes), and apartments and condos make up 82% of supply.
- Who it suits
- A good fit for buyers who can ride out a slow October and can furnish and price for a premium stay.
Revenue per listing by month
€7,380 €1,230- Median listing
- €2,440/mo
- Top 25% of listings
- €4,460+/mo
- Booked ahead
- 83 days
- Average stay
- 6 nights
- Guests from abroad
- 65%
- Most common home size
- 2 bedrooms
Areas in the full report: Morzine Village · Les Gets · Avoriaz
Full Morzine Airbnb report
Full ranking
How the Top 100 Markets in Auvergne-Rhône-Alpes Compare
The overall ranking with the five measures behind it. "Slow month" is a market's weakest month of revenue as a share of its best, so a higher figure means steadier income. Select a column heading to re-sort.
| Chamonix-Mont-Blanc Large market, high earnings | €35,390 | 44% | €324 | 28% | +14% | 2,184 | |
| Annecy Large market, high occupancy | €22,394 | 49% | €170 | 31% | +11% | 3,140 | |
| Les Houches High earnings, high occupancy | €30,510 | 43% | €284 | 32% | +7% | 633 | |
| 4 | Thônes High occupancy, high earnings | €30,083 | 47% | €191 | 42% | +23% | 140 |
| 5 | Sevrier High occupancy, high earnings | €28,422 | 47% | €252 | 27% | +8% | 270 |
| 6 | Lyon Large market, high occupancy | €15,892 | 46% | €123 | 68% | +3% | 4,473 |
| 7 | Sallanches High occupancy, growing revenue | €17,575 | 46% | €160 | 34% | +19% | 261 |
| 8 | Tignes Large market, high earnings | €23,356 | 42% | €228 | 17% | +9% | 1,174 |
| 9 | Val-d'Isère High earnings, high occupancy | €36,746 | 43% | €401 | 12% | +5% | 537 |
| 10 | Morzine Large market, high earnings | €27,422 | 39% | €335 | 17% | +9% | 1,836 |
| 11 | Bourg-Saint-Maurice Large market, high occupancy | €20,898 | 42% | €226 | 14% | +12% | 1,362 |
| 12 | Le Bourg-d'Oisans High occupancy, high earnings | €19,806 | 42% | €180 | 43% | +10% | 199 |
| 13 | Thonon-les-Bains Growing revenue, high occupancy | €13,195 | 45% | €115 | 35% | +23% | 417 |
| 14 | Villeurbanne Year-round demand, large market | €11,590 | 44% | €99 | 70% | +9% | 1,123 |
| 15 | Les Belleville Large market, high occupancy | €23,131 | 42% | €263 | 12% | +7% | 1,480 |
| 16 | Manigod High earnings | €45,615 | 39% | €419 | 42% | −8% | 248 |
| 17 | Les Allues High earnings, large market | €31,321 | 39% | €427 | 13% | +10% | 922 |
| 18 | Samoëns Large market, growing revenue | €20,460 | 38% | €238 | 30% | +14% | 709 |
| 19 | Les Deux Alpes Large market, growing revenue | €19,263 | 40% | €196 | 15% | +15% | 1,418 |
| 20 | Évian-les-Bains High occupancy, growing revenue | €16,078 | 46% | €132 | 34% | +9% | 240 |
| 21 | Courchevel High earnings, large market | €33,942 | 39% | €469 | 11% | +7% | 725 |
| 22 | Veyrier-du-Lac High earnings, high occupancy | €36,516 | 44% | €426 | 21% | +5% | 145 |
| 23 | Menthon-Saint-Bernard High occupancy, high earnings | €27,568 | 45% | €310 | 21% | +11% | 117 |
| 24 | Saint-Jorioz High earnings, high occupancy | €22,100 | 42% | €244 | 29% | +3% | 239 |
| 25 | Montriond High earnings | €33,141 | 38% | €362 | 24% | +8% | 213 |
| 26 | Saint-Jean-d'Aulps Growing revenue, high earnings | €19,521 | 38% | €215 | 27% | +20% | 283 |
| 27 | Saint-Gervais-les-Bains Large market, high earnings | €18,789 | 39% | €222 | 29% | +2% | 1,292 |
| 28 | Passy Growing revenue, high occupancy | €14,016 | 42% | €139 | 33% | +13% | 268 |
| 29 | Combloux High earnings, large market | €25,847 | 36% | €297 | 31% | +2% | 406 |
| 30 | Abondance High earnings, high occupancy | €25,077 | 42% | €241 | 48% | 0% | 117 |
| 31 | Doussard High occupancy, high earnings | €24,265 | 43% | €223 | 20% | +3% | 188 |
| 32 | La Plagne-Tarentaise Large market, high occupancy | €16,334 | 41% | €187 | 13% | +9% | 1,300 |
| 33 | Aix-les-Bains Large market, growing revenue | €10,961 | 42% | €102 | 29% | +17% | 1,069 |
| 34 | Talloires-Montmin High earnings, high occupancy | €24,328 | 42% | €265 | 23% | +1% | 192 |
| 35 | Le Grand-Bornand High earnings, large market | €23,517 | 36% | €266 | 33% | −7% | 631 |
| 36 | Caluire-et-Cuire Year-round demand, high occupancy | €12,676 | 43% | €128 | 65% | +4% | 242 |
| 37 | La Clusaz High earnings, large market | €26,117 | 35% | €347 | 27% | +2% | 639 |
| 38 | Huez Large market, growing revenue | €19,180 | 36% | €239 | 13% | +13% | 1,334 |
| 39 | Vallon-Pont-d'Arc Growing revenue, high occupancy | €14,881 | 41% | €167 | 21% | +11% | 289 |
| 40 | Taninges Growing revenue | €16,260 | 38% | €183 | 32% | +18% | 191 |
| 41 | Le Bourget-du-Lac High occupancy | €16,166 | 50% | €128 | 32% | +8% | 108 |
| 42 | Les Contamines-Montjoie Large market | €16,325 | 39% | €172 | 23% | +6% | 389 |
| 43 | Autrans-Méaudre en Vercors High occupancy | €15,949 | 40% | €139 | 38% | +8% | 166 |
| 44 | Saint-Jean-de-Maurienne Growing revenue, high occupancy | €14,963 | 41% | €136 | 40% | +42% | 110 |
| 45 | La Giettaz High earnings | €30,330 | 37% | €264 | 42% | 0% | 131 |
| 46 | Les Gets High earnings, large market | €23,035 | 35% | €326 | 21% | +3% | 641 |
| 47 | Oz High earnings, high occupancy | €21,988 | 40% | €252 | 19% | +7% | 166 |
| 48 | Saint-Jean-de-Sixt High earnings | €27,828 | 39% | €302 | 22% | −11% | 171 |
| 49 | Champagny-en-Vanoise High earnings | €21,741 | 37% | €290 | 22% | +3% | 287 |
| 50 | Allemond High occupancy, growing revenue | €16,355 | 44% | €140 | 24% | +10% | 103 |
| 51 | Val-Cenis Growing revenue, large market | €13,654 | 39% | €190 | 17% | +14% | 339 |
| 52 | Bourg-en-Bresse Year-round demand, growing revenue | €9,457 | 42% | €76 | 65% | +18% | 247 |
| 53 | Chambon-sur-Lac High occupancy, growing revenue | €16,258 | 41% | €146 | 25% | +9% | 134 |
| 54 | Saint-Priest Year-round demand, high occupancy | €11,044 | 42% | €96 | 71% | +7% | 177 |
| 55 | Brides-les-Bains High occupancy | €10,969 | 43% | €134 | 28% | +8% | 259 |
| 56 | Chambéry Year-round demand, large market | €9,703 | 41% | €93 | 61% | +6% | 447 |
| 57 | Annemasse Year-round demand, high occupancy | €7,694 | 42% | €83 | 66% | +12% | 402 |
| 58 | Grenoble Year-round demand, large market | €7,664 | 41% | €73 | 78% | +7% | 1,351 |
| 59 | Megève Large market, high earnings | €23,892 | 32% | €380 | 18% | +5% | 965 |
| 60 | La Chapelle-d'Abondance Growing revenue, high earnings | €22,948 | 36% | €277 | 29% | +15% | 129 |
| 61 | Hauteluce Large market | €16,169 | 38% | €192 | 22% | +4% | 312 |
| 62 | Ferney-Voltaire High occupancy, year-round demand | €12,442 | 43% | €126 | 62% | −6% | 161 |
| 63 | Moulins Growing revenue, high occupancy | €10,004 | 43% | €77 | 47% | +17% | 166 |
| 64 | Châtel Large market, high earnings | €20,582 | 34% | €306 | 26% | 0% | 662 |
| 65 | Sainte-Foy-Tarentaise Growing revenue, high earnings | €25,077 | 35% | €364 | 18% | +27% | 140 |
| 66 | Montvalezan Growing revenue | €15,509 | 38% | €217 | 16% | +10% | 268 |
| 67 | Mont-Dore Large market | €10,897 | 39% | €103 | 44% | 0% | 795 |
| 68 | Bron Year-round demand, growing revenue | €10,328 | 39% | €94 | 76% | +13% | 157 |
| 69 | Vichy Large market | €9,298 | 39% | €87 | 38% | +8% | 827 |
| 70 | Clermont-Ferrand Large market, year-round demand | €8,937 | 38% | €86 | 56% | +8% | 1,105 |
| 71 | Orelle High occupancy, high earnings | €17,553 | 42% | €208 | 19% | +4% | 130 |
| 72 | Valence Year-round demand, large market | €8,529 | 40% | €82 | 56% | +6% | 456 |
| 73 | Notre-Dame-de-Bellecombe Growing revenue, high earnings | €17,566 | 33% | €244 | 21% | +40% | 191 |
| 74 | Décines-Charpieu Year-round demand | €11,378 | 39% | €100 | 74% | +1% | 179 |
| 75 | Peisey-Nancroix High earnings, growing revenue | €19,592 | 36% | €279 | 14% | +8% | 181 |
| 76 | Valloire Large market | €14,802 | 37% | €211 | 14% | +6% | 402 |
| 77 | Thollon-les-Mémises | €12,552 | 36% | €121 | 36% | +8% | 204 |
| 78 | Faverges-Seythenex Growing revenue, high occupancy | €12,539 | 41% | €135 | 29% | +21% | 104 |
| 79 | Besse-et-Saint-Anastaise Large market | €12,277 | 37% | €116 | 24% | +3% | 753 |
| 80 | Die High occupancy, growing revenue | €10,266 | 42% | €107 | 38% | +12% | 119 |
| 81 | Pralognan-la-Vanoise High occupancy | €14,134 | 40% | €154 | 22% | +4% | 130 |
| 82 | Aubenas Growing revenue, high occupancy | €10,067 | 41% | €119 | 28% | +14% | 156 |
| 83 | Crest High occupancy, growing revenue | €9,892 | 43% | €98 | 34% | +17% | 105 |
| 84 | Vénissieux Year-round demand, growing revenue | €8,302 | 39% | €86 | 77% | +9% | 196 |
| 85 | Vaujany High earnings | €17,938 | 34% | €243 | 22% | +8% | 168 |
| 86 | Bozel High occupancy, high earnings | €16,587 | 41% | €161 | 20% | +1% | 105 |
| 87 | Les Déserts | €14,429 | 34% | €163 | 32% | +7% | 184 |
| 88 | Valmeinier Large market | €12,393 | 38% | €150 | 13% | +7% | 392 |
| 89 | Albertville | €10,308 | 39% | €109 | 48% | +2% | 203 |
| 90 | Bourgoin-Jallieu Year-round demand, high occupancy | €8,788 | 42% | €82 | 78% | +7% | 131 |
| 91 | Morillon Large market | €14,315 | 35% | €188 | 20% | +3% | 310 |
| 92 | Tassin-la-Demi-Lune Growing revenue, year-round demand | €10,031 | 40% | €118 | 53% | +18% | 100 |
| 93 | Oullins-Pierre-Bénite Year-round demand, high occupancy | €9,607 | 42% | €93 | 73% | +3% | 122 |
| 94 | Saint-Étienne Year-round demand, large market | €6,105 | 38% | €67 | 73% | +6% | 860 |
| 95 | Saint-Nectaire Growing revenue | €13,568 | 37% | €118 | 38% | +8% | 102 |
| 96 | Aime-la-Plagne Large market | €13,500 | 37% | €179 | 19% | −6% | 371 |
| 97 | Saint-Martin-d'Ardèche Growing revenue | €12,127 | 39% | €133 | 26% | +21% | 106 |
| 98 | Beaufort Growing revenue | €11,492 | 32% | €146 | 34% | +12% | 266 |
| 99 | Chamrousse Large market, growing revenue | €10,892 | 37% | €122 | 14% | +9% | 521 |
| 100 | Vienne | €9,676 | 36% | €103 | 46% | +8% | 259 |
By measure
Auvergne-Rhône-Alpes Airbnb Markets Ranked by Revenue, Nightly Rate and Occupancy
The overall ranking balances five measures. These lists take one at a time, for buyers who care most about income, pricing power, bookings, a steady calendar, momentum or market size.
Highest-earning Airbnb markets in Auvergne-Rhône-Alpes
Average annual revenue per active listing over the past 12 months. Markets with at least 200 listings.
| # | Market | Revenue |
|---|---|---|
| Manigod #16 overall | €45,600 | |
| Val-d'Isère #9 overall | €36,700 | |
| Chamonix-Mont-Blanc #1 overall | €35,400 | |
| 4 | Courchevel #21 overall | €33,900 |
| 5 | Montriond #25 overall | €33,100 |
| 6 | Les Allues #17 overall | €31,300 |
| 7 | Les Houches #3 overall | €30,500 |
| 8 | Sevrier #5 overall | €28,400 |
| 9 | Morzine #10 overall | €27,400 |
| 10 | La Clusaz #37 overall | €26,100 |
| 11 | Combloux #29 overall | €25,800 |
| 12 | Megève #59 overall | €23,900 |
| 13 | Le Grand-Bornand #35 overall | €23,500 |
| 14 | Tignes #8 overall | €23,400 |
| 15 | Les Belleville #15 overall | €23,100 |
| 16 | Les Gets #46 overall | €23,000 |
| 17 | Annecy #2 overall | €22,400 |
| 18 | Saint-Jorioz #24 overall | €22,100 |
| 19 | Champagny-en-Vanoise #49 overall | €21,700 |
| 20 | Bourg-Saint-Maurice #11 overall | €20,900 |
| 21 | Châtel #64 overall | €20,600 |
| 22 | Samoëns #18 overall | €20,500 |
| 23 | Saint-Jean-d'Aulps #26 overall | €19,500 |
| 24 | Les Deux Alpes #19 overall | €19,300 |
| 25 | Huez #38 overall | €19,200 |
Most expensive Airbnb markets in Auvergne-Rhône-Alpes by nightly rate
Average rate per booked night. A high rate earns most where occupancy holds up too. Markets with at least 200 listings.
| # | Market | Nightly |
|---|---|---|
| Courchevel #21 overall | €470 | |
| Les Allues #17 overall | €425 | |
| Manigod #16 overall | €420 | |
| 4 | Val-d'Isère #9 overall | €400 |
| 5 | Megève #59 overall | €380 |
| 6 | Montriond #25 overall | €360 |
| 7 | La Clusaz #37 overall | €345 |
| 8 | Morzine #10 overall | €335 |
| 9 | Les Gets #46 overall | €325 |
| 10 | Chamonix-Mont-Blanc #1 overall | €325 |
| 11 | Châtel #64 overall | €305 |
| 12 | Combloux #29 overall | €295 |
| 13 | Champagny-en-Vanoise #49 overall | €290 |
| 14 | Les Houches #3 overall | €285 |
| 15 | Le Grand-Bornand #35 overall | €265 |
| 16 | Les Belleville #15 overall | €265 |
| 17 | Sevrier #5 overall | €250 |
| 18 | Saint-Jorioz #24 overall | €245 |
| 19 | Huez #38 overall | €240 |
| 20 | Samoëns #18 overall | €240 |
| 21 | Tignes #8 overall | €230 |
| 22 | Bourg-Saint-Maurice #11 overall | €225 |
| 23 | Fontcouverte-la-Toussuire #112 overall | €225 |
| 24 | Saint-Gervais-les-Bains #27 overall | €220 |
| 25 | Montvalezan #66 overall | €215 |
Highest-occupancy Airbnb markets in Auvergne-Rhône-Alpes
Share of available nights booked over the past 12 months. Markets with at least 200 listings.
| # | Market | Occupancy |
|---|---|---|
| Annecy #2 overall | 49% | |
| Sevrier #5 overall | 47% | |
| Évian-les-Bains #20 overall | 46% | |
| 4 | Lyon #6 overall | 46% |
| 5 | Sallanches #7 overall | 46% |
| 6 | Thonon-les-Bains #13 overall | 45% |
| 7 | Chamonix-Mont-Blanc #1 overall | 44% |
| 8 | Villeurbanne #14 overall | 44% |
| 9 | Brides-les-Bains #55 overall | 43% |
| 10 | Val-d'Isère #9 overall | 43% |
| 11 | Les Houches #3 overall | 43% |
| 12 | Caluire-et-Cuire #36 overall | 43% |
| 13 | Les Belleville #15 overall | 42% |
| 14 | Aix-les-Bains #33 overall | 42% |
| 15 | Annemasse #57 overall | 42% |
| 16 | Tignes #8 overall | 42% |
| 17 | Saint-Jorioz #24 overall | 42% |
| 18 | Bourg-en-Bresse #52 overall | 42% |
| 19 | Bourg-Saint-Maurice #11 overall | 42% |
| 20 | Passy #28 overall | 42% |
| 21 | Chambéry #56 overall | 41% |
| 22 | Grenoble #58 overall | 41% |
| 23 | La Plagne-Tarentaise #32 overall | 41% |
| 24 | Vallon-Pont-d'Arc #39 overall | 41% |
| 25 | Valence #72 overall | 40% |
Most year-round Airbnb markets in Auvergne-Rhône-Alpes
Revenue in the slowest month as a share of the best month, so a higher figure means steadier income. Markets with at least 200 listings.
| # | Market | Slow month |
|---|---|---|
| Grenoble #58 overall | 78% | |
| Saint-Étienne #94 overall | 73% | |
| Villeurbanne #14 overall | 70% | |
| 4 | Lyon #6 overall | 68% |
| 5 | Roanne #124 overall | 67% |
| 6 | Annemasse #57 overall | 66% |
| 7 | Bourg-en-Bresse #52 overall | 65% |
| 8 | Caluire-et-Cuire #36 overall | 65% |
| 9 | Chambéry #56 overall | 61% |
| 10 | Clermont-Ferrand #70 overall | 56% |
| 11 | Valence #72 overall | 56% |
| 12 | Montluçon #101 overall | 54% |
| 13 | Albertville #89 overall | 48% |
| 14 | Vienne #100 overall | 46% |
| 15 | Mont-Dore #67 overall | 44% |
| 16 | Manigod #16 overall | 42% |
| 17 | Aurillac #115 overall | 41% |
| 18 | Le Puy-en-Velay #143 overall | 40% |
| 19 | Vichy #69 overall | 38% |
| 20 | La Bourboule #117 overall | 37% |
| 21 | Thollon-les-Mémises #77 overall | 36% |
| 22 | Thonon-les-Bains #13 overall | 35% |
| 23 | Allevard #119 overall | 35% |
| 24 | Beaufort #98 overall | 34% |
| 25 | Sallanches #7 overall | 34% |
Fastest-growing Airbnb markets in Auvergne-Rhône-Alpes
Change in revenue per listing from the year before, among markets where it rose. Markets with at least 200 listings.
| # | Market | Change |
|---|---|---|
| Montluçon #101 overall | +38% | |
| Thonon-les-Bains #13 overall | +23% | |
| Saint-Jean-d'Aulps #26 overall | +20% | |
| 4 | Sallanches #7 overall | +19% |
| 5 | Bourg-en-Bresse #52 overall | +18% |
| 6 | Aix-les-Bains #33 overall | +17% |
| 7 | Les Deux Alpes #19 overall | +15% |
| 8 | Samoëns #18 overall | +14% |
| 9 | Chamonix-Mont-Blanc #1 overall | +14% |
| 10 | Val-Cenis #51 overall | +14% |
| 11 | Huez #38 overall | +13% |
| 12 | Passy #28 overall | +13% |
| 13 | Aurillac #115 overall | +13% |
| 14 | Bourg-Saint-Maurice #11 overall | +12% |
| 15 | Beaufort #98 overall | +12% |
| 16 | Annemasse #57 overall | +12% |
| 17 | Vallon-Pont-d'Arc #39 overall | +11% |
| 18 | Annecy #2 overall | +11% |
| 19 | Fontcouverte-la-Toussuire #112 overall | +10% |
| 20 | Montvalezan #66 overall | +10% |
| 21 | Les Allues #17 overall | +10% |
| 22 | Chamrousse #99 overall | +9% |
| 23 | Allevard #119 overall | +9% |
| 24 | Morzine #10 overall | +9% |
| 25 | Tignes #8 overall | +9% |
Largest Airbnb markets in Auvergne-Rhône-Alpes
Active listings. Bigger markets have more comparable rentals to price against and more buyers at resale.
| # | Market | Listings |
|---|---|---|
| Lyon #6 overall | 4,470 | |
| Annecy #2 overall | 3,140 | |
| Chamonix-Mont-Blanc #1 overall | 2,180 | |
| 4 | Morzine #10 overall | 1,840 |
| 5 | Les Belleville #15 overall | 1,480 |
| 6 | Les Deux Alpes #19 overall | 1,420 |
| 7 | Bourg-Saint-Maurice #11 overall | 1,360 |
| 8 | Grenoble #58 overall | 1,350 |
| 9 | Huez #38 overall | 1,330 |
| 10 | La Plagne-Tarentaise #32 overall | 1,300 |
| 11 | Saint-Gervais-les-Bains #27 overall | 1,290 |
| 12 | Tignes #8 overall | 1,170 |
| 13 | Villeurbanne #14 overall | 1,120 |
| 14 | Clermont-Ferrand #70 overall | 1,110 |
| 15 | Aix-les-Bains #33 overall | 1,070 |
| 16 | Megève #59 overall | 965 |
| 17 | Les Allues #17 overall | 922 |
| 18 | Saint-Étienne #94 overall | 860 |
| 19 | Vichy #69 overall | 827 |
| 20 | Mont-Dore #67 overall | 795 |
| 21 | Besse-et-Saint-Anastaise #79 overall | 753 |
| 22 | Villard-de-Lans #114 overall | 751 |
| 23 | Courchevel #21 overall | 725 |
| 24 | Samoëns #18 overall | 709 |
| 25 | Arâches-la-Frasse #118 overall | 689 |
Seasonality
When Airbnbs in Auvergne-Rhône-Alpes Earn the Most
No single month dominates in Auvergne-Rhône-Alpes: February is the peak for 75 of the 153 ranked markets and August for 59. October is the most common slowest month, in 50 markets.
February earns about 2.8 times what October does
Average revenue per listing across the 153 ranked markets in Auvergne-Rhône-Alpes, by month
| Month | Avg. revenue per listing | Best month for | Highest-ranked examples |
|---|---|---|---|
| January | €2,660 | – | – |
| February | €3,520 | 75 markets | Chamonix-Mont-Blanc, Les Houches, Tignes |
| March | €2,610 | – | – |
| April | €1,720 | – | – |
| May | €1,570 | – | – |
| June | €1,660 | 3 markets | Caluire-et-Cuire, Ferney-Voltaire, Vénissieux |
| July | €2,280 | 8 markets | Veyrier-du-Lac, Saint-Jean-de-Maurienne, Saint-Priest |
| August | €2,510 | 59 markets | Annecy, Thônes, Sevrier |
| September | €1,460 | 5 markets | Lyon, Villeurbanne, Grenoble |
| October | €1,240 | 1 market | Oullins-Pierre-Bénite |
| November | €1,290 | – | – |
| December | €2,340 | 2 markets | Bourgoin-Jallieu, Grand-Aigueblanche |
Average revenue is per listing across the ranked markets, the line in the chart above. "Best month for" counts the ranked markets whose own revenue peaks in that month.
Method
How the Ranking Works
The ranking covers the 153 markets in Auvergne-Rhône-Alpes with at least 100 active Airbnb listings and data through October 2026. Each market is compared with the others on five measures, and markets are ordered by a weighted blend of where they place on each:
- Revenue per listing (35%): average revenue an active listing earned over the past 12 months.
- Occupancy (20%): share of available nights that were booked.
- Market size (20%): active listings. Bigger markets offer more comparable rentals to price against and more buyers when you sell.
- Year-round demand (15%): revenue in the slowest month as a share of the best month. The latest month is left out when its bookings look incomplete.
- Growth (10%): change in revenue per listing from the year before. Markets whose boundaries changed between years are scored in the middle.
Left out: 177 markets whose data predate the latest refresh and 3 towns listed a second time under another spelling. The score measures how rentals perform. It does not include purchase prices, financing, operating costs or local short-term rental rules, which vary by address and should be checked before buying. Figures are in euros and match each market's own report; see the data methodology for how listings are tracked.
To check one property before buying, run its address and size through the Airbnb calculator for a revenue, occupancy and nightly-rate range from comparable listings.
FAQ
Frequently Asked Questions About Airbnb Investing in Auvergne-Rhône-Alpes
What is the best place to buy an Airbnb in Auvergne-Rhône-Alpes?
Chamonix-Mont-Blanc ranks first of the 153 markets in Auvergne-Rhône-Alpes in AirROI's ranking, with €35,400 in average revenue per listing and 44% occupancy. Annecy and Les Houches follow. The ranking weighs revenue, occupancy, market size, seasonality and growth; it leaves out purchase prices.
What are the most profitable Airbnb locations in Auvergne-Rhône-Alpes?
By revenue per listing, among markets with at least 200 listings, Manigod leads at €45,600 a year, ahead of Val-d'Isère at €36,700. Profit also depends on what a property costs to buy and run, which varies far more between markets than revenue does.
How much does an Airbnb make in Auvergne-Rhône-Alpes?
The average active listing in Auvergne-Rhône-Alpes earned €16,500 over the 12 months to October 2026, at 40% occupancy. Across the ranked markets, the middle half averaged between €9,820 and €19,200 per listing. Averages include listings that operated for only part of the year, so a listing rented all year typically earns more.
What is a good Airbnb occupancy rate in Auvergne-Rhône-Alpes?
The average listing in Auvergne-Rhône-Alpes was booked on 40% of available nights over the past 12 months. Half of the ranked markets fall between 36% and 42%, so a market above about 42% sits in the top quarter. Occupancy is only half the picture: a market with lower occupancy can still earn more if its nightly rates are higher.
Where is Airbnb demand highest in Auvergne-Rhône-Alpes?
Among ranked markets with at least 200 listings, Annecy has the highest occupancy, with 49% of available nights booked, followed by Sevrier at 47%. Its listings average about €170 a night and €22,400 a year.
Where are Airbnb nightly rates highest in Auvergne-Rhône-Alpes?
Among ranked markets with at least 200 listings, Courchevel has the highest average nightly rate, about €470, followed by Les Allues at €425. Roanne is the least expensive, at about €66. The average booked night in Auvergne-Rhône-Alpes costs about €180.
What is the best month for Airbnb in Auvergne-Rhône-Alpes?
February is the highest-earning month for 75 of the 153 ranked markets, followed by August (59). October is the most common slowest month, in 50 of the 153 markets. Each market's report shows its own month-by-month revenue, occupancy and rates.
Which Airbnb markets in Auvergne-Rhône-Alpes earn the most evenly through the year?
Among ranked markets with at least 200 listings, Grenoble has the steadiest income: its slowest month, April, still earns about three-quarters of its best. Saint-Étienne follows, at 73%. Steadier markets are easier to budget for, though they do not always earn the most per listing.
Which Airbnb markets are growing fastest in Auvergne-Rhône-Alpes?
Among ranked markets with at least 200 listings, revenue per listing grew most in Montluçon, up 38% on the year before, and in Thonon-les-Bains, up 23%. A single strong year can reflect events or new supply, so it is worth checking a market's monthly trend before relying on it.
Is Airbnb still profitable in Auvergne-Rhône-Alpes in 2026?
Revenue per listing grew in 131 of the 153 ranked markets with a comparable year of data; in the typical market it rose 7%. Whether a given property profits depends on its purchase price, financing and running costs.
What are the best smaller Airbnb markets in Auvergne-Rhône-Alpes?
Among ranked markets with fewer than 200 active listings, Thônes (#4 overall, €30,100 per listing), Le Bourg-d'Oisans (#12, €19,800) and Veyrier-du-Lac (#22, €36,500) place highest. Smaller markets have fewer comparable rentals to price against, so their averages can move more from year to year.
How many Airbnb listings are there in Auvergne-Rhône-Alpes?
AirROI tracked 85,400 active Airbnb listings in Auvergne-Rhône-Alpes over the 12 months to October 2026, across 821 markets. The largest ranked market is Lyon, with 4,470 listings, followed by Annecy with 3,140.
Do Airbnb hosts need a permit in Auvergne-Rhône-Alpes?
Rules can be national or regional as well as local, and they change often, so check each of them for any address you consider. In the listing data, most listings display a registration number in 18 of the 153 ranked markets, including Chamonix-Mont-Blanc, Annecy and Les Houches, though that shows what hosts display, not what the rules allow.
Directory
All 821 Airbnb Markets in Auvergne-Rhône-Alpes
Every Auvergne-Rhône-Alpes city with an AirROI Airbnb market report, A–Z, with its active listing count.
A
- Abondance 117 listings
- Abrest 23 listings
- Aiguebelette-le-Lac 35 listings
- Aiguilhe 21 listings
- Ailhon 19 listings
- Aillon-le-Jeune 64 listings
- Aillon-le-Vieux 23 listings
- Aime-la-Plagne 371 listings
- Aix-les-Bains 1,069 listings
- Alba-la-Romaine 37 listings
- Albertville 203 listings
- Albiez-Montrond 127 listings
- Alby-sur-Chéran 21 listings
- Alex 44 listings
- Alixan 23 listings
- Allan 25 listings
- Allanche 18 listings
- Allemond 103 listings
- Allevard 218 listings
- Allex 28 listings
- Allinges 24 listings
- Amancy 18 listings
- Ambérieu-en-Bugey 62 listings
- Ambert 36 listings
- Ambilly 64 listings
- Ambronay 21 listings
- Andrézieux-Bouthéon 22 listings
- Annecy 3,140 listings
- Annemasse 402 listings
- Annonay 99 listings
- Anse 31 listings
- Anthy-sur-Léman 29 listings
- Aouste-sur-Sye 48 listings
- Arâches-la-Frasse 689 listings
- Archamps 26 listings
- Argonay 35 listings
- Arpajon-sur-Cère 22 listings
- Artas 18 listings
- Aubenas 156 listings
- Aubière 53 listings
- Aulnat 25 listings
- Aurec-sur-Loire 22 listings
- Aurillac 257 listings
- Auris 161 listings
- Aussois 97 listings
- Autrans-Méaudre en Vercors 166 listings
- Avèze 18 listings
- Aydat 79 listings
B
- Bagnols 39 listings
- Baix 22 listings
- Balazuc 69 listings
- Banne 47 listings
- Barberaz 22 listings
- Bas-en-Basset 23 listings
- Bassens 29 listings
- Beaufort 266 listings
- Beaulieu 37 listings
- Beaumont 76 listings
- Beaumont-lès-Valence 22 listings
- Beausemblant 24 listings
- Beauvallon 25 listings
- Bellecombe-en-Bauges 21 listings
- Bellerive-sur-Allier 86 listings
- Bellevaux 100 listings
- Belleville-en-Beaujolais 43 listings
- Belley 34 listings
- Bernex 116 listings
- Bernin 17 listings
- Berrias-et-Casteljau 41 listings
- Bessans 44 listings
- Bessas 22 listings
- Besse-et-Saint-Anastaise 753 listings
- Billom 23 listings
- Biviers 21 listings
- Blacé 22 listings
- Blesle 19 listings
- Bogève 33 listings
- Bonne 19 listings
- Bonneval-sur-Arc 64 listings
- Bonneville 86 listings
- Bons-en-Chablais 23 listings
- Bouchet 28 listings
- Bourbon-l'Archambault 31 listings
- Bourdeaux 22 listings
- Bourg-Argental 17 listings
- Bourg-de-Péage 39 listings
- Bourg-en-Bresse 247 listings
- Bourg-lès-Valence 79 listings
- Bourg-Saint-Andéol 74 listings
- Bourg-Saint-Maurice 1,362 listings
- Bourgoin-Jallieu 131 listings
- Bozas 23 listings
- Bozel 105 listings
- Brides-les-Bains 259 listings
- Brignais 24 listings
- Brindas 18 listings
- Brioude 44 listings
- Brison-Saint-Innocent 61 listings
- Bron 157 listings
- Buis-les-Baronnies 80 listings
- Burzet 30 listings
C
- Caluire-et-Cuire 242 listings
- Cébazat 27 listings
- Cerdon 21 listings
- Cessy 22 listings
- Ceyrat 32 listings
- Ceyssat 18 listings
- Chabeuil 45 listings
- Challes-les-Eaux 35 listings
- Chamalières 148 listings
- Chamaret 24 listings
- Chambéry 447 listings
- Chambon-sur-Lac 134 listings
- Chambonas 48 listings
- Chamonix 381 listings
- Chamonix-Mont-Blanc 2,184 listings
- Champagnac-le-Vieux 18 listings
- Champagne-au-Mont-d'Or 22 listings
- Champagny-en-Vanoise 287 listings
- Champeix 24 listings
- Champs-sur-Tarentaine-Marchal 25 listings
- Chamrousse 521 listings
- Chanaz 34 listings
- Chandolas 29 listings
- Chantemerle-lès-Grignan 29 listings
- Chantepérier 24 listings
- Chapareillan 25 listings
- Chaponost 30 listings
- Charavines 28 listings
- Charbonnières-les-Bains 32 listings
- Charlieu 28 listings
- Charmes-sur-Rhône 30 listings
- Charnay 22 listings
- Charroux 22 listings
- Charvieu-Chavagneux 17 listings
- Chasse-sur-Rhône 27 listings
- Chassiers 42 listings
- Chassieu 47 listings
- Chastreix 43 listings
- Château-Bernard 24 listings
- Châteaugay 22 listings
- Châteauneuf-de-Galaure 35 listings
- Châteauneuf-du-Rhône 31 listings
- Châteauneuf-sur-Isère 41 listings
- Châtel 662 listings
- Châtel-Guyon 185 listings
- Châtillon-en-Diois 29 listings
- Châtillon-sur-Chalaronne 23 listings
- Châtillon-sur-Cluses 33 listings
- Chatuzange-le-Goubet 27 listings
- Chaudes-Aigues 35 listings
- Chauzon 48 listings
- Chavanay 29 listings
- Chavanod 25 listings
- Chavanoz 17 listings
- Chens-sur-Léman 22 listings
- Chindrieux 40 listings
- Chirols 26 listings
- Chomérac 25 listings
- Chonas-l'Amballan 17 listings
- Claix 27 listings
- Clansayes 21 listings
- Cléon-d'Andran 18 listings
- Clermont-Ferrand 1,105 listings
- Cluses 79 listings
- Cognin 18 listings
- Cohennoz 47 listings
- Collonges-au-Mont-d'Or 23 listings
- Collonges-sous-Salève 40 listings
- Colombier-le-Vieux 19 listings
- Colonzelle 23 listings
- Combloux 406 listings
- Condat-en-Combraille 22 listings
- Condrieu 57 listings
- Conjux 27 listings
- Corbas 25 listings
- Cordon 79 listings
- Corenc 23 listings
- Corps 27 listings
- Corrençon-en-Vercors 95 listings
- Coublevie 17 listings
- Coucouron 21 listings
- Courchevel 725 listings
- Cournon-d'Auvergne 75 listings
- Courpière 19 listings
- Cours 18 listings
- Cranves-Sales 23 listings
- Craponne 34 listings
- Crémieu 43 listings
- Crest 105 listings
- Crest-Voland 112 listings
- Crêts-en-Belledonne 19 listings
- Creuzier-le-Vieux 29 listings
- Crolles 32 listings
- Cruas 28 listings
- Cruseilles 18 listings
- Cublize 23 listings
- Culoz-Béon 21 listings
- Cusset 66 listings
D
- Dardilly 43 listings
- Décines-Charpieu 179 listings
- Demi-Quartier 146 listings
- Désaignes 19 listings
- Deux-Grosnes 18 listings
- Die 119 listings
- Dieulefit 86 listings
- Dingy-Saint-Clair 45 listings
- Diou 18 listings
- Divajeu 22 listings
- Divonne-les-Bains 78 listings
- Domancy 51 listings
- Domène 17 listings
- Dompierre-sur-Besbre 36 listings
- Donzère 42 listings
- Doussard 188 listings
- Douvaine 36 listings
- Drumettaz-Clarafond 28 listings
- Duingt 90 listings
E
- Ébreuil 18 listings
- Échirolles 44 listings
- Écully 109 listings
- Égliseneuve-d'Entraigues 28 listings
- Entrelacs 33 listings
- Entremont-le-Vieux 28 listings
- Épagny Metz-Tessy 43 listings
- Espaly-Saint-Marcel 34 listings
- Essert-Romand 40 listings
- Étables 17 listings
- Étoile-sur-Rhône 29 listings
- Étrembières 36 listings
- Évian-les-Bains 240 listings
- Excenevex 33 listings
- Eybens 25 listings
F
- Faverges-Seythenex 104 listings
- Ferney-Voltaire 161 listings
- Feurs 23 listings
- Fillière 69 listings
- Fillinges 23 listings
- Firminy 17 listings
- Fleurie 22 listings
- Flumet 130 listings
- Fontaine 77 listings
- Fontcouverte-la-Toussuire 277 listings
- Francheville 37 listings
G
- Gaillard 102 listings
- Gannat 49 listings
- Gelles 22 listings
- Genas 69 listings
- Genay 17 listings
- Génissieux 17 listings
- Gerzat 28 listings
- Gex 79 listings
- Gières 33 listings
- Giez 43 listings
- Gilly-sur-Isère 25 listings
- Givors 32 listings
- Gleizé 48 listings
- Glières-Val-de-Borne 84 listings
- Gluiras 17 listings
- Grand-Aigueblanche 114 listings
- Grane 37 listings
- Gras 24 listings
- Gravières 31 listings
- Grenoble 1,351 listings
- Gresse-en-Vercors 124 listings
- Grésy-sur-Aix 36 listings
- Grézieu-la-Varenne 22 listings
- Grignan 72 listings
- Grignon 18 listings
- Groisy 23 listings
- Grospierres 145 listings
- Gruffy 21 listings
- Guéreins 18 listings
- Guilherand-Granges 28 listings
H
- Habère-Poche 36 listings
- Haut Valromey 26 listings
- Hauteluce 312 listings
- Hauterives 22 listings
- Huez 1,334 listings
- Huriel 18 listings
L
- L'Arbresle 21 listings
- L'Isle-d'Abeau 29 listings
- La Balme-de-Sillingy 22 listings
- La Bâthie 25 listings
- La Bâtie-Rolland 18 listings
- La Baume-de-Transit 18 listings
- La Bégude-de-Mazenc 29 listings
- La Biolle 21 listings
- La Bourboule 491 listings
- La Chapelle-d'Abondance 129 listings
- La Chapelle-en-Vercors 37 listings
- La Clusaz 639 listings
- La Côte-d'Arbroz 47 listings
- La Côte-Saint-André 31 listings
- La Garde-Adhémar 38 listings
- La Giettaz 131 listings
- La Léchère 125 listings
- La Morte 58 listings
- La Motte-Servolex 45 listings
- La Mulatière 69 listings
- La Mure 33 listings
- La Plagne-Tarentaise 1,300 listings
- La Ravoire 34 listings
- La Rivière-Enverse 22 listings
- La Roche-Blanche 22 listings
- La Roche-de-Glun 18 listings
- La Roche-sur-Foron 77 listings
- La Roche-sur-le-Buis 33 listings
- La Terrasse 21 listings
- La Tour-d'Auvergne 36 listings
- La Tour-de-Salvagny 19 listings
- La Tour-du-Pin 31 listings
- La Tronche 47 listings
- La Voulte-sur-Rhône 34 listings
- Labastide-de-Virac 32 listings
- Labeaume 63 listings
- Labégude 18 listings
- Lablachère 66 listings
- Lachapelle-sous-Aubenas 36 listings
- Lagnieu 84 listings
- Lagorce 103 listings
- Lamastre 43 listings
- Lanas 19 listings
- Landry 116 listings
- Langeac 35 listings
- Lanobre 17 listings
- Lans-en-Vercors 107 listings
- Largentière 59 listings
- Larringes 18 listings
- Lathuile 81 listings
- Laurac-en-Vivarais 18 listings
- Laveissière 254 listings
- Lavilledieu 28 listings
- Le Biot 56 listings
- Le Bourg-d'Oisans 199 listings
- Le Bourget-du-Lac 108 listings
- Le Chambon-sur-Lignon 90 listings
- Le Châtelard 23 listings
- Le Cheylard 31 listings
- Le Claux 21 listings
- Le Coteau 18 listings
- Le Grand-Bornand 631 listings
- Le Haut-Bréda 75 listings
- Le Monastier-sur-Gazeille 21 listings
- Le Péage-de-Roussillon 22 listings
- Le Poët-Laval 29 listings
- Le Pont-de-Beauvoisin 22 listings
- Le Pouzin 21 listings
- Le Puy 106 listings
- Le Puy-en-Velay 243 listings
- Le Sappey-en-Chartreuse 26 listings
- Le Teil 64 listings
- Le Touvet 17 listings
- Le Vernet-Chaméane 25 listings
- Lélex 92 listings
- Lempdes 23 listings
- Lentilly 27 listings
- Les Abrets en Dauphiné 21 listings
- Les Adrets 202 listings
- Les Allues 922 listings
- Les Ancizes-Comps 18 listings
- Les Assions 34 listings
- Les Avanchers-Valmorel 378 listings
- Les Avenières Veyrins-Thuellin 26 listings
- Les Belleville 1,480 listings
- Les Chapelles 25 listings
- Les Clefs 31 listings
- Les Contamines-Montjoie 389 listings
- Les Déserts 184 listings
- Les Deux Alpes 1,418 listings
- Les Estables 44 listings
- Les Gets 641 listings
- Les Houches 633 listings
- Les Ollières-sur-Eyrieux 24 listings
- Les Salelles 25 listings
- Les Vans 102 listings
- Les Villards-sur-Thônes 70 listings
- Lezoux 18 listings
- Limonest 22 listings
- Lissieu 18 listings
- Livron-sur-Drôme 37 listings
- Loriol-sur-Drôme 31 listings
- Loyettes 28 listings
- Lugrin 66 listings
- Lullin 18 listings
- Lussas 38 listings
- Lyon 4,473 listings
M
- Magland 46 listings
- Malarce-sur-la-Thines 18 listings
- Malataverne 22 listings
- Malbosc 21 listings
- Mandailles-Saint-Julien 31 listings
- Manigod 248 listings
- Manzat 18 listings
- Marboz 21 listings
- Marignier 40 listings
- Marin 19 listings
- Marnaz 26 listings
- Marsac-en-Livradois 20 listings
- Marsanne 23 listings
- Massiac 23 listings
- Massongy 21 listings
- Mauriac 23 listings
- Maxilly-sur-Léman 27 listings
- Megève 965 listings
- Meillerie 18 listings
- Menglon 24 listings
- Mens 23 listings
- Menthon-Saint-Bernard 117 listings
- Mercuer 22 listings
- Mercury 45 listings
- Messeix 18 listings
- Messery 25 listings
- Meximieux 43 listings
- Meylan 56 listings
- Meyras 31 listings
- Meysse 18 listings
- Meyzieu 137 listings
- Mieussy 84 listings
- Mijoux 60 listings
- Millery 22 listings
- Mions 22 listings
- Mirabel-aux-Baronnies 77 listings
- Mirabel-et-Blacons 30 listings
- Miremont 24 listings
- Miribel 31 listings
- Mirmande 36 listings
- Modane 246 listings
- Moirans 20 listings
- Mollans-sur-Ouvèze 92 listings
- Monistrol-sur-Loire 27 listings
- Monnetier-Mornex 18 listings
- Mont-Dore 795 listings
- Mont-Saxonnex 70 listings
- Montagny 28 listings
- Montaigut-le-Blanc 24 listings
- Montalieu-Vercieu 27 listings
- Montboucher-sur-Jabron 36 listings
- Montbrison 59 listings
- Montbrun-les-Bains 63 listings
- Montcel 31 listings
- Montélier 18 listings
- Montélimar 307 listings
- Montgreleix 18 listings
- Montluçon 250 listings
- Montmeyran 22 listings
- Montpezat-sous-Bauzon 24 listings
- Montréal 53 listings
- Montricher-Albanne 25 listings
- Montriond 213 listings
- Montségur-sur-Lauzon 26 listings
- Montvalezan 268 listings
- Morillon 310 listings
- Morzine 1,836 listings
- Moulins 166 listings
- Moûtiers 49 listings
- Mouxy 22 listings
- Murat 83 listings
- Murat-le-Quaire 80 listings
- Murol 123 listings
N
- Nances 18 listings
- Nantua 36 listings
- Nébouzat 38 listings
- Néris-les-Bains 80 listings
- Nernier 17 listings
- Neuvecelle 50 listings
- Neuvéglise-sur-Truyère 30 listings
- Neuville-sur-Saône 23 listings
- Neydens 22 listings
- Notre-Dame-de-Bellecombe 191 listings
- Novalaise 39 listings
- Nyons 182 listings
O
- Olby 19 listings
- Onnion 30 listings
- Orcines 46 listings
- Orelle 130 listings
- Orgnac-l'Aven 43 listings
- Ornex 24 listings
- Ornon 17 listings
- Oullins-Pierre-Bénite 122 listings
- Oyonnax 84 listings
- Oz 166 listings
P
- Passy 268 listings
- Payzac 24 listings
- Peisey-Nancroix 181 listings
- Pélussin 40 listings
- Péron 21 listings
- Péronnas 24 listings
- Pers-Jussy 18 listings
- Peyrins 18 listings
- Picherande 17 listings
- Piégros-la-Clastre 32 listings
- Pierrelatte 84 listings
- Planay 24 listings
- Plateau d'Hauteville 35 listings
- Plateau-des-Petites-Roches 60 listings
- Poisy 57 listings
- Polignac 26 listings
- Polminhac 17 listings
- Pommiers 23 listings
- Pont-de-Barret 22 listings
- Pont-de-Chéruy 20 listings
- Pont-de-Labeaume 29 listings
- Pont-de-Vaux 18 listings
- Pont-du-Château 40 listings
- Pontcharra 18 listings
- Pontgibaud 17 listings
- Porte des Pierres Dorées 27 listings
- Porte-de-Savoie 27 listings
- Portes-lès-Valence 22 listings
- Pradons 30 listings
- Pralognan-la-Vanoise 130 listings
- Praz-sur-Arly 273 listings
- Prévessin 34 listings
- Privas 65 listings
- Publier 95 listings
- Pugny-Chatenod 29 listings
- Pusignan 19 listings
- Puy-Saint-Martin 22 listings
Q
- Queige 37 listings
- Quincié-en-Beaujolais 22 listings
- Quintal 18 listings
R
- Réauville 31 listings
- Régnié-Durette 24 listings
- Reignier-Ésery 32 listings
- Rencurel 28 listings
- Retournac 21 listings
- Reyrieux 21 listings
- Ribes 23 listings
- Rillieux-la-Pape 49 listings
- Riom 100 listings
- Riom-ès-Montagnes 28 listings
- Riorges 37 listings
- Rive-de-Gier 30 listings
- Roanne 258 listings
- Roche-Saint-Secret-Béconne 22 listings
- Rochefort-Montagne 30 listings
- Rochegude 29 listings
- Rochemaure 39 listings
- Romagnat 42 listings
- Romans-sur-Isère 166 listings
- Rosières 80 listings
- Roussas 22 listings
- Roussillon 23 listings
- Royat 151 listings
- Rumilly 57 listings
- Ruoms 147 listings
S
- Sablières 22 listings
- Sablons 24 listings
- Saillans 48 listings
- Saint-Agnan-en-Vercors 49 listings
- Saint-Agrève 36 listings
- Saint-Alban-Auriolles 98 listings
- Saint-Alban-Leysse 34 listings
- Saint-Amant-Tallende 26 listings
- Saint-Andéol-de-Vals 18 listings
- Saint-André-de-Cruzières 35 listings
- Saint-Anthème 22 listings
- Saint-Antoine l'Abbaye 25 listings
- Saint-Bonnet-près-Orcival 19 listings
- Saint-Chamond 54 listings
- Saint-Colomban-des-Villards 25 listings
- Saint-Cyr-au-Mont-d'Or 48 listings
- Saint-Didier-au-Mont-d'Or 55 listings
- Saint-Diéry 37 listings
- Saint-Donat-sur-l'Herbasse 30 listings
- Saint-Égrève 35 listings
- Saint-Étienne 860 listings
- Saint-Étienne-de-Boulogne 18 listings
- Saint-Étienne-de-Crossey 17 listings
- Saint-Étienne-de-Fontbellon 42 listings
- Saint-Étienne-du-Bois 24 listings
- Saint-Eustache 21 listings
- Saint-Félicien 27 listings
- Saint-Ferréol-Trente-Pas 17 listings
- Saint-Flour 65 listings
- Saint-Fons 39 listings
- Saint-Fortunat-sur-Eyrieux 19 listings
- Saint-François-Longchamp 275 listings
- Saint-Front 22 listings
- Saint-Galmier 19 listings
- Saint-Genès-Champanelle 66 listings
- Saint-Genès-Champespe 21 listings
- Saint-Genis-Laval 80 listings
- Saint-Genis-les-Ollières 19 listings
- Saint-Genis-Pouilly 58 listings
- Saint-Genix-les-Villages 28 listings
- Saint-Germain-au-Mont-d'Or 21 listings
- Saint-Germain-Nuelles 18 listings
- Saint-Gérons 28 listings
- Saint-Gervais-les-Bains 1,292 listings
- Saint-Gervais-sur-Roubion 17 listings
- Saint-Gingolph 21 listings
- Saint-Honoré 17 listings
- Saint-Jacques-des-Blats 56 listings
- Saint-Jean-d'Arves 123 listings
- Saint-Jean-d'Arvey 30 listings
- Saint-Jean-d'Aulps 283 listings
- Saint-Jean-de-Maurienne 110 listings
- Saint-Jean-de-Muzols 28 listings
- Saint-Jean-de-Sixt 171 listings
- Saint-Jean-en-Royans 51 listings
- Saint-Jean-Saint-Maurice-sur-Loire 18 listings
- Saint-Jeoire 30 listings
- Saint-Jorioz 239 listings
- Saint-Julien-Chapteuil 29 listings
- Saint-Julien-du-Serre 25 listings
- Saint-Julien-en-Genevois 92 listings
- Saint-Julien-Mont-Denis 31 listings
- Saint-Just-d'Ardèche 25 listings
- Saint-Just-Saint-Rambert 33 listings
- Saint-Lattier 22 listings
- Saint-Laurent-de-Mure 18 listings
- Saint-Marcel-d'Ardèche 40 listings
- Saint-Marcel-lès-Sauzet 18 listings
- Saint-Marcel-lès-Valence 18 listings
- Saint-Marcellin 24 listings
- Saint-Martial 20 listings
- Saint-Martin-d'Ardèche 106 listings
- Saint-Martin-d'Hères 126 listings
- Saint-Martin-d'Uriage 103 listings
- Saint-Martin-en-Vercors 17 listings
- Saint-Martin-le-Vinoux 25 listings
- Saint-Maurice-d'Ardèche 23 listings
- Saint-Maurice-d'Ibie 18 listings
- Saint-Maurice-de-Gourdans 26 listings
- Saint-Maurice-sur-Eygues 20 listings
- Saint-Mélany 19 listings
- Saint-Michel-de-Maurienne 58 listings
- Saint-Montan 54 listings
- Saint-Nazaire-en-Royans 18 listings
- Saint-Nectaire 102 listings
- Saint-Nicolas-la-Chapelle 37 listings
- Saint-Ours 34 listings
- Saint-Pancrace 22 listings
- Saint-Paul-en-Chablais 40 listings
- Saint-Paul-le-Jeune 25 listings
- Saint-Paul-Trois-Châteaux 104 listings
- Saint-Péray 45 listings
- Saint-Pierre-Colamine 17 listings
- Saint-Pierre-d'Albigny 48 listings
- Saint-Pierre-d'Entremont 53 listings
- Saint-Pierre-de-Chartreuse 78 listings
- Saint-Pierre-de-Curtille 20 listings
- Saint-Pierre-en-Faucigny 33 listings
- Saint-Pierre-Saint-Jean 18 listings
- Saint-Pourçain-sur-Sioule 30 listings
- Saint-Priest 177 listings
- Saint-Priest-en-Jarez 23 listings
- Saint-Privat 26 listings
- Saint-Rambert-d'Albon 18 listings
- Saint-Remèze 44 listings
- Saint-Rémy-sur-Durolle 28 listings
- Saint-Restitut 44 listings
- Saint-Romain-en-Gal 18 listings
- Saint-Saturnin 24 listings
- Saint-Sauves-d'Auvergne 24 listings
- Saint-Sauveur-de-Cruzières 35 listings
- Saint-Sernin 22 listings
- Saint-Sigismond 19 listings
- Saint-Sorlin-d'Arves 237 listings
- Saint-Sylvestre 22 listings
- Saint-Symphorien-d'Ozon 18 listings
- Saint-Urcize 18 listings
- Saint-Vallier 22 listings
- Saint-Victor 20 listings
- Saint-Victor-la-Rivière 25 listings
- Saint-Vincent-de-Barrès 22 listings
- Sainte-Colombe 18 listings
- Sainte-Foy-lès-Lyon 69 listings
- Sainte-Foy-Tarentaise 140 listings
- Sainte-Hélène-du-Lac 19 listings
- Sainte-Jalle 30 listings
- Salavas 93 listings
- Salers 24 listings
- Salins-Fontaine 28 listings
- Sallanches 261 listings
- Samoëns 709 listings
- Sampzon 34 listings
- Sanilhac 35 listings
- Saoû 36 listings
- Sarcenas 24 listings
- Sassenage 26 listings
- Satillieu 22 listings
- Sault-Brénaz 22 listings
- Sauzet 47 listings
- Savasse 24 listings
- Sciez 76 listings
- Scionzier 30 listings
- Séez 76 listings
- Serraval 30 listings
- Servoz 66 listings
- Sevrier 270 listings
- Seyssel 38 listings
- Seyssinet-Pariset 24 listings
- Seyssins 20 listings
- Seytroux 18 listings
- Sillingy 19 listings
- Siran 18 listings
- Sixt-Fer-à-Cheval 62 listings
- Solignac-sur-Loire 18 listings
- Sonnaz 24 listings
- Souvigny 35 listings
- Suze-la-Rousse 45 listings
T
- Tain-l'Hermitage 51 listings
- Talloires 29 listings
- Talloires-Montmin 192 listings
- Taninges 191 listings
- Tassin-la-Demi-Lune 100 listings
- Taulignan 30 listings
- Tauves 18 listings
- Tence 27 listings
- Theys 35 listings
- Thiers 90 listings
- Thiézac 45 listings
- Thizy-les-Bourgs 33 listings
- Thoiry 38 listings
- Thollon-les-Mémises 204 listings
- Thônes 140 listings
- Thonon-les-Bains 417 listings
- Thueyts 22 listings
- Thyez 36 listings
- Tignes 1,174 listings
- Tignieu-Jameyzieu 31 listings
- Tournon-sur-Rhône 81 listings
- Tresserve 81 listings
- Trévignin 18 listings
- Trévoux 36 listings
- Tulette 45 listings
- Tullins 29 listings
U
- Ucel 41 listings
- Ugine 50 listings
- Upie 32 listings
- Usson-en-Forez 23 listings
V
- Vacheresse 39 listings
- Vagnas 55 listings
- Val d'Arcomie 18 listings
- Val d'Oingt 18 listings
- Val de Chaise 22 listings
- Val Thorens 63 listings
- Val-Cenis 339 listings
- Val-d'Isère 537 listings
- Valaurie 37 listings
- Valence 456 listings
- Valgorge 24 listings
- Vallées-d'Antraigues-Asperjoc 42 listings
- Valleiry 25 listings
- Valloire 402 listings
- Vallon-Pont-d'Arc 289 listings
- Vallorcine 84 listings
- Valmeinier 392 listings
- Vals-les-Bains 179 listings
- Vals-près-le-Puy 26 listings
- Valserhône 82 listings
- Varces-Allières-et-Risset 27 listings
- Vassieux-en-Vercors 34 listings
- Vaugneray 22 listings
- Vaujany 168 listings
- Vaulnaveys-le-Haut 50 listings
- Vaulx-en-Velin 111 listings
- Veauche 17 listings
- Veigy-Foncenex 27 listings
- Vendat 18 listings
- Vénissieux 196 listings
- Venterol 25 listings
- Verchaix 77 listings
- Vernaison 18 listings
- Vernoux-en-Vivarais 20 listings
- Vesseaux 44 listings
- Vétraz-Monthoux 41 listings
- Veyras 18 listings
- Veyrier-du-Lac 145 listings
- Vic-le-Comte 39 listings
- Vic-sur-Cère 57 listings
- Vichy 827 listings
- Vieille-Brioude 31 listings
- Vienne 259 listings
- Vif 27 listings
- Villages du Lac de Paladru 26 listings
- Villard-Bonnot 28 listings
- Villard-de-Lans 751 listings
- Villard-Reculas 67 listings
- Villard-sur-Doron 91 listings
- Villarembert 460 listings
- Villarodin-Bourget 117 listings
- Villaroger 32 listings
- Villars-les-Dombes 18 listings
- Villaz 24 listings
- Ville-la-Grand 46 listings
- Villefontaine 18 listings
- Villefranche-sur-Saône 168 listings
- Villeneuve-de-Berg 52 listings
- Villerest 26 listings
- Villette-d'Anthon 18 listings
- Villeurbanne 1,123 listings
- Villié-Morgon 26 listings
- Vinezac 42 listings
- Vinsobres 28 listings
- Viriat 29 listings
- Viry 21 listings
- Viuz-en-Sallaz 52 listings
- Viviers 58 listings
- Viviers-du-Lac 25 listings
- Vizille 38 listings
- Voglans 20 listings
- Vogüé 56 listings
- Voiron 95 listings
- Volvic 39 listings
- Voreppe 27 listings
- Vorey 25 listings
Y
- Yenne 28 listings
- Yssingeaux 40 listings
- Yvoire 28 listings
- Yzeure 22 listings