AirROI ranking · 202633 markets ranked
Best Places to Buy an Airbnb in Bavaria, Germany (2026)
Garmisch-Partenkirchen is the best place to buy an Airbnb in Bavaria in 2026, according to AirROI's ranking of 33 markets. Its listings averaged €26,100 in revenue over the 12 months to October 2026 and were booked on 44% of nights. It leads on the blend rather than on any one measure, placing 2nd of 33 for revenue per listing, 3rd of 33 for market size and 7th of 33 for occupancy. Bamberg and Grainau come next.
- Markets tracked
- 326
- Active Airbnb listings
- 20,700
- Avg. revenue per listing
- €15,700
- Occupancy rate
- 39%
- Avg. nightly rate
- €155
- Revenue change, typical market
- +10%
The short answer
Bavaria Airbnb Market at a Glance
Across Bavaria, the 20,700 active Airbnb listings tracked by AirROI, a short-term-rental data firm, averaged €15,700 over the same period. They were booked on 39% of nights at about €155 a night; the ranking covers the 33 markets with at least 100 active listings. Revenue per listing rose in 27 of the 33 ranked markets with a comparable year of data, by 10% in the typical one.
The ranking weighs revenue per listing most, then occupancy and market size, then how evenly income spreads across the year and how it changed on the year. It reflects rental performance, not purchase prices or local short-term rental rules. How the ranking works.
Where the top 10 Airbnb markets in Bavaria are
Each dot is one of the 326 markets AirROI tracks in Bavaria (2 outlying ones fall outside the map), sized by active listings and coloured by average revenue per listing. Select a number to jump to its profile.
Money figures on this page are in euros, converted from US dollars at €0.86 per US$, the typical rate from November 2025 to October 2026.
Top 10
The Top 10 Airbnb Markets in Bavaria
Each profile draws on the market's full AirROI report: how it earns, when in the year, who books and what sells. Monthly figures are averages per listing active in that month, so twelve of them add up to more than the annual average, which also counts listings that operated for only part of the year.
| # | Market | Avg. revenue | Occupancy |
|---|---|---|---|
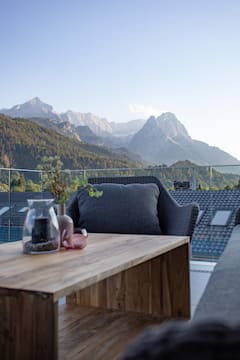 Garmisch-Partenkirchen High earnings · Large market | €26,100 | 44% | |
 Bamberg High occupancy · High earnings | €18,000 | 46% | |
 Grainau High earnings · High occupancy | €26,200 | 45% | |
| 4 | 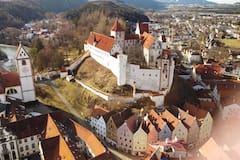 Füssen High earnings · High occupancy | €21,000 | 43% |
| 5 | 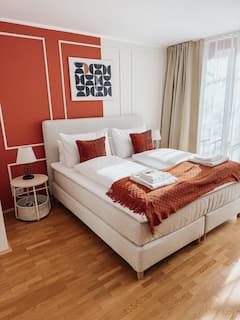 Munich Large market · High earnings | €18,600 | 38% |
| 6 |  Nuremberg Large market · Year-round demand | €15,900 | 41% |
| 7 |  Kempten (Allgäu) High occupancy · Growing revenue | €17,200 | 47% |
| 8 | 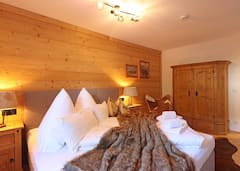 Oberstdorf Growing revenue · High earnings | €17,400 | 39% |
| 9 |  Würzburg Large market · High occupancy | €14,700 | 44% |
| 10 |  Pfronten Growing revenue · High occupancy | €15,900 | 42% |
1. Garmisch-Partenkirchen
Known for: High earnings · Large market
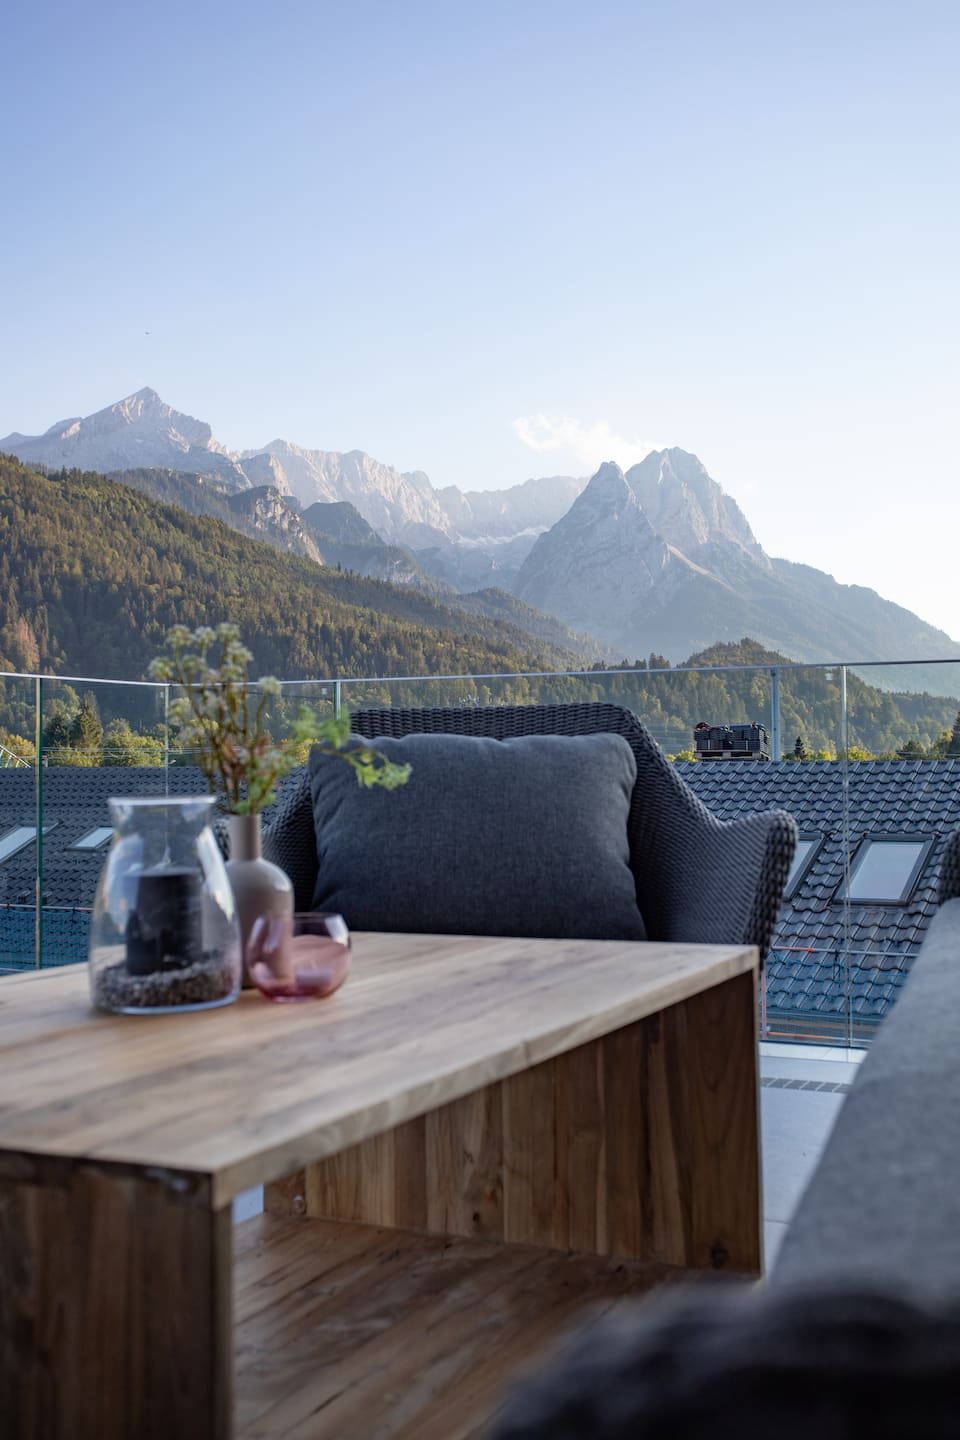


Top-earning Airbnb listings in Garmisch-Partenkirchen - Avg. revenue
- €26,100 +10% vs. last year
- Occupancy
- 44%
- Nightly rate
- €225
- Active listings
- 636
Where it places among the 33 ranked markets in Bavaria
- Revenue 2nd of 33
- Occupancy 7th of 33
- Market size 3rd of 33
- Year-round 20th of 33
- Growth 17th of 33
- How it earns
- Garmisch-Partenkirchen commands premium rates, about €225 a night, and still books 44% of nights, 5 points above the Bavaria average. That adds up to €26,100 per listing over the year, the second-highest of the 33 ranked markets. A typical listing takes in about €2,410 a month; the top quarter clear €3,700 or more. Revenue per listing rose 10% over the year, helped by nightly rates 12% higher, even as the number of listings grew 18%.
- When it earns
- Garmisch-Partenkirchen's season runs from June to September, peaking in July at about €4,390 per listing; November, the quietest month, brings in about €1,560.
- Who books
- Most guests come from abroad (54%), led by visitors from the United States, the United Kingdom and the Netherlands.
- Guest expectations
- Guests rate listings highly, 4.88 stars on average against 4.80 for the typical market in Bavaria, so reviews set a high bar.
- Who it suits
- It suits buyers who can furnish and price for a premium stay and can carry costs through a quiet November.
Revenue per listing by month
€4,390 €1,560- Median listing
- €2,410/mo
- Top 25% of listings
- €3,700+/mo
- Booked ahead
- 78 days
- Average stay
- 5 nights
- Guests from abroad
- 54%
- Most common home size
- 1 bedroom
Areas in the full report: Ludwigstraße · Zugspitze · Partnach Gorge
Full Garmisch-Partenkirchen Airbnb report2. Bamberg
Known for: High occupancy · High earnings
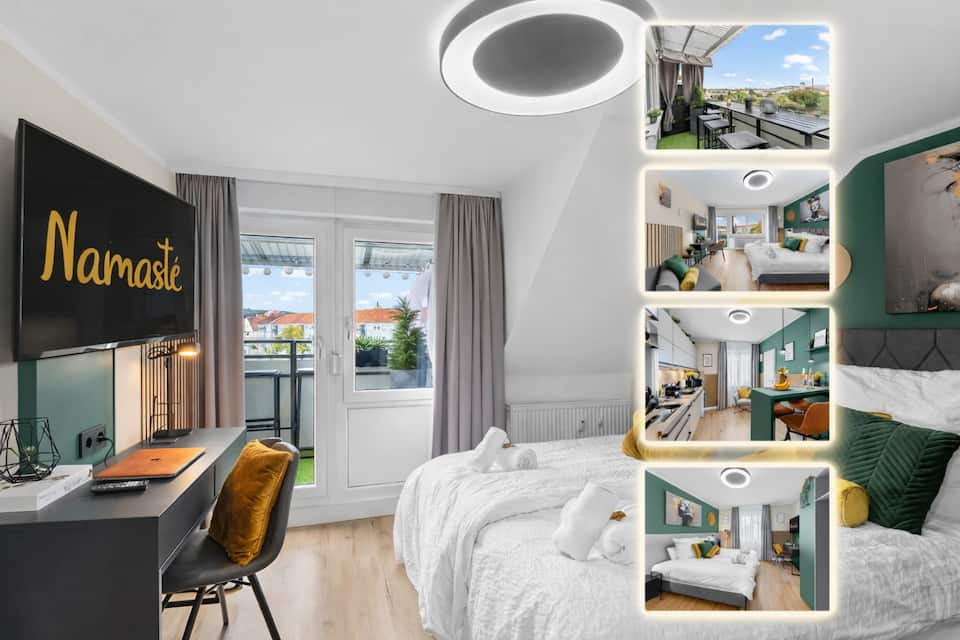


Top-earning Airbnb listings in Bamberg - Avg. revenue
- €18,000 +16% vs. last year
- Occupancy
- 46%
- Nightly rate
- €130
- Active listings
- 286
Where it places among the 33 ranked markets in Bavaria
- Revenue 8th of 33
- Occupancy 2nd of 33
- Market size 7th of 33
- Year-round 12th of 33
- Growth 10th of 33
- How it earns
- Bamberg earns on volume. Rates run below the Bavaria average at about €130 a night, but listings book 46% of nights. Listings averaged €18,000 in revenue over the year, the eighth-highest of the 33 ranked markets. In a typical month the median listing brings in about €1,580, and the best quarter clear €2,470. Revenue per listing rose 16% over the year, helped by nightly rates 28% higher, even as the number of listings grew 45%. With 286 listings it is a small market, so its averages can move more from year to year.
- When it earns
- Revenue in Bamberg concentrates from May to October: August earns about €2,320 per listing, about 2.3 times as much as January. Stays are shorter than in most of Bavaria, about 4 nights, so listings turn over often; guests book about 58 days ahead. Most hosts take one- or two-night bookings (79% of listings), more than in the typical market.
- Who books
- More than a quarter of guests (27%) travel from abroad, most often from the United States and the United Kingdom.
- What sells
- The most common entire home has 1 bedroom (59% of entire homes), and apartments and condos make up 88% of supply.
- Who it suits
- Best for buyers who would rather price for occupancy than for rate.
Revenue per listing by month
€2,320 €994- Median listing
- €1,580/mo
- Top 25% of listings
- €2,470+/mo
- Booked ahead
- 58 days
- Average stay
- 4 nights
- Most common home size
- 1 bedroom
- Superhosts
- 61%
3. Grainau
Known for: High earnings · High occupancy
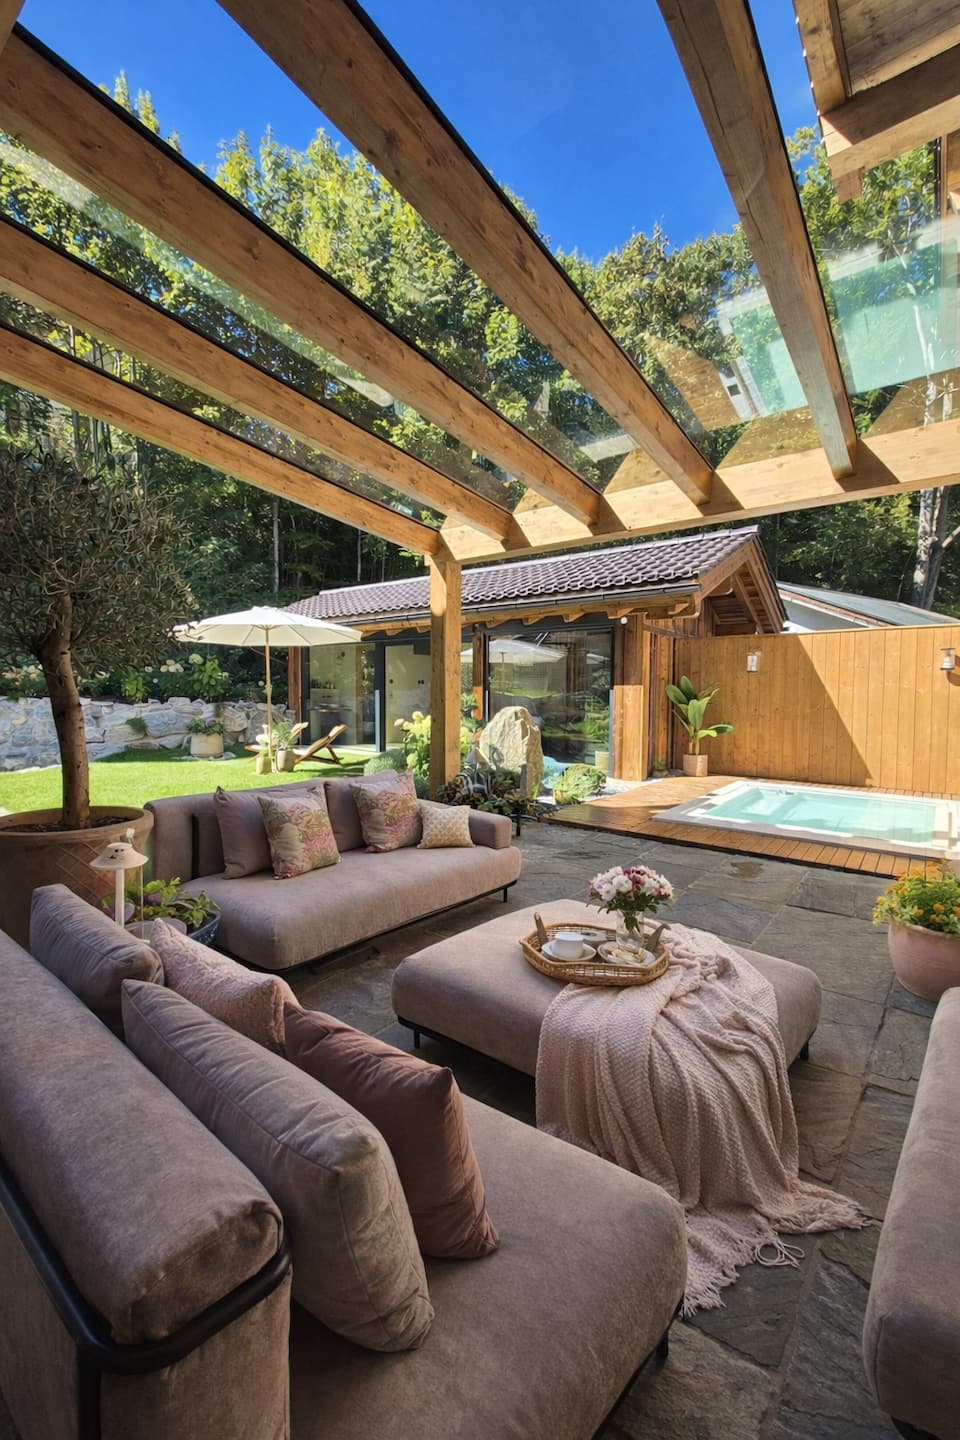

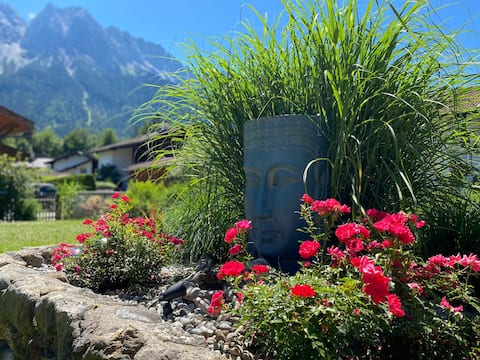
Top-earning Airbnb listings in Grainau - Avg. revenue
- €26,200 +22% vs. last year
- Occupancy
- 45%
- Nightly rate
- €255
- Active listings
- 140
Where it places among the 33 ranked markets in Bavaria
- Revenue 1st of 33
- Occupancy 3rd of 33
- Market size 19th of 33
- Year-round 17th of 33
- Growth 5th of 33
- How it earns
- Grainau earns on price and volume at once: guests pay about €255 a night, and listings are booked on 45% of nights, 6 points above the Bavaria average. Average revenue per listing came to €26,200, the highest of the 33 ranked markets. Month to month, the median listing earns about €2,350 and a top-quarter listing €3,610 or more. Revenue per listing rose 22% over the year, helped by nightly rates 12% higher, even as the number of listings grew 36%. Its 140 listings make it one of the smaller ranked markets, so its figures are less settled than those of larger ones.
- When it earns
- In Grainau, the months from June to September earn above the yearly average, led by August at about €4,120 per listing; November is the low point at about €1,540.
- Guest expectations
- Guests rate listings highly, 4.90 stars on average against 4.80 for the typical market in Bavaria, so reviews set a high bar.
- Who it suits
- A good fit for buyers who can furnish and price for a premium stay and can ride out a slow November.
Revenue per listing by month
€4,120 €1,540- Median listing
- €2,350/mo
- Top 25% of listings
- €3,610+/mo
- Booked ahead
- 81 days
- Average stay
- 5 nights
- Most common home size
- 1 bedroom
- Superhosts
- 66%
4. Füssen
Known for: High earnings · High occupancy
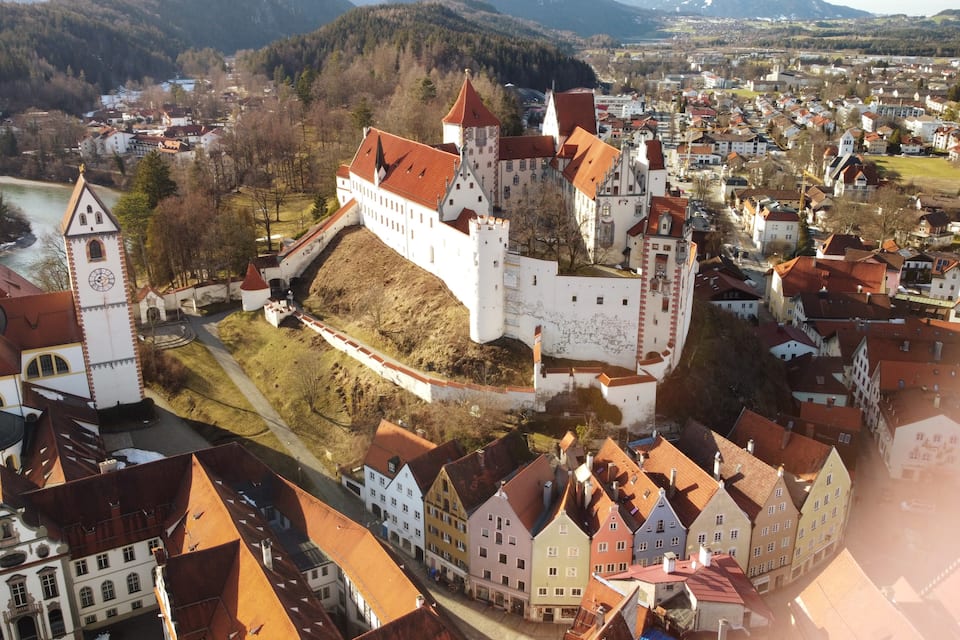


Top-earning Airbnb listings in Füssen - Avg. revenue
- €21,000 +14% vs. last year
- Occupancy
- 43%
- Nightly rate
- €170
- Active listings
- 161
Where it places among the 33 ranked markets in Bavaria
- Revenue 4th of 33
- Occupancy 8th of 33
- Market size 11th of 33
- Year-round 22nd of 33
- Growth 12th of 33
- How it earns
- Füssen fills more nights than most of Bavaria: 43% of them, the eighth-highest occupancy of the 33 ranked markets, at about €170 a night. That adds up to €21,000 per listing over the year, the fourth-highest of the 33 ranked markets. A typical listing takes in about €1,980 a month; the top quarter clear €2,930 or more. Revenue per listing rose 14% over the year, helped by nightly rates 21% higher. With 161 listings it is a small market, so its averages can move more from year to year.
- When it earns
- Füssen's season runs from May to October, peaking in July at about €3,610 per listing; January, the quietest month, brings in about €1,180.
- Who books
- Most guests come from abroad (58%), led by visitors from the United States, the United Kingdom and France.
- What sells
- One-bedroom homes lead the market (61% of entire homes), and apartments and condos make up 82% of supply.
- Who it suits
- It suits buyers who are prepared for thin bookings around January.
Revenue per listing by month
€3,610 €1,180- Median listing
- €1,980/mo
- Top 25% of listings
- €2,930+/mo
- Booked ahead
- 77 days
- Average stay
- 4 nights
- Guests from abroad
- 58%
- Most common home size
- 1 bedroom
5. Munich
Known for: Large market · High earnings
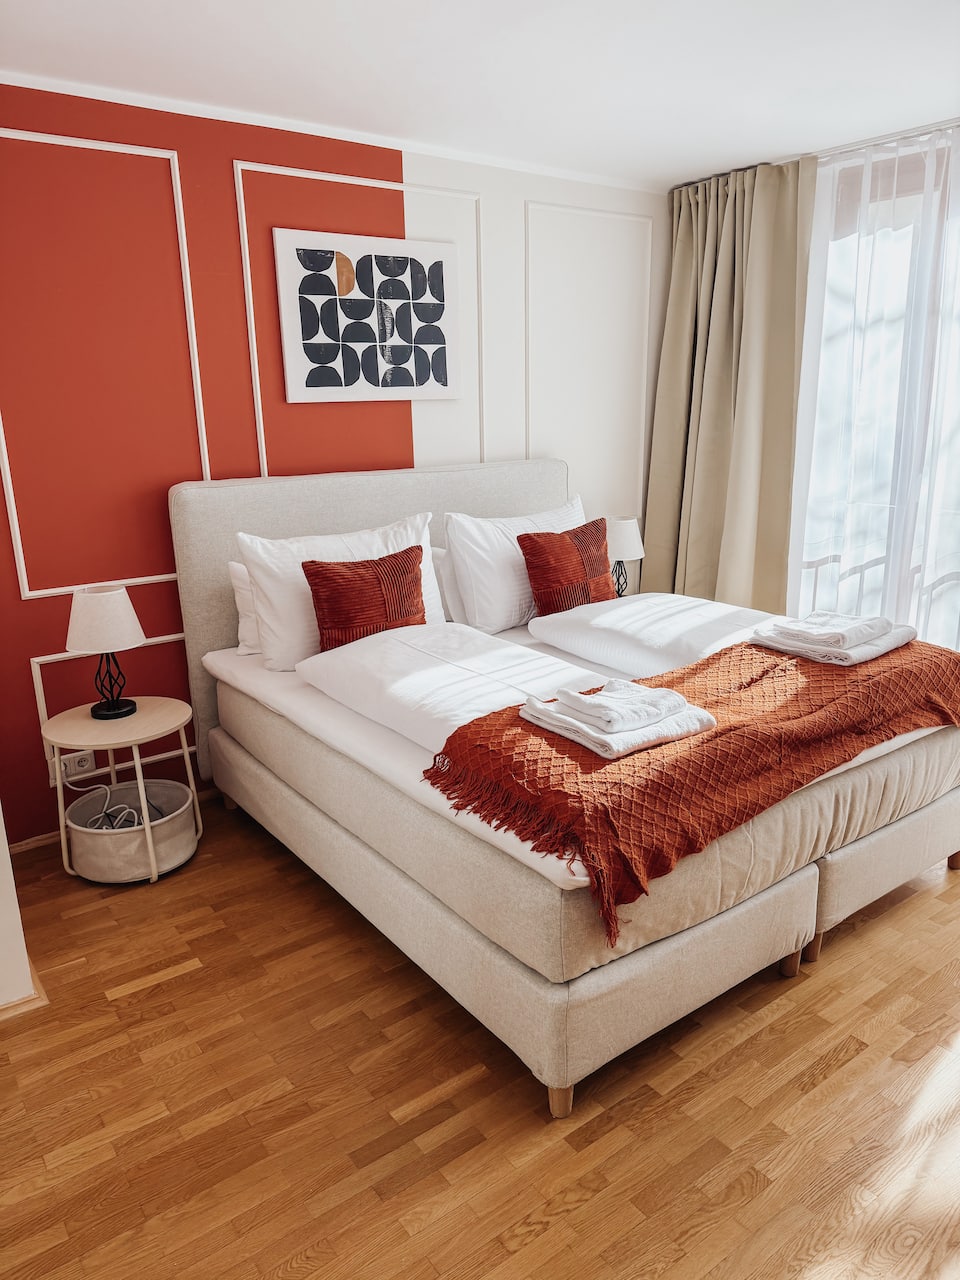

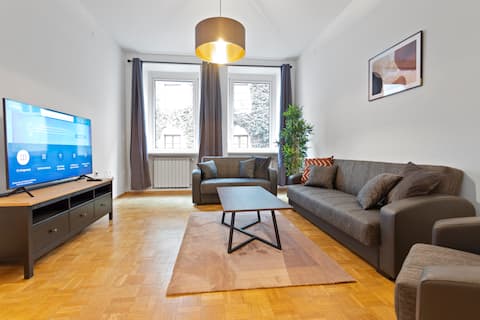
Top-earning Airbnb listings in Munich - Avg. revenue
- €18,600 +7% vs. last year
- Occupancy
- 38%
- Nightly rate
- €195
- Active listings
- 3,600
Where it places among the 33 ranked markets in Bavaria
- Revenue 7th of 33
- Occupancy 21st of 33
- Market size 1st of 33
- Year-round 14th of 33
- Growth 22nd of 33
- How it earns
- Munich is Bavaria's largest Airbnb market, with 3,600 active listings to price against. Listings averaged €18,600 in revenue over the year, the seventh-highest of the 33 ranked markets. The gap between listings is wide: a typical one takes in about €1,600 a month, while the top quarter clear €3,250 and the top 10% €5,960, so pricing and presentation count for more here than in most of Bavaria. Revenue per listing rose 7% over the year, helped by nightly rates 11% higher.
- When it earns
- Revenue in Munich concentrates from June to October: September earns about €3,980 per listing, about 2.4 times as much as February.
- Who books
- Most guests come from abroad (74%), led by visitors from the United States, the United Kingdom and France.
- What sells
- Private rooms are a large part of supply (34% of listings), which pulls the average nightly rate down.
- Who it suits
- Best for buyers who want to manage a property themselves.
Revenue per listing by month
€3,980 €1,650- Median listing
- €1,600/mo
- Top 25% of listings
- €3,250+/mo
- Booked ahead
- 60 days
- Average stay
- 6 nights
- Guests from abroad
- 74%
- Most common home size
- 1 bedroom
Areas in the full report: Altstadt-Lehel · Schwabing · Maxvorstadt
Full Munich Airbnb report6. Nuremberg
Known for: Large market · Year-round demand
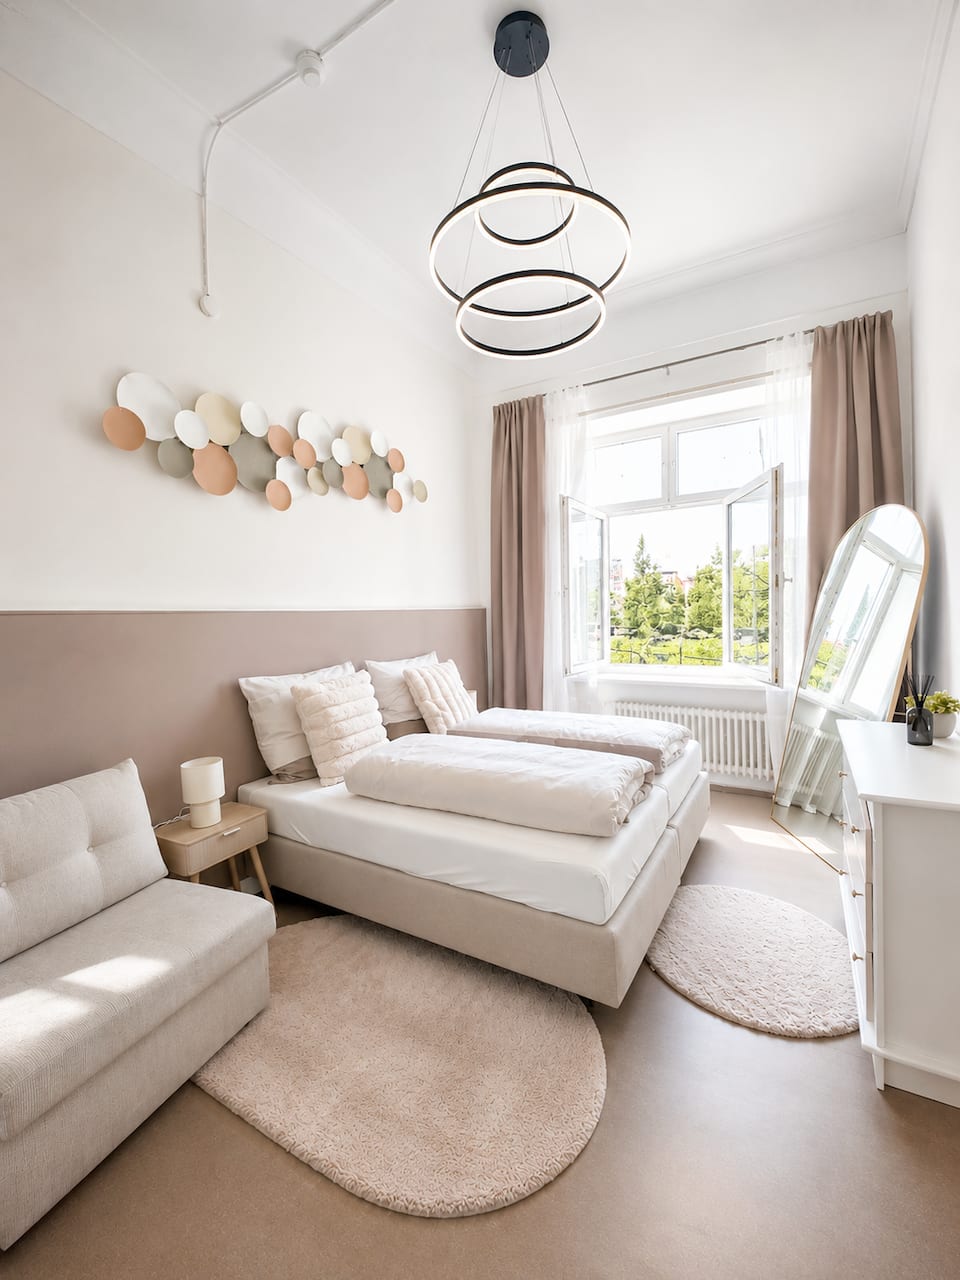
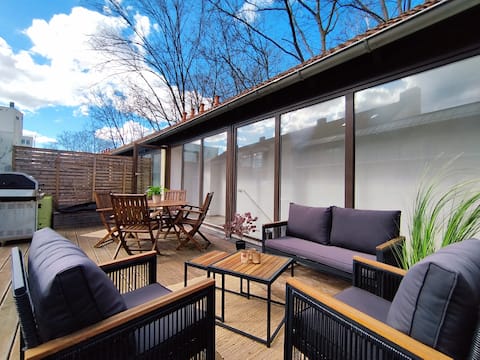
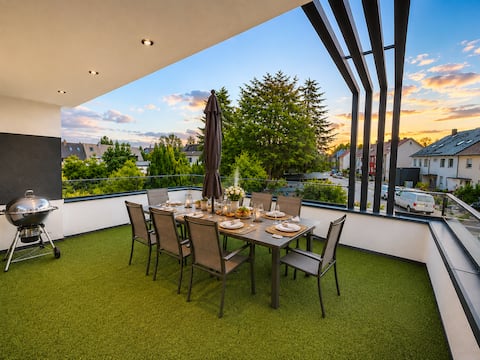
Top-earning Airbnb listings in Nuremberg - Avg. revenue
- €15,900 +9% vs. last year
- Occupancy
- 41%
- Nightly rate
- €135
- Active listings
- 1,170
Where it places among the 33 ranked markets in Bavaria
- Revenue 18th of 33
- Occupancy 15th of 33
- Market size 2nd of 33
- Year-round 2nd of 33
- Growth 18th of 33
- How it earns
- Nuremberg is Bavaria's second-largest Airbnb market, with 1,170 active listings to price against. Revenue per listing, €15,900, is close to the Bavaria average. Its place at #6 rests on market size (2nd of 33) and year-round demand (2nd of 33) rather than on revenue per listing. The gap between listings is wide: a typical one takes in about €1,340 a month, while the top quarter clear €2,480 and the top 10% €3,870, so pricing and presentation count for more here than in most of Bavaria. Revenue per listing rose 9% over the year, helped by nightly rates 12% higher, even as the number of listings grew 20%.
- When it earns
- Demand in Nuremberg holds up through the year: April, the slowest month, still brings in about two-thirds of December's revenue. Most hosts take one- or two-night bookings (82% of listings), more than in the typical market.
- Who books
- Most guests come from abroad (56%), led by visitors from the United States, the United Kingdom and France.
- What sells
- The most common entire home has 1 bedroom (53% of entire homes), and apartments and condos make up 81% of supply.
- Who it suits
- A good fit for buyers who want income that holds up all year and want to manage a property themselves.
Revenue per listing by month
€2,280 €1,490- Median listing
- €1,340/mo
- Top 25% of listings
- €2,480+/mo
- Booked ahead
- 61 days
- Average stay
- 5 nights
- Guests from abroad
- 56%
- Most common home size
- 1 bedroom
Areas in the full report: Old Town (Altstadt) · Sankt Johannis · Getúlio Vargas
Full Nuremberg Airbnb report7. Kempten (Allgäu)
Known for: High occupancy · Growing revenue
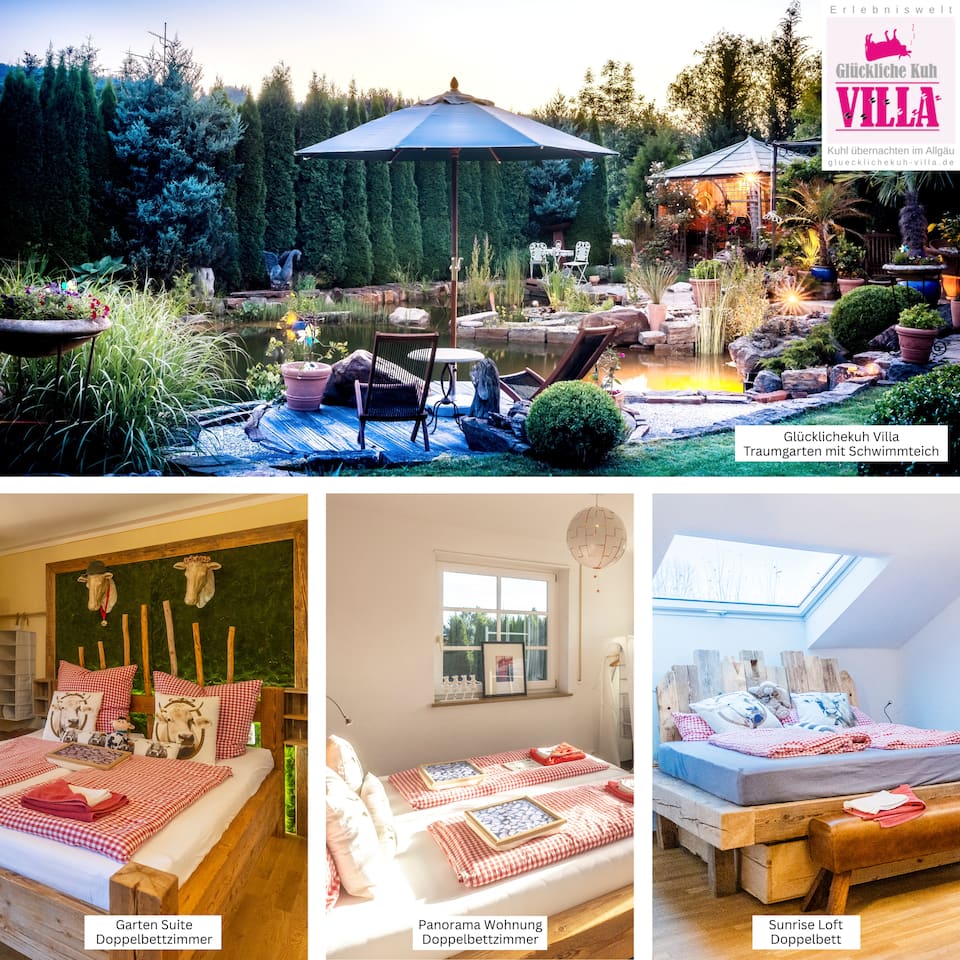

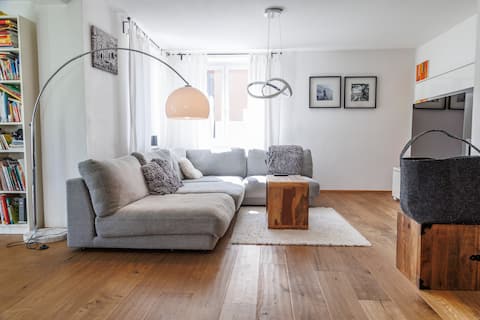
Top-earning Airbnb listings in Kempten (Allgäu) - Avg. revenue
- €17,200 +14% vs. last year
- Occupancy
- 47%
- Nightly rate
- €125
- Active listings
- 144
Where it places among the 33 ranked markets in Bavaria
- Revenue 14th of 33
- Occupancy 1st of 33
- Market size 18th of 33
- Year-round 15th of 33
- Growth 11th of 33
- How it earns
- Rates in Kempten (Allgäu) sit below the Bavaria average, at about €125 a night, but listings are booked on 47% of nights. That adds up to €17,200 per listing over the year, 9% above the Bavaria average. Its place at #7 rests on occupancy (1st of 33) rather than on revenue per listing. In a typical month the median listing brings in about €1,500, and the best quarter clear €2,390. Revenue per listing rose 14% over the year, helped by nightly rates 14% higher, even as the number of listings grew 26%. Its 144 listings make it one of the smaller ranked markets, so its figures are less settled than those of larger ones.
- When it earns
- In Kempten (Allgäu), the months from May to September earn above the yearly average, led by August at about €2,660 per listing; January is the low point at about €1,060. Guests book later than in most of Bavaria, about 46 days ahead against roughly 66 for the typical market in Bavaria; stays average 5 nights.
- Who books
- More than a quarter of guests (27%) travel from abroad, most often from the Netherlands and France.
- What sells
- One-bedroom homes lead the market (58% of entire homes), and apartments and condos make up 86% of supply.
- Who it suits
- It suits buyers who would rather price for occupancy than for rate and can carry costs through a quiet January.
Revenue per listing by month
€2,660 €1,060- Median listing
- €1,500/mo
- Top 25% of listings
- €2,390+/mo
- Booked ahead
- 46 days
- Average stay
- 5 nights
- Most common home size
- 1 bedroom
- Superhosts
- 56%
8. Oberstdorf
Known for: Growing revenue · High earnings
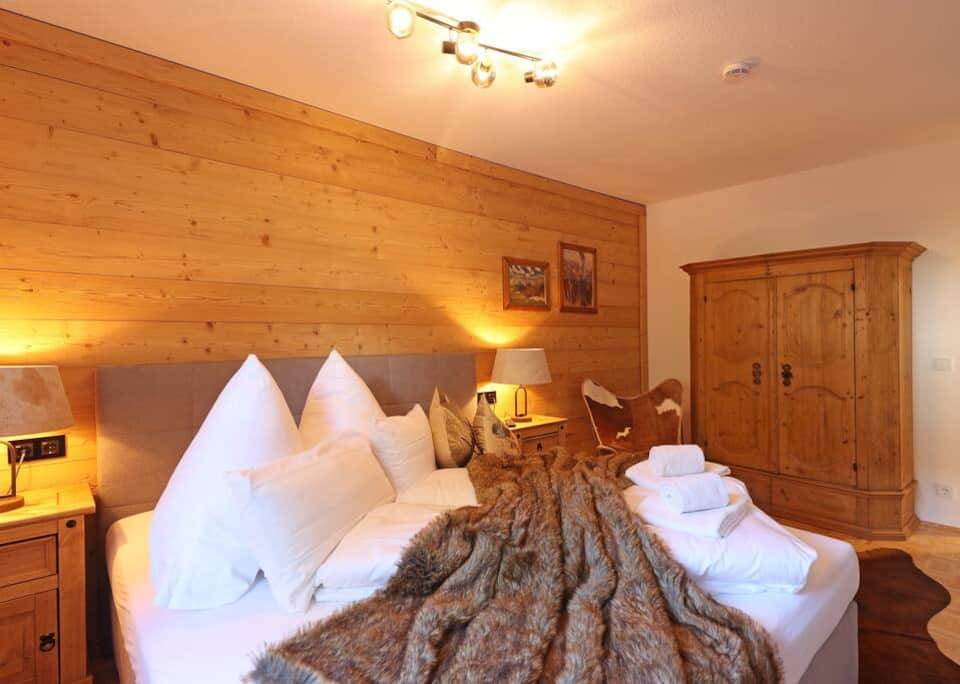
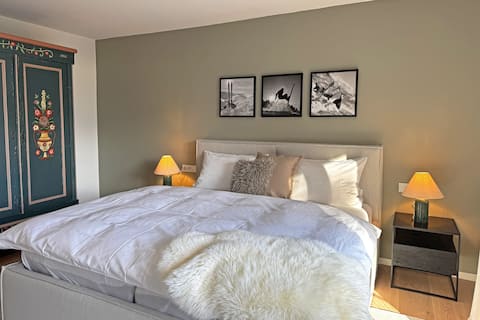

Top-earning Airbnb listings in Oberstdorf - Avg. revenue
- €17,400 +23% vs. last year
- Occupancy
- 39%
- Nightly rate
- €190
- Active listings
- 263
Where it places among the 33 ranked markets in Bavaria
- Revenue 12th of 33
- Occupancy 17th of 33
- Market size 8th of 33
- Year-round 23rd of 33
- Growth 4th of 33
- How it earns
- Oberstdorf listings charge about €190 a night, 21% above the Bavaria average, and are booked on 39% of nights. Listings averaged €17,400 in revenue over the year, 10% above the Bavaria average. Month to month, the median listing earns about €1,920 and a top-quarter listing €2,940 or more. Revenue per listing rose 23% over the year, helped by nightly rates 8% higher, even as the number of listings grew 26%. With 263 listings it is a small market, so its averages can move more from year to year.
- When it earns
- Oberstdorf's season runs from June to September, peaking in August at about €3,350 per listing; November, the quietest month, brings in about €1,090. Guests book early, about 94 days ahead against roughly 66 for the typical market in Bavaria, and stay about 5 nights.
- The competition
- Professional managers run 55% of listings, against about 17% in the typical market in Bavaria, and the largest operator runs 21 listings, so new hosts compete with polished operations.
- Who books
- Most guests are domestic (76%), and the Netherlands and the United States send the most visitors from abroad.
- Who it suits
- Best for buyers who plan to use a professional manager or run a polished operation and can ride out a slow November.
Revenue per listing by month
€3,350 €1,090- Median listing
- €1,920/mo
- Top 25% of listings
- €2,940+/mo
- Booked ahead
- 94 days
- Average stay
- 5 nights
- Guests from abroad
- 24%
- Most common home size
- 1 bedroom
9. Würzburg
Known for: Large market · High occupancy
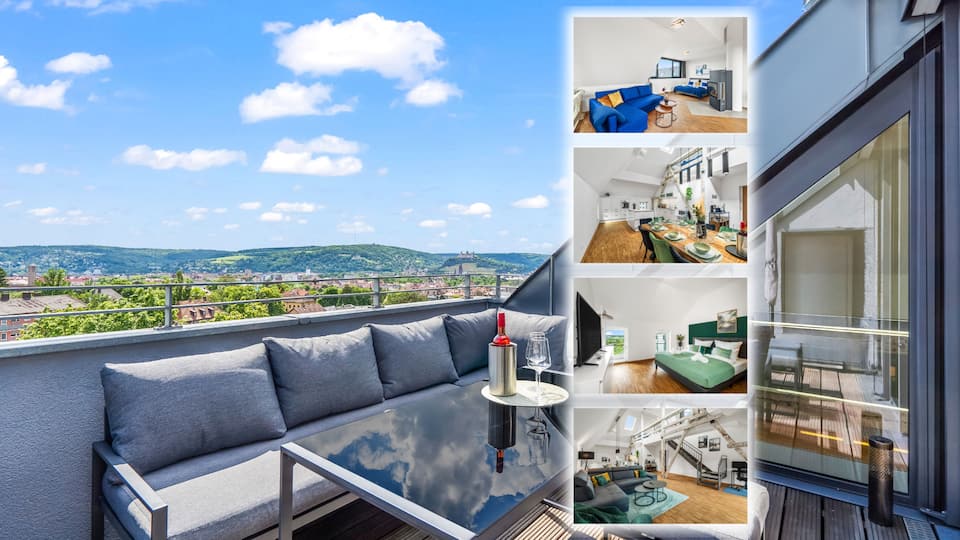

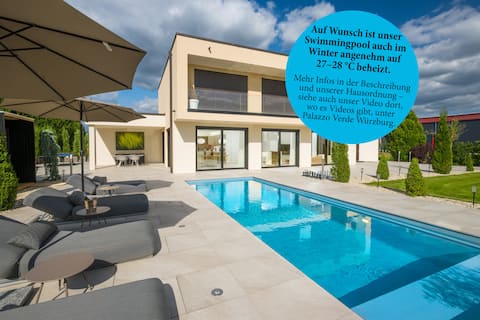
Top-earning Airbnb listings in Würzburg - Avg. revenue
- €14,700 −2% vs. last year
- Occupancy
- 44%
- Nightly rate
- €115
- Active listings
- 416
Where it places among the 33 ranked markets in Bavaria
- Revenue 20th of 33
- Occupancy 6th of 33
- Market size 5th of 33
- Year-round 8th of 33
- Growth 28th of 33
- How it earns
- Würzburg earns on volume. Rates run below the Bavaria average at about €115 a night, but listings book 44% of nights. Moderate rates keep revenue per listing at €14,700, 6% below the Bavaria average. Its place at #9 rests on market size (5th of 33) and occupancy (6th of 33) rather than on revenue per listing. A typical listing takes in about €1,380 a month; the top quarter clear €2,170 or more.
- When it earns
- Revenue in Würzburg concentrates from May to October: July earns about €2,080 per listing, about twice as much as January. Most hosts take one- or two-night bookings (74% of listings), more than in the typical market.
- Guest expectations
- Average ratings (4.68 stars) trail the typical market in Bavaria (4.80), which leaves room for a well-run listing to stand out.
- Who books
- Most guests are domestic (78%), and the United States and the Netherlands send the most visitors from abroad.
- Who it suits
- A good fit for buyers who would rather price for occupancy than for rate and want to manage a property themselves.
Revenue per listing by month
€2,080 €1,080- Median listing
- €1,380/mo
- Top 25% of listings
- €2,170+/mo
- Booked ahead
- 58 days
- Average stay
- 5 nights
- Guests from abroad
- 22%
- Most common home size
- 1 bedroom
Areas in the full report: Old Town (Altstadt) · Sanderau · Zellerau
Full Würzburg Airbnb report10. Pfronten
Known for: Growing revenue · High occupancy
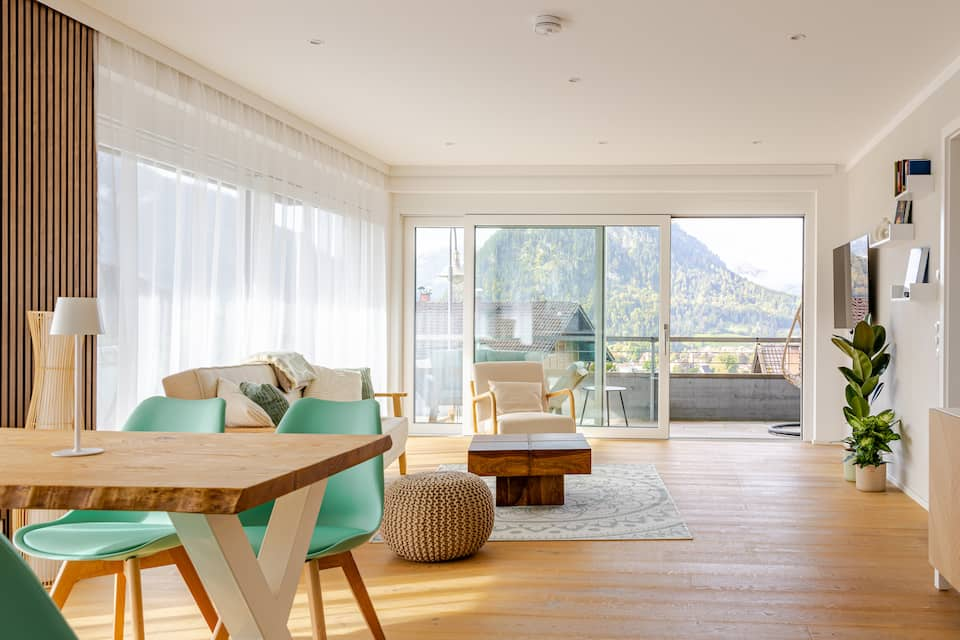
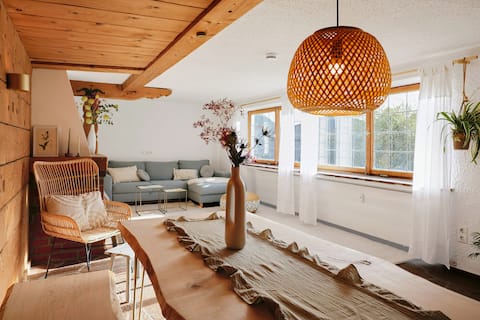
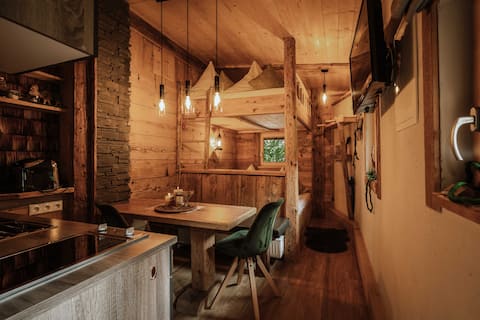
Top-earning Airbnb listings in Pfronten - Avg. revenue
- €15,900 +19% vs. last year
- Occupancy
- 42%
- Nightly rate
- €150
- Active listings
- 155
Where it places among the 33 ranked markets in Bavaria
- Revenue 16th of 33
- Occupancy 12th of 33
- Market size 13th of 33
- Year-round 25th of 33
- Growth 8th of 33
- How it earns
- Listings in Pfronten are booked on 42% of nights, 3 points above the Bavaria average, at about €150 a night. Revenue per listing, €15,900, is close to the Bavaria average. Its place at #10 rests on revenue growth (8th of 33) rather than on revenue per listing. In a typical month the median listing brings in about €1,480, and the best quarter clear €2,360. Revenue per listing rose 19% over the year, helped by nightly rates 20% higher, even as the number of listings grew 27%. Its 155 listings make it one of the smaller ranked markets, so its figures are less settled than those of larger ones.
- When it earns
- In Pfronten, the months from June to September earn above the yearly average, led by August at about €2,840 per listing; November is the low point at about €881. Bookings arrive well in advance, about 84 days before check-in, so much of a season's calendar fills early; stays average 5 nights.
- The competition
- Professional managers run 37% of listings, against about 17% in the typical market in Bavaria, and the largest operator runs 46 listings, so new hosts compete with polished operations.
- Guest expectations
- Guests rate listings highly, 4.86 stars on average against 4.80 for the typical market in Bavaria, so reviews set a high bar.
- Who it suits
- It suits buyers who are prepared for thin bookings around November and plan to use a professional manager or run a polished operation.
Revenue per listing by month
€2,840 €881- Median listing
- €1,480/mo
- Top 25% of listings
- €2,360+/mo
- Booked ahead
- 84 days
- Average stay
- 5 nights
- Most common home size
- 1 bedroom
- Superhosts
- 73%
Full ranking
How All 33 Ranked Markets in Bavaria Compare
The overall ranking with the five measures behind it. "Slow month" is a market's weakest month of revenue as a share of its best, so a higher figure means steadier income. Select a column heading to re-sort.
| Garmisch-Partenkirchen High earnings, large market | €26,078 | 44% | €226 | 35% | +10% | 636 | |
| Bamberg High occupancy, high earnings | €18,017 | 46% | €128 | 43% | +16% | 286 | |
| Grainau High earnings, high occupancy | €26,202 | 45% | €255 | 37% | +22% | 140 | |
| 4 | Füssen High earnings, high occupancy | €20,971 | 43% | €168 | 33% | +14% | 161 |
| 5 | Munich Large market, high earnings | €18,648 | 38% | €193 | 41% | +7% | 3,603 |
| 6 | Nuremberg Large market, year-round demand | €15,855 | 41% | €137 | 65% | +9% | 1,169 |
| 7 | Kempten (Allgäu) High occupancy, growing revenue | €17,162 | 47% | €123 | 40% | +14% | 144 |
| 8 | Oberstdorf Growing revenue, high earnings | €17,374 | 39% | €188 | 32% | +23% | 263 |
| 9 | Würzburg Large market, high occupancy | €14,742 | 44% | €117 | 52% | −2% | 416 |
| 10 | Pfronten Growing revenue, high occupancy | €15,940 | 42% | €152 | 31% | +19% | 155 |
| 11 | Schönau am Königssee Growing revenue, high earnings | €17,675 | 40% | €194 | 29% | +20% | 137 |
| 12 | Regensburg Year-round demand, high occupancy | €13,056 | 42% | €111 | 53% | −7% | 289 |
| 13 | Augsburg Large market, year-round demand | €12,796 | 42% | €111 | 56% | −11% | 441 |
| 14 | Mittenwald Growing revenue, high earnings | €17,223 | 42% | €209 | 35% | +18% | 119 |
| 15 | Ingolstadt Year-round demand, high occupancy | €12,686 | 43% | €108 | 59% | +8% | 147 |
| 16 | Bad Reichenhall High occupancy | €15,911 | 44% | €127 | 31% | +8% | 137 |
| 17 | Schliersee High earnings | €24,251 | 39% | €218 | 31% | −4% | 109 |
| 18 | Dießen am Ammersee High earnings, high occupancy | €19,437 | 42% | €182 | 30% | −18% | 103 |
| 19 | Erlangen Growing revenue, year-round demand | €10,767 | 44% | €91 | 59% | +30% | 114 |
| 20 | Berchtesgaden High earnings | €17,530 | 38% | €193 | 28% | +5% | 145 |
| 21 | Reit im Winkl High earnings | €17,471 | 33% | €210 | 39% | +11% | 119 |
| 22 | Oberammergau | €16,441 | 38% | €171 | 36% | +5% | 132 |
| 23 | Scheidegg High earnings | €18,874 | 35% | €190 | 29% | +8% | 108 |
| 24 | Inzell Growing revenue | €14,125 | 34% | €196 | 37% | +33% | 120 |
| 25 | Bayreuth | €13,079 | 39% | €132 | 28% | +4% | 211 |
| 26 | Fürth Year-round demand | €9,224 | 35% | €112 | 75% | +10% | 158 |
| 27 | Oberstaufen Growing revenue | €12,100 | 31% | €161 | 45% | +20% | 148 |
| 28 | Memmingen Year-round demand | €12,677 | 39% | €124 | 56% | +6% | 108 |
| 29 | Coburg | €11,153 | 35% | €116 | 45% | +12% | 133 |
| 30 | Ruhpolding Growing revenue | €15,348 | 38% | €167 | 30% | +12% | 104 |
| 31 | Lindau (Bodensee) | €12,111 | 36% | €163 | 32% | +4% | 151 |
| 32 | Passau | €11,051 | 34% | €128 | 44% | −3% | 202 |
| 33 | Sankt Englmar Growing revenue | €11,056 | 32% | €134 | 43% | +28% | 118 |
By measure
Bavaria Airbnb Markets Ranked by Revenue, Nightly Rate and Occupancy
The overall ranking balances five measures. These lists take one at a time, for buyers who care most about income, pricing power, bookings, a steady calendar, momentum or market size.
Highest-earning Airbnb markets in Bavaria
Average annual revenue per active listing over the past 12 months. Markets with at least 200 listings.
| # | Market | Revenue |
|---|---|---|
| Garmisch-Partenkirchen #1 overall | €26,100 | |
| Munich #5 overall | €18,600 | |
| Bamberg #2 overall | €18,000 | |
| 4 | Oberstdorf #8 overall | €17,400 |
| 5 | Nuremberg #6 overall | €15,900 |
| 6 | Würzburg #9 overall | €14,700 |
| 7 | Bayreuth #25 overall | €13,100 |
| 8 | Regensburg #12 overall | €13,100 |
| 9 | Augsburg #13 overall | €12,800 |
| 10 | Passau #32 overall | €11,100 |
Most expensive Airbnb markets in Bavaria by nightly rate
Average rate per booked night. A high rate earns most where occupancy holds up too. Markets with at least 200 listings.
| # | Market | Nightly |
|---|---|---|
| Garmisch-Partenkirchen #1 overall | €225 | |
| Munich #5 overall | €195 | |
| Oberstdorf #8 overall | €190 | |
| 4 | Nuremberg #6 overall | €135 |
| 5 | Bayreuth #25 overall | €130 |
| 6 | Bamberg #2 overall | €130 |
| 7 | Passau #32 overall | €130 |
| 8 | Würzburg #9 overall | €115 |
| 9 | Augsburg #13 overall | €110 |
| 10 | Regensburg #12 overall | €110 |
Highest-occupancy Airbnb markets in Bavaria
Share of available nights booked over the past 12 months. Markets with at least 200 listings.
| # | Market | Occupancy |
|---|---|---|
| Bamberg #2 overall | 46% | |
| Würzburg #9 overall | 44% | |
| Garmisch-Partenkirchen #1 overall | 44% | |
| 4 | Regensburg #12 overall | 42% |
| 5 | Augsburg #13 overall | 42% |
| 6 | Nuremberg #6 overall | 41% |
| 7 | Oberstdorf #8 overall | 39% |
| 8 | Bayreuth #25 overall | 39% |
| 9 | Munich #5 overall | 38% |
| 10 | Passau #32 overall | 34% |
Most year-round Airbnb markets in Bavaria
Revenue in the slowest month as a share of the best month, so a higher figure means steadier income. Markets with at least 200 listings.
| # | Market | Slow month |
|---|---|---|
| Nuremberg #6 overall | 65% | |
| Augsburg #13 overall | 56% | |
| Regensburg #12 overall | 53% | |
| 4 | Würzburg #9 overall | 52% |
| 5 | Passau #32 overall | 44% |
| 6 | Bamberg #2 overall | 43% |
| 7 | Munich #5 overall | 41% |
| 8 | Garmisch-Partenkirchen #1 overall | 35% |
| 9 | Oberstdorf #8 overall | 32% |
| 10 | Bayreuth #25 overall | 28% |
Fastest-growing Airbnb markets in Bavaria
Change in revenue per listing from the year before, among markets where it rose. Markets with at least 200 listings.
| # | Market | Change |
|---|---|---|
| Oberstdorf #8 overall | +23% | |
| Bamberg #2 overall | +16% | |
| Garmisch-Partenkirchen #1 overall | +10% | |
| 4 | Nuremberg #6 overall | +9% |
| 5 | Munich #5 overall | +7% |
| 6 | Bayreuth #25 overall | +4% |
Largest Airbnb markets in Bavaria
Active listings. Bigger markets have more comparable rentals to price against and more buyers at resale.
| # | Market | Listings |
|---|---|---|
| Munich #5 overall | 3,600 | |
| Nuremberg #6 overall | 1,170 | |
| Garmisch-Partenkirchen #1 overall | 636 | |
| 4 | Augsburg #13 overall | 441 |
| 5 | Würzburg #9 overall | 416 |
| 6 | Regensburg #12 overall | 289 |
| 7 | Bamberg #2 overall | 286 |
| 8 | Oberstdorf #8 overall | 263 |
| 9 | Bayreuth #25 overall | 211 |
| 10 | Passau #32 overall | 202 |
| 11 | Füssen #4 overall | 161 |
| 12 | Fürth #26 overall | 158 |
| 13 | Pfronten #10 overall | 155 |
| 14 | Lindau (Bodensee) #31 overall | 151 |
| 15 | Oberstaufen #27 overall | 148 |
| 16 | Ingolstadt #15 overall | 147 |
| 17 | Berchtesgaden #20 overall | 145 |
| 18 | Kempten (Allgäu) #7 overall | 144 |
| 19 | Grainau #3 overall | 140 |
| 20 | Schönau am Königssee #11 overall | 137 |
| 21 | Bad Reichenhall #16 overall | 137 |
| 22 | Coburg #29 overall | 133 |
| 23 | Oberammergau #22 overall | 132 |
| 24 | Inzell #24 overall | 120 |
| 25 | Mittenwald #14 overall | 119 |
Seasonality
When Airbnbs in Bavaria Earn the Most
August is the best month for more than half of ranked markets in Bavaria. November is the most common slowest month, in 14 markets.
September earns about 1.8 times what January does
Average revenue per listing across the 33 ranked markets in Bavaria, by month
| Month | Avg. revenue per listing | Best month for | Highest-ranked examples |
|---|---|---|---|
| January | €1,500 | – | – |
| February | €1,580 | – | – |
| March | €1,720 | – | – |
| April | €1,860 | – | – |
| May | €2,100 | 1 market | Erlangen |
| June | €2,330 | – | – |
| July | €2,660 | 12 markets | Garmisch-Partenkirchen, Füssen, Würzburg |
| August | €2,710 | 17 markets | Bamberg, Grainau, Kempten (Allgäu) |
| September | €2,760 | 2 markets | Munich, Augsburg |
| October | €2,100 | – | – |
| November | €1,560 | – | – |
| December | €2,080 | 1 market | Nuremberg |
Average revenue is per listing across the ranked markets, the line in the chart above. "Best month for" counts the ranked markets whose own revenue peaks in that month.
Management
Who Manages Airbnbs in Bavaria?
AirROI ranks the 50 largest of the 106 companies that run 5 or more Airbnb listings in Bavaria, by listings, guest rating and growth; companies run 15% of its listings.
Method
How the Ranking Works
The ranking covers the 33 markets in Bavaria with at least 100 active Airbnb listings and data through October 2026. Each market is compared with the others on five measures, and markets are ordered by a weighted blend of where they place on each:
- Revenue per listing (35%): average revenue an active listing earned over the past 12 months.
- Occupancy (20%): share of available nights that were booked.
- Market size (20%): active listings. Bigger markets offer more comparable rentals to price against and more buyers when you sell.
- Year-round demand (15%): revenue in the slowest month as a share of the best month. The latest month is left out when its bookings look incomplete.
- Growth (10%): change in revenue per listing from the year before. Markets whose boundaries changed between years are scored in the middle.
Left out: 73 markets whose data predate the latest refresh and one town listed a second time under another spelling. The score measures how rentals perform. It does not include purchase prices, financing, operating costs or local short-term rental rules, which vary by address and should be checked before buying. Figures are in euros and match each market's own report; see the data methodology for how listings are tracked.
To check one property before buying, run its address and size through the Airbnb calculator for a revenue, occupancy and nightly-rate range from comparable listings.
FAQ
Frequently Asked Questions About Airbnb Investing in Bavaria
What is the best place to buy an Airbnb in Bavaria?
Garmisch-Partenkirchen ranks first of the 33 markets in Bavaria in AirROI's ranking, with €26,100 in average revenue per listing and 44% occupancy. Bamberg and Grainau follow. The ranking weighs revenue, occupancy, market size, seasonality and growth; it leaves out purchase prices.
What are the most profitable Airbnb locations in Bavaria?
By revenue per listing, among markets with at least 200 listings, Garmisch-Partenkirchen leads at €26,100 a year, ahead of Munich at €18,600. Profit also depends on what a property costs to buy and run, which varies far more between markets than revenue does.
How much does an Airbnb make in Bavaria?
The average active listing in Bavaria earned €15,700 over the 12 months to October 2026, at 39% occupancy. Across the ranked markets, the middle half averaged between €12,700 and €17,700 per listing. Averages include listings that operated for only part of the year, so a listing rented all year typically earns more.
What is a good Airbnb occupancy rate in Bavaria?
The average listing in Bavaria was booked on 39% of available nights over the past 12 months. Half of the ranked markets fall between 36% and 43%, so a market above about 43% sits in the top quarter. Occupancy is only half the picture: a market with lower occupancy can still earn more if its nightly rates are higher.
Where is Airbnb demand highest in Bavaria?
Among ranked markets with at least 200 listings, Bamberg has the highest occupancy, with 46% of available nights booked, followed by Würzburg at 44%. Its listings average about €130 a night and €18,000 a year.
Where are Airbnb nightly rates highest in Bavaria?
Among ranked markets with at least 200 listings, Garmisch-Partenkirchen has the highest average nightly rate, about €225, followed by Munich at €195. Regensburg is the least expensive, at about €110. The average booked night in Bavaria costs about €155.
What is the best month for Airbnb in Bavaria?
August is the highest-earning month for 17 of the 33 ranked markets, followed by July (12). November is the most common slowest month, in 14 of the 33 markets. Each market's report shows its own month-by-month revenue, occupancy and rates.
Which Airbnb markets in Bavaria earn the most evenly through the year?
Among ranked markets with at least 200 listings, Nuremberg has the steadiest income: its slowest month, April, still earns about two-thirds of its best. Augsburg follows, at 56%. Steadier markets are easier to budget for, though they do not always earn the most per listing.
Which Airbnb markets are growing fastest in Bavaria?
Among ranked markets with at least 200 listings, revenue per listing grew most in Oberstdorf, up 23% on the year before, and in Bamberg, up 16%. A single strong year can reflect events or new supply, so it is worth checking a market's monthly trend before relying on it.
Is Airbnb still profitable in Bavaria in 2026?
Revenue per listing grew in 27 of the 33 ranked markets with a comparable year of data; in the typical market it rose 10%. Whether a given property profits depends on its purchase price, financing and running costs.
How many Airbnb listings are there in Bavaria?
AirROI tracked 20,700 active Airbnb listings in Bavaria over the 12 months to October 2026, across 326 markets. The largest ranked market is Munich, with 3,600 listings, followed by Nuremberg with 1,170.
Directory
All 326 Airbnb Markets in Bavaria
Every Bavaria city with an AirROI Airbnb market report, A–Z, with its active listing count.
A
- Aach im Allgäu 16 listings
- Absberg 23 listings
- Ainring 29 listings
- Altdorf 26 listings
- Altdorf bei Nürnberg 25 listings
- Altusried 32 listings
- Alzenau 26 listings
- Amberg 64 listings
- Anger 41 listings
- Ansbach 47 listings
- Arnbruck 22 listings
- Arrach 33 listings
- Aschaffenburg 86 listings
- Aschau im Chiemgau 60 listings
- Aschheim 19 listings
- Augsburg 441 listings
B
- Bad Abbach 23 listings
- Bad Aibling 42 listings
- Bad Bayersoien 31 listings
- Bad Birnbach 39 listings
- Bad Endorf 33 listings
- Bad Feilnbach 26 listings
- Bad Füssing 70 listings
- Bad Griesbach i.Rottal 39 listings
- Bad Grönenbach 19 listings
- Bad Hindelang 42 listings
- Bad Kissingen 70 listings
- Bad Kohlgrub 62 listings
- Bad Oberdorf 20 listings
- Bad Reichenhall 137 listings
- Bad Rodach 18 listings
- Bad Staffelstein 39 listings
- Bad Steben 22 listings
- Bad Tölz 45 listings
- Bad Wiessee 87 listings
- Bad Windsheim 27 listings
- Bad Wörishofen 76 listings
- Bamberg 286 listings
- Bayerisch Eisenstein 41 listings
- Bayerisch Gmain 24 listings
- Bayreuth 211 listings
- Bayrischzell 52 listings
- Beilngries 45 listings
- Berchtesgaden 145 listings
- Berg 44 listings
- Bernau am Chiemsee 84 listings
- Binswangen 16 listings
- Bischofsgrün 22 listings
- Bischofsmais 25 listings
- Bischofswiesen 65 listings
- Blaichach 38 listings
- Bodenmais 52 listings
- Bodolz 20 listings
- Bolsterlang 61 listings
- Breitbrunn am Chiemsee 32 listings
- Buchenberg 25 listings
- Burgberg 17 listings
- Burgbernheim 22 listings
- Burghausen 21 listings
- Burgthann 17 listings
D
- Dachau 35 listings
- Deggendorf 33 listings
- Dießen am Ammersee 103 listings
- Dietmannsried 28 listings
- Dietramszell 22 listings
- Dillingen a.d.Donau 22 listings
- Dinkelsbühl 76 listings
- Donauwörth 33 listings
- Drachselsried 24 listings
- Durach 17 listings
E
- Ebermannstadt 22 listings
- Eggolsheim 17 listings
- Eggstätt 22 listings
- Egloffstein 18 listings
- Eichstätt 18 listings
- Eisenberg 23 listings
- Erding 45 listings
- Erlangen 114 listings
F
- Farchant 57 listings
- Feldkirchen-Westerham 24 listings
- Feucht 17 listings
- Feuchtwangen 18 listings
- Fichtelberg 29 listings
- Fischbachau 59 listings
- Fischen im Allgäu 71 listings
- Fladungen 25 listings
- Flintsbach am Inn 18 listings
- Forchheim 39 listings
- Frasdorf 16 listings
- Frauenau 19 listings
- Freilassing 78 listings
- Freising 59 listings
- Freyung 48 listings
- Friedberg 24 listings
- Fürstenfeldbruck 28 listings
- Fürth 158 listings
- Furth im Wald 26 listings
- Füssen 161 listings
G
- Garching bei München 23 listings
- Garmisch-Partenkirchen 636 listings
- Gauting 40 listings
- Geretsried 17 listings
- Germering 36 listings
- Gilching 20 listings
- Gmund 36 listings
- Gößweinstein 36 listings
- Grabenstätt 24 listings
- Gräfelfing 24 listings
- Grafenau 35 listings
- Grafenwöhr 23 listings
- Grafing 19 listings
- Grainau 140 listings
- Grassau 55 listings
- Gröbenzell 30 listings
- Grünenbach 25 listings
- Grünwald 18 listings
- Gstadt am Chiemsee 22 listings
- Günzburg 80 listings
- Gunzenhausen 37 listings
H
- Haar 25 listings
- Haidmühle 21 listings
- Halblech 53 listings
- Hallbergmoos 27 listings
- Haundorf 25 listings
- Hausham 24 listings
- Hauzenberg 28 listings
- Heroldsberg 18 listings
- Herrsching am Ammersee 41 listings
- Herzogenaurach 36 listings
- Hilpoltstein 27 listings
- Hof 39 listings
- Hohenlinden 21 listings
- Hohenwarth 21 listings
- Holzkirchen 25 listings
- Hopferau 29 listings
I
- Ichenhausen 21 listings
- Immenstadt im Allgäu 53 listings
- Ingolstadt 147 listings
- Inning am Ammersee 25 listings
- Inzell 120 listings
- Iphofen 23 listings
K
- Karlsfeld 18 listings
- Kaufbeuren 48 listings
- Kelheim 45 listings
- Kempten (Allgäu) 144 listings
- Kiefersfelden 56 listings
- Kitzingen 35 listings
- Kochel am See 60 listings
- Kolbermoor 22 listings
- Königsberg in Bayern 18 listings
- Kornau 17 listings
- Kötz 18 listings
- Kreuth 24 listings
- Kronach 18 listings
- Krumbach (Schwaben) 25 listings
- Krün 49 listings
- Kulmbach 57 listings
L
- Lam 59 listings
- Landsberg am Lech 62 listings
- Landshut 66 listings
- Lauf an der Pegnitz 31 listings
- Lechbruck am See 38 listings
- Leipheim 28 listings
- Lenggries 54 listings
- Lichtenfels 23 listings
- Lindau (Bodensee) 151 listings
- Lindberg 21 listings
- Lindenberg im Allgäu 23 listings
- Lohr am Main 22 listings
M
- Maierhöfen 16 listings
- Markt Schwaben 23 listings
- Marktbreit 33 listings
- Marktheidenfeld 18 listings
- Marktoberdorf 33 listings
- Marktschellenberg 25 listings
- Marquartstein 29 listings
- Mauth 35 listings
- Mehlmeisel 21 listings
- Memmingen 108 listings
- Miesbach 21 listings
- Miltenberg 32 listings
- Missen-Wilhams 52 listings
- Mittenwald 119 listings
- Muhr am See 18 listings
- Munich 3,603 listings
- Murnau am Staffelsee 59 listings
N
- Nabburg 20 listings
- Nagel 23 listings
- Nesselwang 51 listings
- Neu-Ulm 92 listings
- Neufahrn bei Freising 37 listings
- Neukirchen beim Heiligen Blut 32 listings
- Neumarkt in der Oberpfalz 18 listings
- Neunburg vorm Wald 24 listings
- Neureichenau 24 listings
- Neuschönau 23 listings
- Neustadt an der Donau 18 listings
- Nittenau 21 listings
- Nordheim a.Main 17 listings
- Nördlingen 38 listings
- Nuremberg 1,169 listings
- Nußdorf am Inn 18 listings
O
- Oberammergau 132 listings
- Oberasbach 23 listings
- Oberau 25 listings
- Oberaudorf 89 listings
- Obergünzburg 21 listings
- Oberhaching 32 listings
- Obermaiselstein 50 listings
- Obernzell 27 listings
- Oberreute 44 listings
- Oberschleißheim 32 listings
- Oberstaufen 148 listings
- Oberstdorf 263 listings
- Ochsenfurt 51 listings
- Ofterschwang 34 listings
- Olching 29 listings
- Ottobeuren 32 listings
- Ottobrunn 21 listings
- Oy 30 listings
- Oy-Mittelberg 32 listings
P
- Passau 202 listings
- Pegnitz 26 listings
- Peiting 23 listings
- Penzberg 26 listings
- Petersthal 19 listings
- Pfronten 155 listings
- Piding 36 listings
- Pleinfeld 46 listings
- Pöcking 29 listings
- Poing 19 listings
- Pottenstein 23 listings
- Prien am Chiemsee 74 listings
R
- Ramsau bei Berchtesgaden 45 listings
- Randersacker 16 listings
- Regen 26 listings
- Regensburg 289 listings
- Reit im Winkl 119 listings
- Rettenberg 79 listings
- Rieden am Forggensee 38 listings
- Riedenburg 34 listings
- Rimsting 22 listings
- Rosenheim 82 listings
- Roßhaupten 34 listings
- Rothenburg ob der Tauber 71 listings
- Rottach-Egern 51 listings
- Ruhpolding 104 listings
S
- Samerberg 23 listings
- Sandberg 17 listings
- Sankt Englmar 118 listings
- Sankt Oswald-Riedlhütte 17 listings
- Scheidegg 108 listings
- Schleching 18 listings
- Schliersee 109 listings
- Schneizlreuth 29 listings
- Schöllkrippen 18 listings
- Schönau am Königssee 137 listings
- Schongau 22 listings
- Schrobenhausen 21 listings
- Schwabach 48 listings
- Schwandorf 44 listings
- Schwangau 91 listings
- Schweinfurt 63 listings
- Seefeld 18 listings
- Seeg 34 listings
- Seehausen am Staffelsee 20 listings
- Seeon-Seebruck 49 listings
- Selb 40 listings
- Siegsdorf 79 listings
- Sinzing 17 listings
- Sommerhausen 26 listings
- Sonthofen 90 listings
- Spalt 37 listings
- Spiegelau 31 listings
- Starnberg 73 listings
- Steibis 35 listings
- Stein 24 listings
- Steingaden 18 listings
- Stiefenhofen 27 listings
- Straubing 54 listings
- Sulzberg 24 listings
T
- Tegernsee 48 listings
- Teisendorf 28 listings
- Thurnau 24 listings
- Tiefenbach 30 listings
- Traunreut 24 listings
- Traunstein 46 listings
- Treuchtlingen 31 listings
- Tutzing 48 listings
U
- Übersee 64 listings
- Unterammergau 44 listings
- Unterhaching 25 listings
- Unterschleißheim 27 listings
- Unterwössen 54 listings
- Utting am Ammersee 36 listings
V
- Vaterstetten 37 listings
- Viechtach 38 listings
- Volkach 42 listings
- Vorderhindelang 17 listings
W
- Wackersberg 17 listings
- Wackersdorf 26 listings
- Waldkirchen 47 listings
- Waldmünchen 37 listings
- Waltenhofen 37 listings
- Wasserburg (Bodensee) 39 listings
- Weiden in der Oberpfalz 55 listings
- Weiler-Simmerberg 30 listings
- Weilheim in Oberbayern 18 listings
- Weißenburg i. Bay. 21 listings
- Weitnau 30 listings
- Wemding 24 listings
- Wendelstein 22 listings
- Wertach 44 listings
- Weßling 31 listings
- Weyarn 16 listings
- Wiggensbach 23 listings
- Wildsteig 19 listings
- Windorf 18 listings
- Wolfratshausen 25 listings
- Wörthsee 33 listings
- Würzburg 416 listings