AirROI ranking · 202650 markets ranked
Best Places to Buy an Airbnb in Apulia, Italy (2026)
Carovigno is the best place to buy an Airbnb in Apulia in 2026, according to AirROI's ranking of 50 markets. Its listings averaged €24,300 in revenue over the 12 months to October 2026 and were booked on 40% of nights. It also earns the most per listing of any ranked market. Bari and Monopoli come next.
- Markets tracked
- 159
- Active Airbnb listings
- 24,500
- Avg. revenue per listing
- €13,100
- Occupancy rate
- 37%
- Avg. nightly rate
- €165
- Revenue change, typical market
- +7%
The short answer
Apulia Airbnb Market at a Glance
Across Apulia, the 24,500 active Airbnb listings tracked by AirROI, a short-term-rental data firm, averaged €13,100 over the same period. They were booked on 37% of nights at about €165 a night; the ranking covers the 50 markets with at least 100 active listings. Revenue per listing rose in 39 of the 50 ranked markets with a comparable year of data, by 7% in the typical one.
The ranking weighs revenue per listing most, then occupancy and market size, then how evenly income spreads across the year and how it changed on the year. It reflects rental performance, not purchase prices or local short-term rental rules. Most listings in every one of the 50 ranked markets display a registration number, so confirm the local rules for any address you consider. How the ranking works.
Where the top 10 Airbnb markets in Apulia are
Each dot is one of the 159 markets AirROI tracks in Apulia (2 outlying ones fall outside the map), sized by active listings and coloured by average revenue per listing. Select a number to jump to its profile.
Money figures on this page are in euros, converted from US dollars at €0.86 per US$, the typical rate from November 2025 to October 2026.
Top 10
The Top 10 Airbnb Markets in Apulia
Each profile draws on the market's full AirROI report: how it earns, when in the year, who books and what sells. Monthly figures are averages per listing active in that month, so twelve of them add up to more than the annual average, which also counts listings that operated for only part of the year.
| # | Market | Avg. revenue | Occupancy |
|---|---|---|---|
 Carovigno High earnings · Growing revenue | €24,300 | 40% | |
 Bari Large market · High occupancy | €14,700 | 42% | |
 Monopoli High occupancy · Large market | €20,800 | 44% | |
| 4 |  Polignano a Mare High occupancy · High earnings | €21,500 | 43% |
| 5 |  Cisternino High occupancy · High earnings | €20,000 | 41% |
| 6 |  Lecce Large market · Growing revenue | €12,000 | 38% |
| 7 |  Castellana Grotte High earnings · High occupancy | €23,900 | 43% |
| 8 |  Ostuni Large market · High earnings | €21,400 | 37% |
| 9 |  Martina Franca Large market · High earnings | €18,700 | 38% |
| 10 |  Alberobello High earnings · High occupancy | €17,800 | 38% |
1. Carovigno
Known for: High earnings · Growing revenue
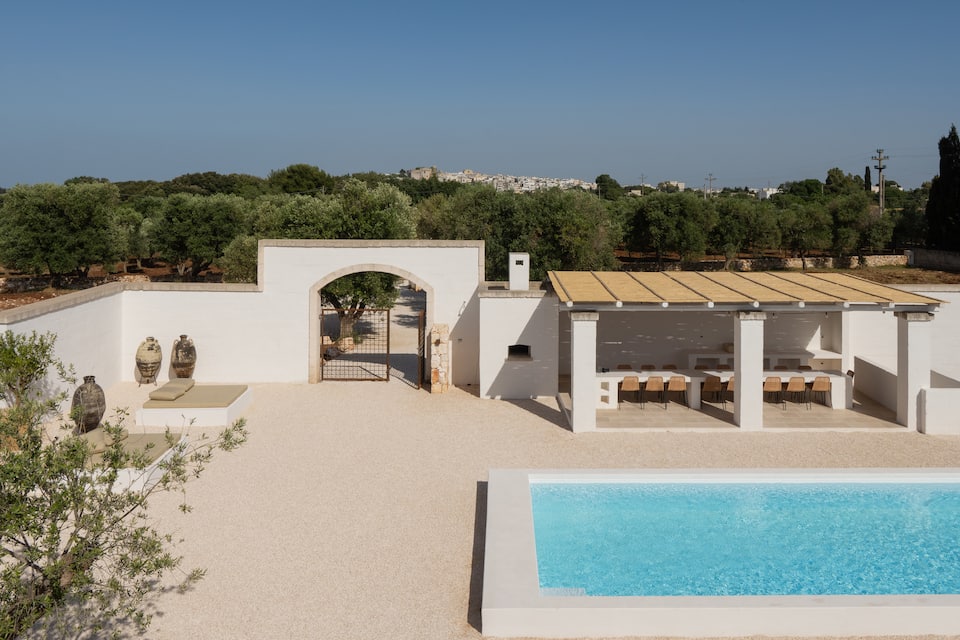
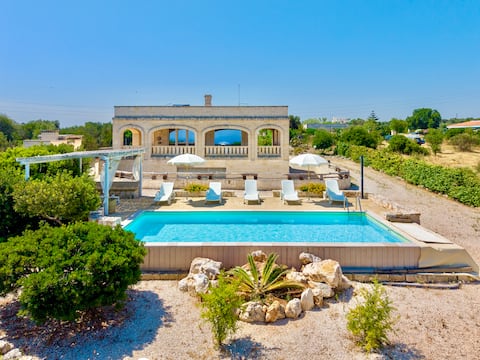
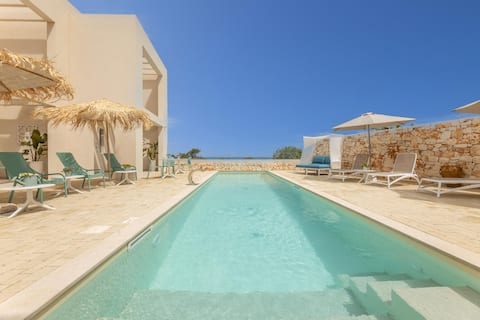
Top-earning Airbnb listings in Carovigno - Avg. revenue
- €24,300 +22% vs. last year
- Occupancy
- 40%
- Nightly rate
- €300
- Active listings
- 452
Where it places among the 50 ranked markets in Apulia
- Revenue 1st of 50
- Occupancy 7th of 50
- Market size 12th of 50
- Year-round 23rd of 50
- Growth 2nd of 50
- How it earns
- Carovigno commands premium rates, about €300 a night, and still books 40% of nights, 3 points above the Apulia average. That adds up to €24,300 per listing over the year, the highest of the 50 ranked markets. The gap between listings is wide: a typical one takes in about €1,890 a month, while the top quarter clear €3,970 and the top 10% €8,030, so pricing and presentation count for more here than in most of Apulia. Revenue per listing rose 22% over the year, the second-biggest gain in Apulia, helped by nightly rates 21% higher.
- When it earns
- Carovigno's season runs from June to September, peaking in August at about €6,980 per listing; January, the quietest month, brings in about €1,210.
- What sells
- Big homes are common: 40% of entire homes have three or more bedrooms, against about 20% in the typical market in Apulia, and houses make up 72% of supply.
- Who books
- Most guests come from abroad (91%), led by visitors from France, Germany and the United Kingdom.
- Who it suits
- It suits buyers who can carry costs through a quiet January and can furnish and price for a premium stay.
Revenue per listing by month
€6,980 €1,210- Median listing
- €1,890/mo
- Top 25% of listings
- €3,970+/mo
- Booked ahead
- 73 days
- Average stay
- 6 nights
- Most common home size
- 2 bedrooms
- Superhosts
- 31%
Areas in the full report: Carovigno Old Town · Torre Guaceto · Specchiolla
Full Carovigno Airbnb report2. Bari
Known for: Large market · High occupancy
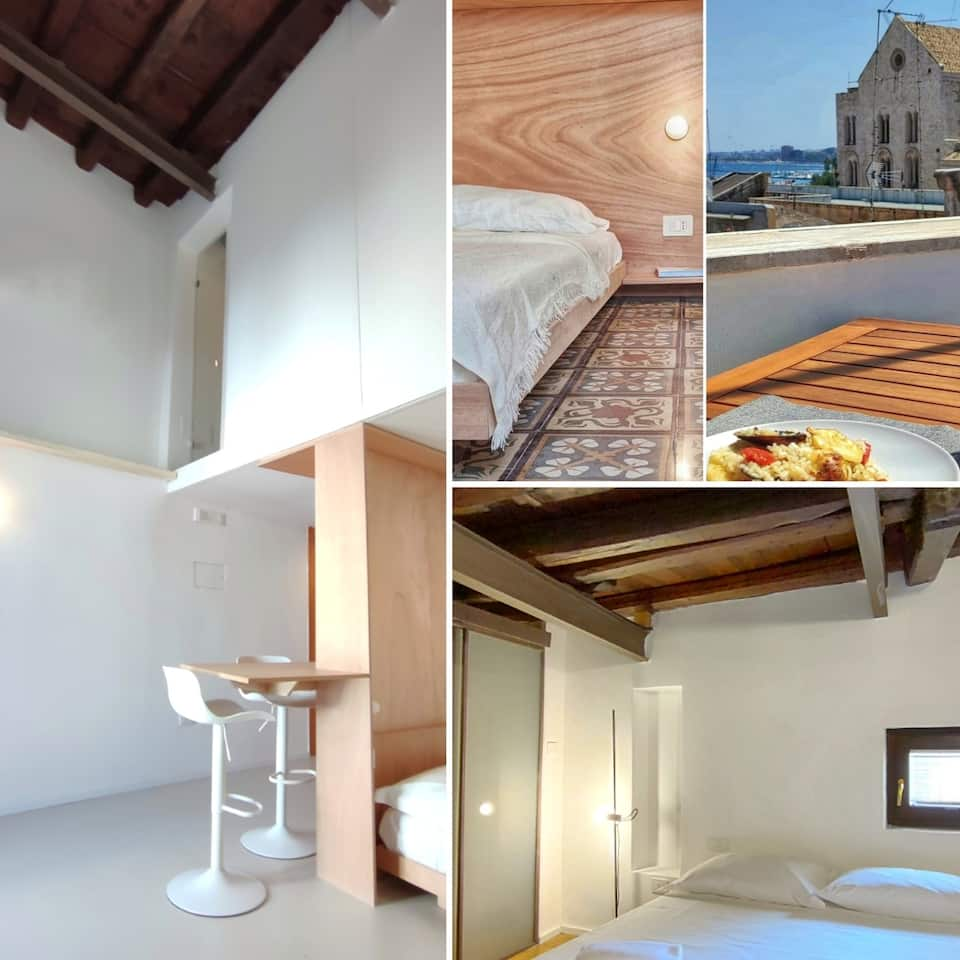

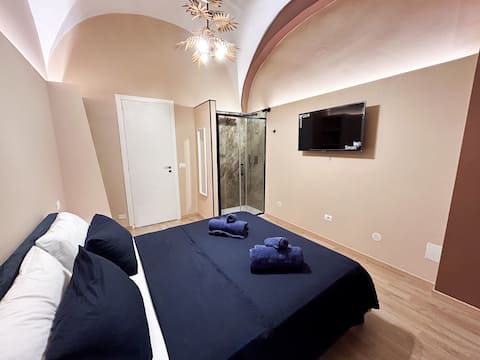
Top-earning Airbnb listings in Bari - Avg. revenue
- €14,700 +10% vs. last year
- Occupancy
- 42%
- Nightly rate
- €125
- Active listings
- 2,820
Where it places among the 50 ranked markets in Apulia
- Revenue 16th of 50
- Occupancy 4th of 50
- Market size 1st of 50
- Year-round 1st of 50
- Growth 20th of 50
- How it earns
- Bari earns on volume. Rates run below the Apulia average at about €125 a night, but listings book 42% of nights. Listings averaged €14,700 in revenue over the year, 12% above the Apulia average. A typical listing takes in about €1,610 a month; the top quarter clear €2,450 or more. Revenue per listing rose 10% over the year, helped by nightly rates 15% higher, even as the number of listings grew 25%.
- When it earns
- Revenue in Bari concentrates from April to October: August earns about €2,720 per listing, about 3.4 times as much as January. Stays are shorter than in most of Apulia, about 4 nights, so listings turn over often; guests book about 50 days ahead. Most hosts take one- or two-night bookings (84% of listings), more than in the typical market.
- Guest expectations
- Average ratings (4.66 stars) trail the typical market in Apulia (4.78), which leaves room for a well-run listing to stand out.
- What sells
- The most common entire home has 1 bedroom (66% of entire homes), and apartments and condos make up 80% of supply.
- Who it suits
- Best for buyers who can ride out a slow January and would rather price for occupancy than for rate.
Revenue per listing by month
€2,720 €797- Median listing
- €1,610/mo
- Top 25% of listings
- €2,450+/mo
- Booked ahead
- 50 days
- Average stay
- 4 nights
- Most common home size
- 1 bedroom
- Superhosts
- 30%
Areas in the full report: Old Town (Bari Vecchia) · Lungomare · Carrassi
Full Bari Airbnb report3. Monopoli
Known for: High occupancy · Large market
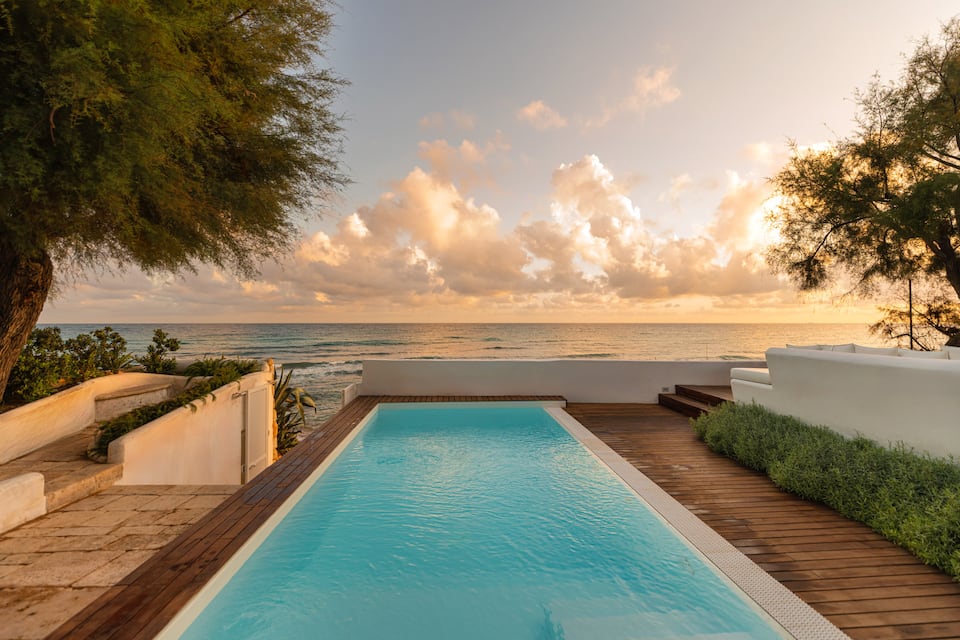


Top-earning Airbnb listings in Monopoli - Avg. revenue
- €20,800 +13% vs. last year
- Occupancy
- 44%
- Nightly rate
- €200
- Active listings
- 1,320
Where it places among the 50 ranked markets in Apulia
- Revenue 6th of 50
- Occupancy 1st of 50
- Market size 3rd of 50
- Year-round 33rd of 50
- Growth 13th of 50
- How it earns
- Monopoli fills more nights than any other ranked market in Apulia: 44% of them, at about €200 a night. Average revenue per listing came to €20,800, the sixth-highest of the 50 ranked markets. In a typical month the median listing brings in about €1,990, and the best quarter clear €3,130. Revenue per listing rose 13% over the year, helped by nightly rates 12% higher.
- When it earns
- In Monopoli, the months from May to September earn above the yearly average, led by August at about €5,210 per listing; January is the low point at about €802.
- Who books
- Nearly all guests come from abroad, led by visitors from France, the United States and the United Kingdom.
- What sells
- One-bedroom homes lead the market (51% of entire homes), and apartments and condos make up 49% of supply.
- Who it suits
- A good fit for buyers who are prepared for thin bookings around January.
Revenue per listing by month
€5,210 €802- Median listing
- €1,990/mo
- Top 25% of listings
- €3,130+/mo
- Booked ahead
- 68 days
- Average stay
- 5 nights
- Guests from abroad
- 96%
- Most common home size
- 1 bedroom
Areas in the full report: Old Town · Lido Santo Stefano · Capitolo
Full Monopoli Airbnb report4. Polignano a Mare
Known for: High occupancy · High earnings
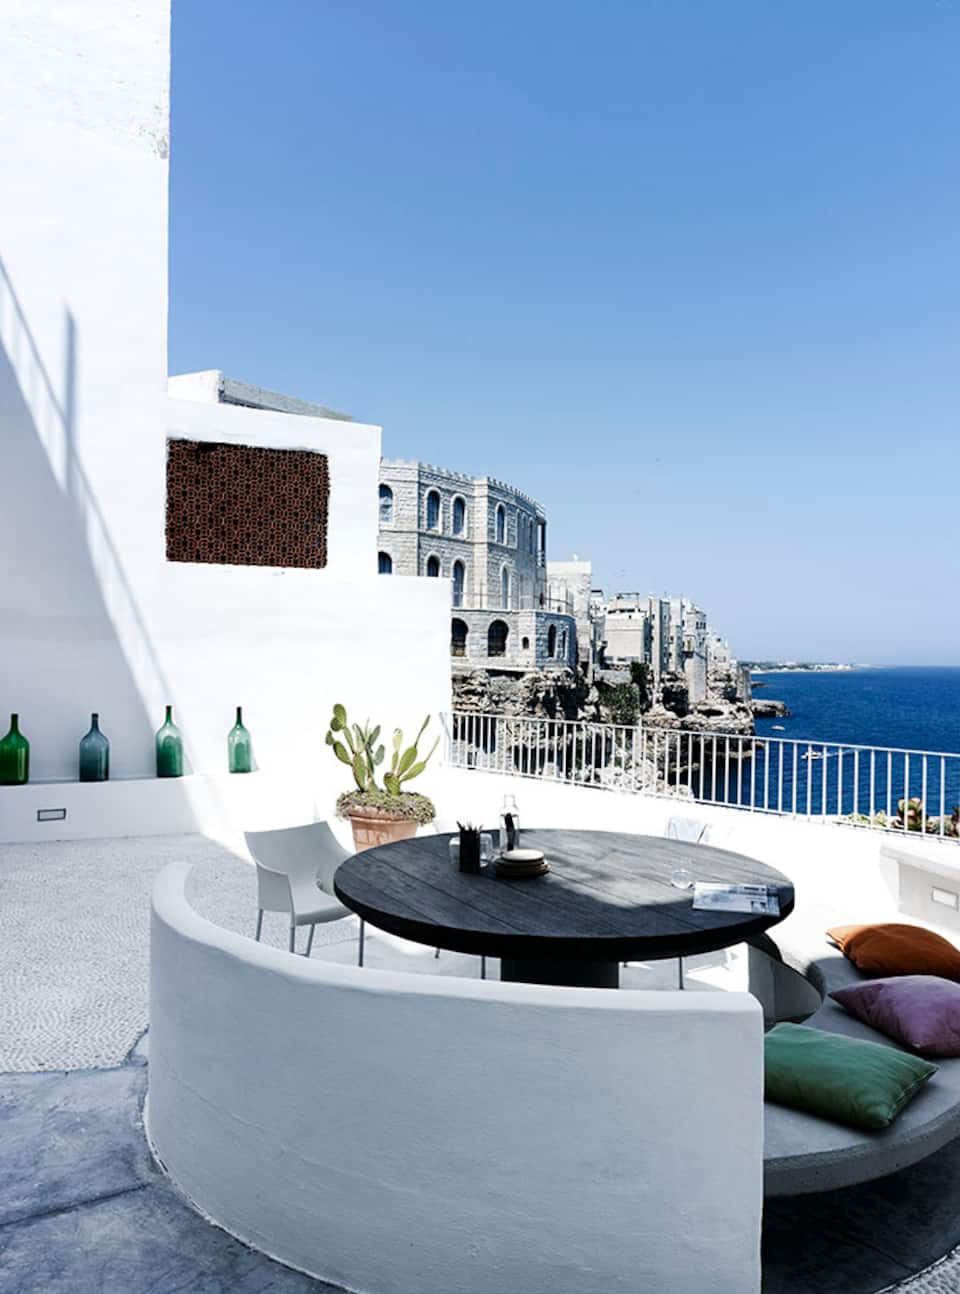


Top-earning Airbnb listings in Polignano a Mare - Avg. revenue
- €21,500 +5% vs. last year
- Occupancy
- 43%
- Nightly rate
- €195
- Active listings
- 777
Where it places among the 50 ranked markets in Apulia
- Revenue 4th of 50
- Occupancy 2nd of 50
- Market size 7th of 50
- Year-round 23rd of 50
- Growth 32nd of 50
- How it earns
- Listings in Polignano a Mare are booked on 43% of nights, the second-highest occupancy of the 50 ranked markets, at about €195 a night. That adds up to €21,500 per listing over the year, the fourth-highest of the 50 ranked markets. Month to month, the median listing earns about €1,950 and a top-quarter listing €3,080 or more. Revenue per listing rose 5% over the year, helped by nightly rates 6% higher, even as the number of listings grew 17%.
- When it earns
- Polignano a Mare's season runs from May to September, peaking in August at about €5,030 per listing; January, the quietest month, brings in about €844. Visits are quick, about 4 nights on average against 6 nights for the typical market in Apulia, booked about 62 days ahead.
- Who books
- Nearly all guests come from abroad, led by visitors from the United States, France and the United Kingdom.
- What sells
- The most common entire home has 1 bedroom (56% of entire homes), and houses make up 48% of supply.
- Who it suits
- It suits buyers who can carry costs through a quiet January.
Revenue per listing by month
€5,030 €844- Median listing
- €1,950/mo
- Top 25% of listings
- €3,080+/mo
- Booked ahead
- 62 days
- Average stay
- 4 nights
- Guests from abroad
- 96%
- Most common home size
- 1 bedroom
Areas in the full report: Old Town · Lama Monachile Beach · San Vito
Full Polignano a Mare Airbnb report5. Cisternino
Known for: High occupancy · High earnings
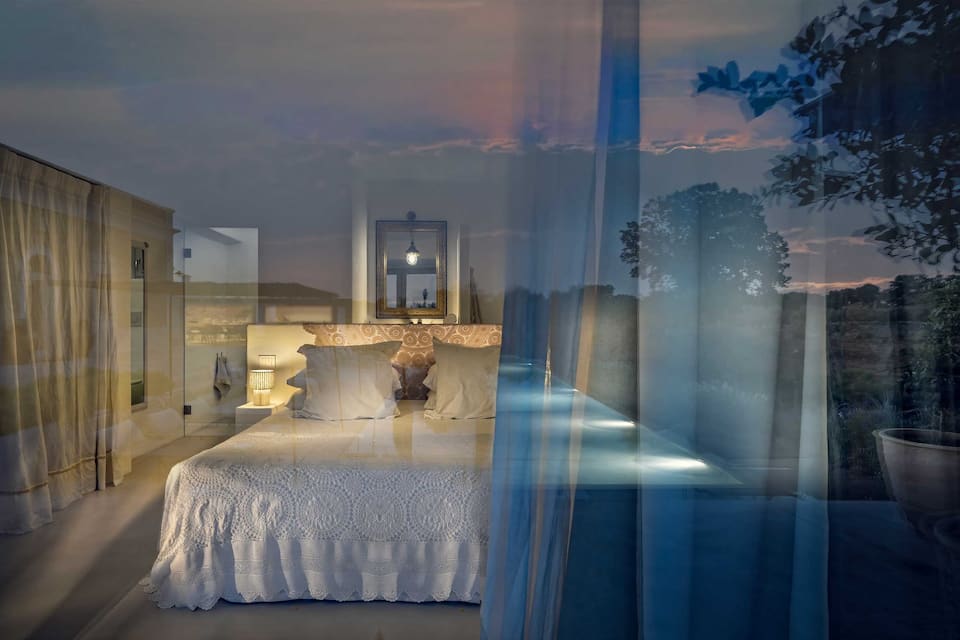
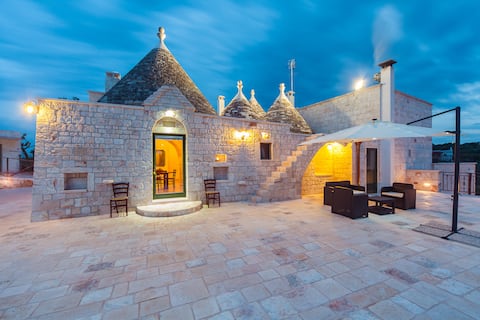
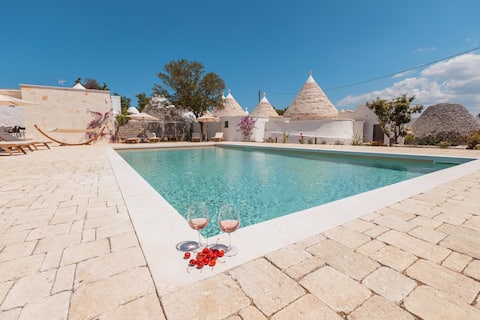
Top-earning Airbnb listings in Cisternino - Avg. revenue
- €20,000 +13% vs. last year
- Occupancy
- 41%
- Nightly rate
- €225
- Active listings
- 304
Where it places among the 50 ranked markets in Apulia
- Revenue 7th of 50
- Occupancy 6th of 50
- Market size 22nd of 50
- Year-round 14th of 50
- Growth 11th of 50
- How it earns
- Demand runs high in Cisternino: 41% of nights booked, the sixth-highest occupancy of the 50 ranked markets, at about €225 a night. Listings averaged €20,000 in revenue over the year, the seventh-highest of the 50 ranked markets. A typical listing takes in about €1,600 a month; the top quarter clear €3,120 or more. Revenue per listing rose 13% over the year, helped by nightly rates 13% higher.
- When it earns
- Revenue in Cisternino concentrates from May to September: August earns about €5,290 per listing, about 5.4 times as much as January.
- Guest expectations
- Guests rate listings highly, 4.86 stars on average against 4.78 for the typical market in Apulia, so reviews set a high bar.
- What sells
- One-bedroom homes lead the market (37% of entire homes), and houses make up 42% of supply.
- Who it suits
- Best for buyers who can ride out a slow January.
Revenue per listing by month
€5,290 €980- Median listing
- €1,600/mo
- Top 25% of listings
- €3,120+/mo
- Booked ahead
- 74 days
- Average stay
- 6 nights
- Most common home size
- 1 bedroom
- Superhosts
- 42%
Areas in the full report: Centro Storico · Valle d'Itria · Contrada Figazzano
Full Cisternino Airbnb report6. Lecce
Known for: Large market · Growing revenue
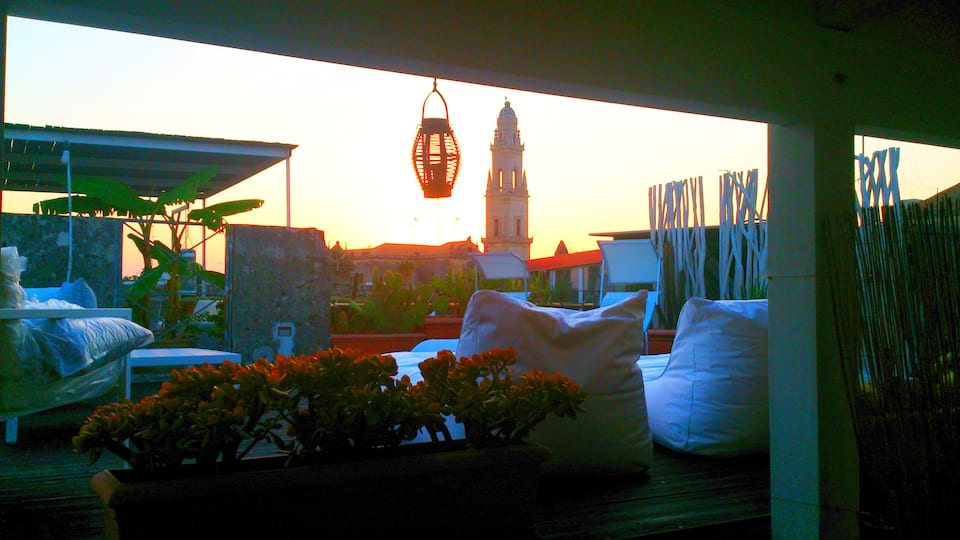


Top-earning Airbnb listings in Lecce - Avg. revenue
- €12,000 +12% vs. last year
- Occupancy
- 38%
- Nightly rate
- €135
- Active listings
- 1,240
Where it places among the 50 ranked markets in Apulia
- Revenue 18th of 50
- Occupancy 17th of 50
- Market size 4th of 50
- Year-round 2nd of 50
- Growth 16th of 50
- How it earns
- Lecce is Apulia's fourth-largest Airbnb market, with 1,240 active listings to price against. Moderate rates keep revenue per listing at €12,000, 9% below the Apulia average. In a typical month the median listing brings in about €1,200, and the best quarter clear €2,050. Revenue per listing rose 12% over the year, helped by nightly rates 15% higher.
- When it earns
- In Lecce, the months from May to September earn above the yearly average, led by August at about €2,660 per listing; January is the low point at about €685. Stays are shorter than in most of Apulia, about 5 nights, so listings turn over often; guests book about 58 days ahead. Most hosts take one- or two-night bookings (71% of listings), more than in the typical market.
- What sells
- The most common entire home has 1 bedroom (54% of entire homes), and apartments and condos make up 58% of supply.
- Who books
- Most guests come from abroad (91%), led by visitors from France, the United States and the United Kingdom.
- Who it suits
- A good fit for buyers who are prepared for thin bookings around January.
Revenue per listing by month
€2,660 €685- Median listing
- €1,200/mo
- Top 25% of listings
- €2,050+/mo
- Booked ahead
- 58 days
- Average stay
- 5 nights
- Most common home size
- 1 bedroom
- Superhosts
- 34%
Areas in the full report: Centro Storico · Leuca · Otranto
Full Lecce Airbnb report7. Castellana Grotte
Known for: High earnings · High occupancy
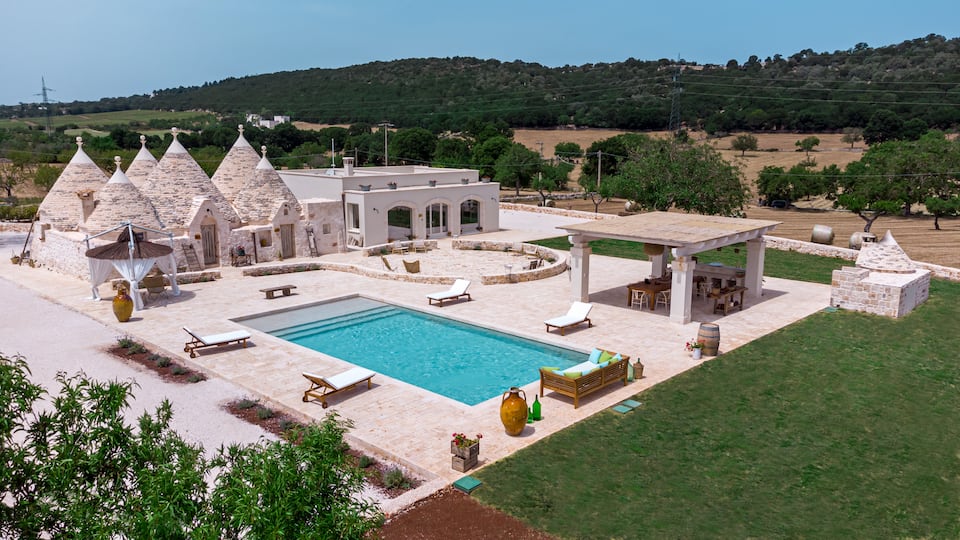
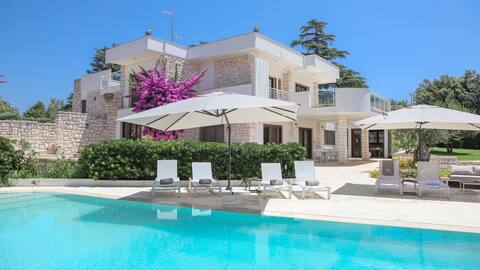

Top-earning Airbnb listings in Castellana Grotte - Avg. revenue
- €23,900 +10% vs. last year
- Occupancy
- 43%
- Nightly rate
- €235
- Active listings
- 217
Where it places among the 50 ranked markets in Apulia
- Revenue 2nd of 50
- Occupancy 3rd of 50
- Market size 27th of 50
- Year-round 23rd of 50
- Growth 20th of 50
- How it earns
- Castellana Grotte earns on price and volume at once: guests pay about €235 a night, and listings are booked on 43% of nights, 6 points above the Apulia average. That adds up to €23,900 per listing over the year, the second-highest of the 50 ranked markets. The gap between listings is wide: a typical one takes in about €1,730 a month, while the top quarter clear €3,710 and the top 10% €6,920, so pricing and presentation count for more here than in most of Apulia. Revenue per listing rose 10% over the year, helped by nightly rates 12% higher, even as the number of listings grew 15%. With 217 listings it is a small market, so its averages can move more from year to year.
- When it earns
- Castellana Grotte's season runs from May to September, peaking in August at about €6,080 per listing; February, the quietest month, brings in about €1,040.
- Guest expectations
- Guests rate listings highly, 4.87 stars on average against 4.78 for the typical market in Apulia, so reviews set a high bar.
- What sells
- One-bedroom homes lead the market (34% of entire homes), and houses make up 59% of supply.
- Who it suits
- It suits buyers who can carry costs through a quiet February and can furnish and price for a premium stay.
Revenue per listing by month
€6,080 €1,040- Median listing
- €1,730/mo
- Top 25% of listings
- €3,710+/mo
- Booked ahead
- 64 days
- Average stay
- 5 nights
- Most common home size
- 1 bedroom
- Superhosts
- 54%
8. Ostuni
Known for: Large market · High earnings
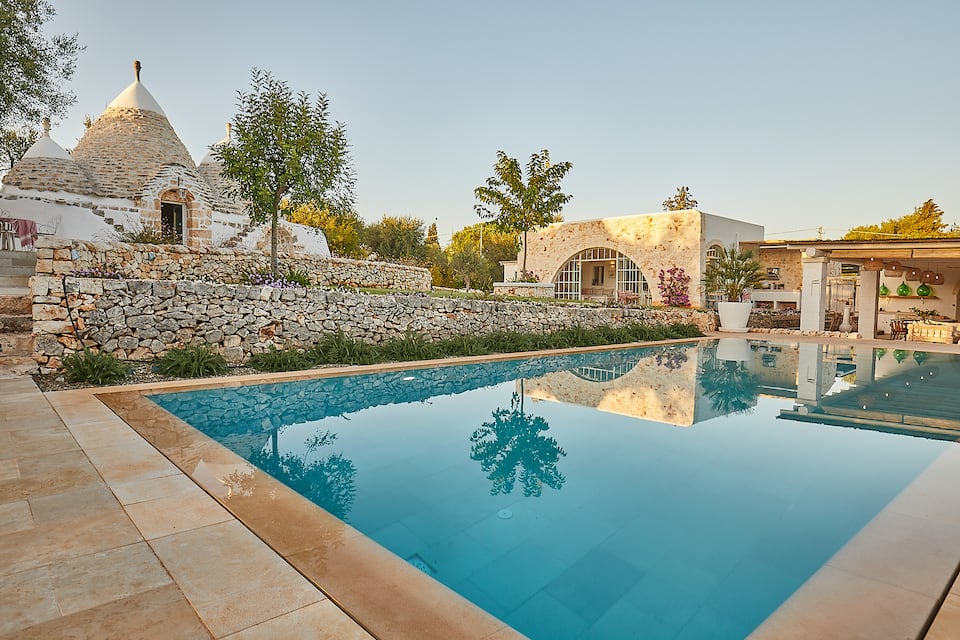
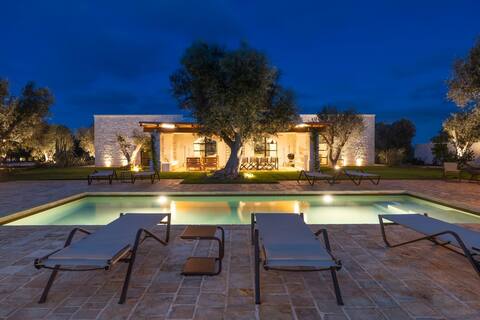
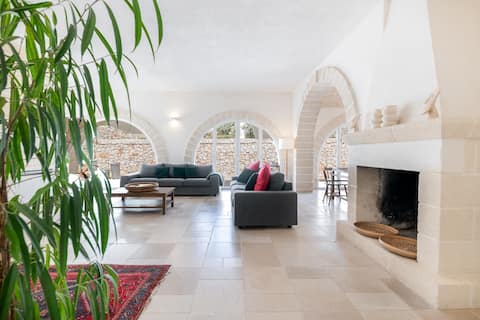
Top-earning Airbnb listings in Ostuni - Avg. revenue
- €21,400 +13% vs. last year
- Occupancy
- 37%
- Nightly rate
- €265
- Active listings
- 1,560
Where it places among the 50 ranked markets in Apulia
- Revenue 5th of 50
- Occupancy 18th of 50
- Market size 2nd of 50
- Year-round 33rd of 50
- Growth 14th of 50
- How it earns
- Ostuni earns on price: guests pay about €265 a night, 61% above the Apulia average. Listings averaged €21,400 in revenue over the year, the fifth-highest of the 50 ranked markets. The gap between listings is wide: a typical one takes in about €1,570 a month, while the top quarter clear €3,460 and the top 10% €6,960, so pricing and presentation count for more here than in most of Apulia. Revenue per listing rose 13% over the year, helped by nightly rates 19% higher.
- When it earns
- Revenue in Ostuni concentrates from May to September: August earns about €6,050 per listing, about 6.6 times as much as January.
- What sells
- The most common entire home has 1 bedroom (38% of entire homes), and houses make up 56% of supply.
- Who books
- Most guests come from abroad (91%), led by visitors from France, the United Kingdom and the United States.
- Who it suits
- Best for buyers who can ride out a slow January and can furnish and price for a premium stay.
Revenue per listing by month
€6,050 €914- Median listing
- €1,570/mo
- Top 25% of listings
- €3,460+/mo
- Booked ahead
- 68 days
- Average stay
- 5 nights
- Most common home size
- 1 bedroom
- Superhosts
- 32%
Areas in the full report: Centro Storico · Ostuni Beach · Contrada Lamacornola
Full Ostuni Airbnb report9. Martina Franca
Known for: Large market · High earnings
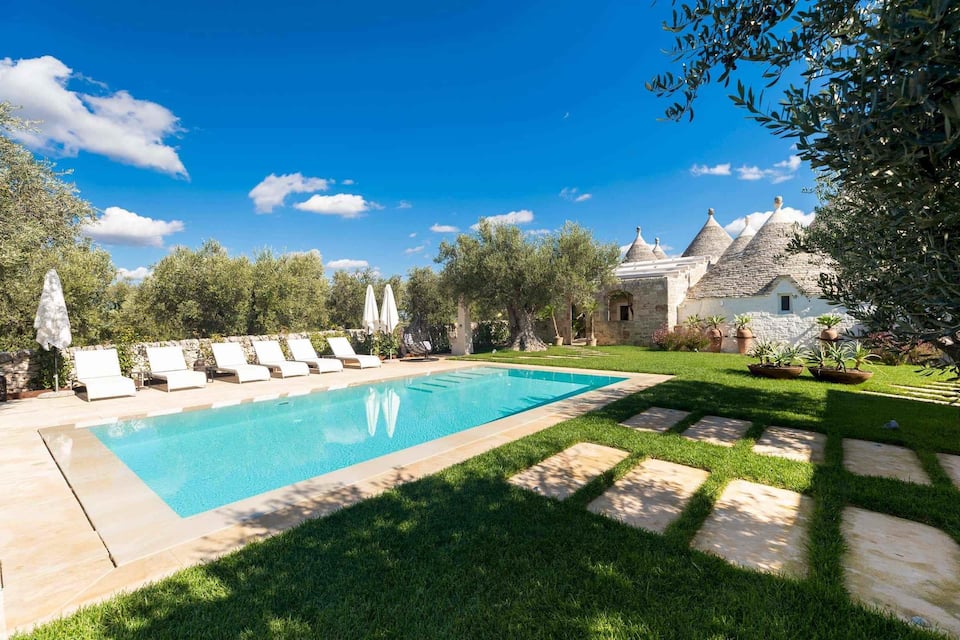

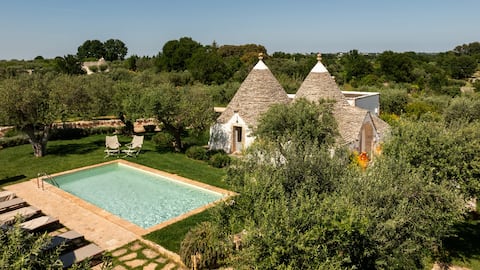
Top-earning Airbnb listings in Martina Franca - Avg. revenue
- €18,700 +9% vs. last year
- Occupancy
- 38%
- Nightly rate
- €215
- Active listings
- 633
Where it places among the 50 ranked markets in Apulia
- Revenue 9th of 50
- Occupancy 12th of 50
- Market size 8th of 50
- Year-round 23rd of 50
- Growth 22nd of 50
- How it earns
- Martina Franca listings charge about €215 a night, 30% above the Apulia average, and are booked on 38% of nights. Average revenue per listing came to €18,700, the ninth-highest of the 50 ranked markets. Month to month, the median listing earns about €1,480 and a top-quarter listing €2,790 or more. Revenue per listing rose 9% over the year, helped by nightly rates 12% higher.
- When it earns
- In Martina Franca, the months from May to September earn above the yearly average, led by August at about €4,900 per listing; January is the low point at about €858.
- Guest expectations
- Guests rate listings highly, 4.84 stars on average against 4.78 for the typical market in Apulia, so reviews set a high bar.
- What sells
- One-bedroom homes lead the market (41% of entire homes), and houses make up 39% of supply.
- Who it suits
- A good fit for buyers who are prepared for thin bookings around January.
Revenue per listing by month
€4,900 €858- Median listing
- €1,480/mo
- Top 25% of listings
- €2,790+/mo
- Booked ahead
- 64 days
- Average stay
- 5 nights
- Most common home size
- 1 bedroom
- Superhosts
- 42%
Areas in the full report: Centro Storico · Valle d'Itria · Parco Naturale Regionale delle Dune Costiere
Full Martina Franca Airbnb report10. Alberobello
Known for: High earnings · High occupancy
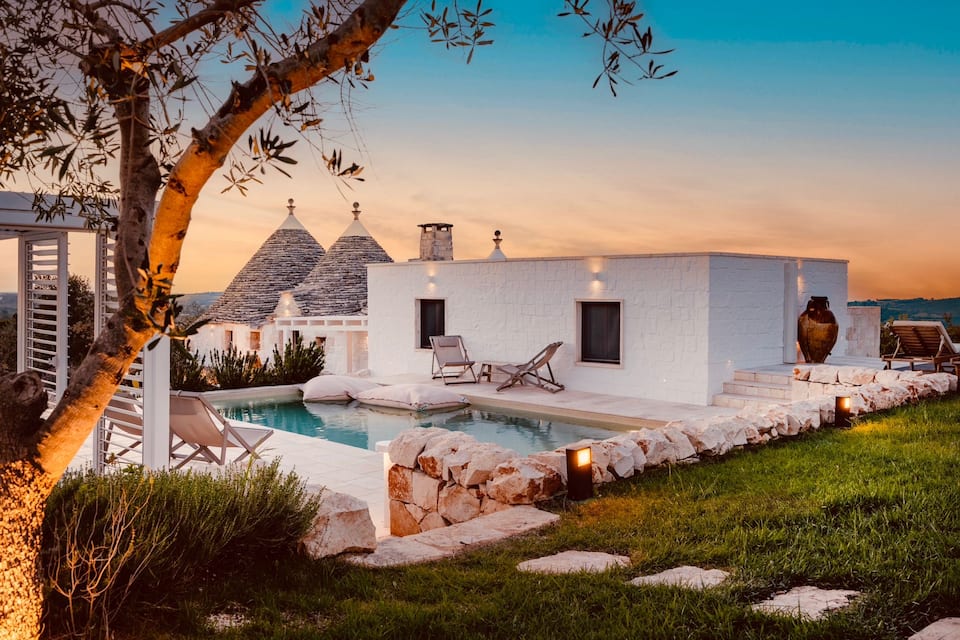
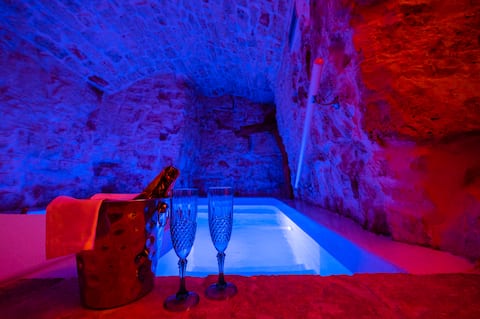
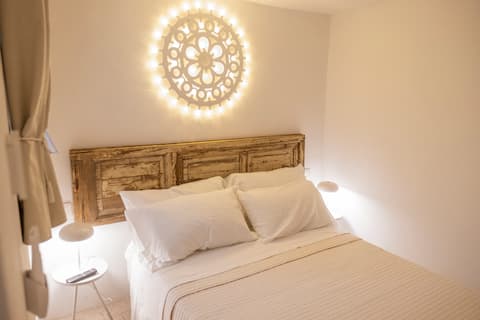
Top-earning Airbnb listings in Alberobello - Avg. revenue
- €17,800 +7% vs. last year
- Occupancy
- 38%
- Nightly rate
- €170
- Active listings
- 338
Where it places among the 50 ranked markets in Apulia
- Revenue 10th of 50
- Occupancy 13th of 50
- Market size 19th of 50
- Year-round 4th of 50
- Growth 25th of 50
- How it earns
- Alberobello books 38% of nights at about €170 a night, close to the typical market in Apulia. That adds up to €17,800 per listing over the year, the tenth-highest of the 50 ranked markets. A typical listing takes in about €1,630 a month; the top quarter clear €2,750 or more. Revenue per listing rose 7% over the year, helped by nightly rates 6% higher.
- When it earns
- Alberobello's season runs from May to September, peaking in August at about €3,530 per listing; February, the quietest month, brings in about €866. Visits are quick, about 3 nights on average against 6 nights for the typical market in Apulia, booked about 67 days ahead. Most hosts take one- or two-night bookings (83% of listings), more than in the typical market.
- Guest expectations
- Guests rate listings highly, 4.86 stars on average against 4.78 for the typical market in Apulia, so reviews set a high bar.
- What sells
- The most common entire home has 1 bedroom (49% of entire homes), and unique stays make up 50% of supply.
- Who it suits
- It suits buyers who can carry costs through a quiet February.
Revenue per listing by month
€3,530 €866- Median listing
- €1,630/mo
- Top 25% of listings
- €2,750+/mo
- Booked ahead
- 67 days
- Average stay
- 3 nights
- Most common home size
- 1 bedroom
- Superhosts
- 50%
Areas in the full report: Trulli District · Historic Center · Rione Monti
Full Alberobello Airbnb report
Full ranking
How All 50 Ranked Markets in Apulia Compare
The overall ranking with the five measures behind it. "Slow month" is a market's weakest month of revenue as a share of its best, so a higher figure means steadier income. Select a column heading to re-sort.
| Carovigno High earnings, growing revenue | €24,264 | 40% | €298 | 17% | +22% | 452 | |
| Bari Large market, high occupancy | €14,727 | 42% | €127 | 29% | +10% | 2,824 | |
| Monopoli High occupancy, large market | €20,790 | 44% | €199 | 15% | +13% | 1,315 | |
| 4 | Polignano a Mare High occupancy, high earnings | €21,454 | 43% | €197 | 17% | +5% | 777 |
| 5 | Cisternino High occupancy, high earnings | €20,028 | 41% | €224 | 19% | +13% | 304 |
| 6 | Lecce Large market, growing revenue | €11,974 | 38% | €135 | 26% | +12% | 1,237 |
| 7 | Castellana Grotte High earnings, high occupancy | €23,887 | 43% | €235 | 17% | +10% | 217 |
| 8 | Ostuni Large market, high earnings | €21,415 | 37% | €267 | 15% | +13% | 1,558 |
| 9 | Martina Franca Large market, high earnings | €18,703 | 38% | €215 | 17% | +9% | 633 |
| 10 | Alberobello High earnings, high occupancy | €17,791 | 38% | €170 | 25% | +7% | 338 |
| 11 | San Vito dei Normanni High earnings, high occupancy | €22,388 | 42% | €260 | 13% | +17% | 178 |
| 12 | Ceglie Messapica High earnings, high occupancy | €19,999 | 38% | €236 | 12% | +13% | 395 |
| 13 | Locorotondo High earnings, large market | €16,943 | 37% | €215 | 19% | +3% | 373 |
| 14 | Brindisi High occupancy, growing revenue | €9,257 | 38% | €106 | 21% | +11% | 362 |
| 15 | Putignano High occupancy, high earnings | €16,436 | 38% | €171 | 18% | +7% | 126 |
| 16 | Diso High occupancy, growing revenue | €16,475 | 38% | €222 | 16% | +13% | 111 |
| 17 | Fasano Large market, high earnings | €15,866 | 34% | €222 | 17% | +4% | 407 |
| 18 | Giovinazzo High occupancy | €11,546 | 38% | €118 | 20% | +4% | 155 |
| 19 | Conversano High occupancy, high earnings | €15,223 | 38% | €170 | 11% | +11% | 178 |
| 20 | Otranto Large market | €10,453 | 36% | €175 | 16% | +6% | 531 |
| 21 | Nardò Large market | €8,958 | 35% | €144 | 18% | +8% | 617 |
| 22 | Manduria Growing revenue | €10,528 | 36% | €168 | 13% | +12% | 270 |
| 23 | Tricase | €11,454 | 37% | €167 | 18% | +4% | 145 |
| 24 | Molfetta | €9,748 | 35% | €111 | 24% | −1% | 167 |
| 25 | Gallipoli Large market | €8,547 | 33% | €153 | 18% | +6% | 889 |
| 26 | Santa Cesarea Terme Growing revenue | €9,745 | 36% | €152 | 15% | +24% | 131 |
| 27 | Ugento Growing revenue | €8,041 | 34% | €155 | 19% | +14% | 311 |
| 28 | Salve Large market | €9,667 | 35% | €159 | 13% | +7% | 379 |
| 29 | Gagliano del Capo High earnings, high occupancy | €14,296 | 37% | €224 | 15% | −4% | 120 |
| 30 | Morciano di Leuca | €9,249 | 35% | €149 | 18% | 0% | 176 |
| 31 | Taranto Growing revenue, large market | €7,995 | 30% | €112 | 20% | +15% | 327 |
| 32 | Castro | €11,446 | 36% | €161 | 15% | −8% | 164 |
| 33 | Vieste Large market | €7,399 | 35% | €136 | 24% | −5% | 480 |
| 34 | Castrignano del Capo | €9,135 | 32% | €189 | 20% | 0% | 234 |
| 35 | Mattinata High occupancy | €7,808 | 38% | €112 | 18% | −14% | 175 |
| 36 | Trani Growing revenue | €7,310 | 30% | €103 | 23% | +15% | 237 |
| 37 | Mola di Bari | €8,634 | 36% | €115 | 16% | −5% | 154 |
| 38 | Bisceglie | €8,103 | 32% | €116 | 20% | +7% | 150 |
| 39 | Melendugno Large market, growing revenue | €7,415 | 35% | €132 | 11% | +11% | 394 |
| 40 | Patù | €7,951 | 35% | €164 | 22% | 0% | 114 |
| 41 | Racale | €8,180 | 33% | €149 | 14% | +1% | 242 |
| 42 | Porto Cesareo Large market | €6,813 | 33% | €142 | 15% | +2% | 834 |
| 43 | Taviano | €8,189 | 34% | €139 | 10% | −1% | 217 |
| 44 | Maruggio | €7,792 | 34% | €146 | 16% | +6% | 174 |
| 45 | Alliste | €7,979 | 33% | €145 | 13% | +7% | 160 |
| 46 | Barletta Growing revenue | €5,211 | 28% | €94 | 26% | +15% | 113 |
| 47 | Matino Growing revenue | €6,803 | 32% | €123 | 15% | +22% | 126 |
| 48 | Peschici | €6,693 | 36% | €108 | 13% | −4% | 169 |
| 49 | Galatone Growing revenue | €6,508 | 33% | €139 | 16% | +21% | 111 |
| 50 | Sannicola | €6,698 | 35% | €124 | 11% | −1% | 104 |
By measure
Apulia Airbnb Markets Ranked by Revenue, Nightly Rate and Occupancy
The overall ranking balances five measures. These lists take one at a time, for buyers who care most about income, pricing power, bookings, a steady calendar, momentum or market size.
Highest-earning Airbnb markets in Apulia
Average annual revenue per active listing over the past 12 months. Markets with at least 200 listings.
| # | Market | Revenue |
|---|---|---|
| Carovigno #1 overall | €24,300 | |
| Castellana Grotte #7 overall | €23,900 | |
| Polignano a Mare #4 overall | €21,500 | |
| 4 | Ostuni #8 overall | €21,400 |
| 5 | Monopoli #3 overall | €20,800 |
| 6 | Cisternino #5 overall | €20,000 |
| 7 | Ceglie Messapica #12 overall | €20,000 |
| 8 | Martina Franca #9 overall | €18,700 |
| 9 | Alberobello #10 overall | €17,800 |
| 10 | Locorotondo #13 overall | €16,900 |
| 11 | Fasano #17 overall | €15,900 |
| 12 | Bari #2 overall | €14,700 |
| 13 | Lecce #6 overall | €12,000 |
| 14 | Manduria #22 overall | €10,500 |
| 15 | Otranto #20 overall | €10,500 |
| 16 | Salve #28 overall | €9,670 |
| 17 | Brindisi #14 overall | €9,260 |
| 18 | Castrignano del Capo #34 overall | €9,130 |
| 19 | Nardò #21 overall | €8,960 |
| 20 | Gallipoli #25 overall | €8,550 |
| 21 | Taviano #43 overall | €8,190 |
| 22 | Racale #41 overall | €8,180 |
| 23 | Ugento #27 overall | €8,040 |
| 24 | Taranto #31 overall | €7,990 |
| 25 | Melendugno #39 overall | €7,420 |
Most expensive Airbnb markets in Apulia by nightly rate
Average rate per booked night. A high rate earns most where occupancy holds up too. Markets with at least 200 listings.
| # | Market | Nightly |
|---|---|---|
| Carovigno #1 overall | €300 | |
| Ostuni #8 overall | €265 | |
| Ceglie Messapica #12 overall | €235 | |
| 4 | Castellana Grotte #7 overall | €235 |
| 5 | Cisternino #5 overall | €225 |
| 6 | Fasano #17 overall | €220 |
| 7 | Martina Franca #9 overall | €215 |
| 8 | Locorotondo #13 overall | €215 |
| 9 | Monopoli #3 overall | €200 |
| 10 | Polignano a Mare #4 overall | €195 |
| 11 | Castrignano del Capo #34 overall | €190 |
| 12 | Otranto #20 overall | €175 |
| 13 | Alberobello #10 overall | €170 |
| 14 | Manduria #22 overall | €170 |
| 15 | Salve #28 overall | €160 |
| 16 | Ugento #27 overall | €155 |
| 17 | Gallipoli #25 overall | €155 |
| 18 | Racale #41 overall | €150 |
| 19 | Nardò #21 overall | €145 |
| 20 | Porto Cesareo #42 overall | €140 |
| 21 | Taviano #43 overall | €140 |
| 22 | Vieste #33 overall | €135 |
| 23 | Lecce #6 overall | €135 |
| 24 | Melendugno #39 overall | €130 |
| 25 | Bari #2 overall | €125 |
Highest-occupancy Airbnb markets in Apulia
Share of available nights booked over the past 12 months. Markets with at least 200 listings.
| # | Market | Occupancy |
|---|---|---|
| Monopoli #3 overall | 44% | |
| Polignano a Mare #4 overall | 43% | |
| Castellana Grotte #7 overall | 43% | |
| 4 | Bari #2 overall | 42% |
| 5 | Cisternino #5 overall | 41% |
| 6 | Carovigno #1 overall | 40% |
| 7 | Ceglie Messapica #12 overall | 38% |
| 8 | Brindisi #14 overall | 38% |
| 9 | Martina Franca #9 overall | 38% |
| 10 | Alberobello #10 overall | 38% |
| 11 | Lecce #6 overall | 38% |
| 12 | Ostuni #8 overall | 37% |
| 13 | Locorotondo #13 overall | 37% |
| 14 | Manduria #22 overall | 36% |
| 15 | Otranto #20 overall | 36% |
| 16 | Nardò #21 overall | 35% |
| 17 | Vieste #33 overall | 35% |
| 18 | Melendugno #39 overall | 35% |
| 19 | Salve #28 overall | 35% |
| 20 | Taviano #43 overall | 34% |
| 21 | Ugento #27 overall | 34% |
| 22 | Fasano #17 overall | 34% |
| 23 | Racale #41 overall | 33% |
| 24 | Gallipoli #25 overall | 33% |
| 25 | Porto Cesareo #42 overall | 33% |
Most year-round Airbnb markets in Apulia
Revenue in the slowest month as a share of the best month, so a higher figure means steadier income. Markets with at least 200 listings.
| # | Market | Slow month |
|---|---|---|
| Bari #2 overall | 29% | |
| Lecce #6 overall | 26% | |
| Alberobello #10 overall | 25% | |
| 4 | Vieste #33 overall | 24% |
| 5 | Trani #36 overall | 23% |
| 6 | Brindisi #14 overall | 21% |
| 7 | Taranto #31 overall | 20% |
| 8 | Castrignano del Capo #34 overall | 20% |
| 9 | Locorotondo #13 overall | 19% |
| 10 | Ugento #27 overall | 19% |
| 11 | Cisternino #5 overall | 19% |
| 12 | Gallipoli #25 overall | 18% |
| 13 | Nardò #21 overall | 18% |
| 14 | Polignano a Mare #4 overall | 17% |
| 15 | Martina Franca #9 overall | 17% |
| 16 | Carovigno #1 overall | 17% |
| 17 | Fasano #17 overall | 17% |
| 18 | Castellana Grotte #7 overall | 17% |
| 19 | Otranto #20 overall | 16% |
| 20 | Ostuni #8 overall | 15% |
| 21 | Monopoli #3 overall | 15% |
| 22 | Porto Cesareo #42 overall | 15% |
| 23 | Racale #41 overall | 14% |
| 24 | Salve #28 overall | 13% |
| 25 | Manduria #22 overall | 13% |
Fastest-growing Airbnb markets in Apulia
Change in revenue per listing from the year before, among markets where it rose. Markets with at least 200 listings.
| # | Market | Change |
|---|---|---|
| Carovigno #1 overall | +22% | |
| Trani #36 overall | +15% | |
| Taranto #31 overall | +15% | |
| 4 | Ugento #27 overall | +14% |
| 5 | Ceglie Messapica #12 overall | +13% |
| 6 | Cisternino #5 overall | +13% |
| 7 | Monopoli #3 overall | +13% |
| 8 | Ostuni #8 overall | +13% |
| 9 | Manduria #22 overall | +12% |
| 10 | Lecce #6 overall | +12% |
| 11 | Brindisi #14 overall | +11% |
| 12 | Melendugno #39 overall | +11% |
| 13 | Bari #2 overall | +10% |
| 14 | Castellana Grotte #7 overall | +10% |
| 15 | Martina Franca #9 overall | +9% |
| 16 | Nardò #21 overall | +8% |
| 17 | Alberobello #10 overall | +7% |
| 18 | Salve #28 overall | +7% |
| 19 | Gallipoli #25 overall | +6% |
| 20 | Otranto #20 overall | +6% |
| 21 | Polignano a Mare #4 overall | +5% |
| 22 | Fasano #17 overall | +4% |
| 23 | Locorotondo #13 overall | +3% |
| 24 | Porto Cesareo #42 overall | +2% |
| 25 | Racale #41 overall | +1% |
Largest Airbnb markets in Apulia
Active listings. Bigger markets have more comparable rentals to price against and more buyers at resale.
| # | Market | Listings |
|---|---|---|
| Bari #2 overall | 2,820 | |
| Ostuni #8 overall | 1,560 | |
| Monopoli #3 overall | 1,320 | |
| 4 | Lecce #6 overall | 1,240 |
| 5 | Gallipoli #25 overall | 889 |
| 6 | Porto Cesareo #42 overall | 834 |
| 7 | Polignano a Mare #4 overall | 777 |
| 8 | Martina Franca #9 overall | 633 |
| 9 | Nardò #21 overall | 617 |
| 10 | Otranto #20 overall | 531 |
| 11 | Vieste #33 overall | 480 |
| 12 | Carovigno #1 overall | 452 |
| 13 | Fasano #17 overall | 407 |
| 14 | Ceglie Messapica #12 overall | 395 |
| 15 | Melendugno #39 overall | 394 |
| 16 | Salve #28 overall | 379 |
| 17 | Locorotondo #13 overall | 373 |
| 18 | Brindisi #14 overall | 362 |
| 19 | Alberobello #10 overall | 338 |
| 20 | Taranto #31 overall | 327 |
| 21 | Ugento #27 overall | 311 |
| 22 | Cisternino #5 overall | 304 |
| 23 | Manduria #22 overall | 270 |
| 24 | Racale #41 overall | 242 |
| 25 | Trani #36 overall | 237 |
Seasonality
When Airbnbs in Apulia Earn the Most
August is the best month for all ranked markets in Apulia. January is the most common slowest month, in 31 markets.
August earns about 5.1 times what January does
Average revenue per listing across the 50 ranked markets in Apulia, by month
| Month | Avg. revenue per listing | Best month for | Highest-ranked examples |
|---|---|---|---|
| January | €757 | – | – |
| February | €845 | – | – |
| March | €1,170 | – | – |
| April | €1,530 | – | – |
| May | €1,890 | – | – |
| June | €2,400 | – | – |
| July | €3,420 | – | – |
| August | €3,880 | 50 markets | Carovigno, Bari, Monopoli |
| September | €2,440 | – | – |
| October | €1,650 | – | – |
| November | €1,060 | – | – |
| December | €847 | – | – |
Average revenue is per listing across the ranked markets, the line in the chart above. "Best month for" counts the ranked markets whose own revenue peaks in that month.
Management
Who Manages Airbnbs in Apulia?
AirROI ranks the 50 largest of the 109 companies that run 5 or more Airbnb listings in Apulia, by listings, guest rating and growth; companies run 18% of its listings.
Method
How the Ranking Works
The ranking covers the 50 markets in Apulia with at least 100 active Airbnb listings and data through October 2026. Each market is compared with the others on five measures, and markets are ordered by a weighted blend of where they place on each:
- Revenue per listing (35%): average revenue an active listing earned over the past 12 months.
- Occupancy (20%): share of available nights that were booked.
- Market size (20%): active listings. Bigger markets offer more comparable rentals to price against and more buyers when you sell.
- Year-round demand (15%): revenue in the slowest month as a share of the best month. The latest month is left out when its bookings look incomplete.
- Growth (10%): change in revenue per listing from the year before. Markets whose boundaries changed between years are scored in the middle.
Left out: 26 markets whose data predate the latest refresh. The score measures how rentals perform. It does not include purchase prices, financing, operating costs or local short-term rental rules, which vary by address and should be checked before buying. Figures are in euros and match each market's own report; see the data methodology for how listings are tracked.
To check one property before buying, run its address and size through the Airbnb estimator for a revenue, occupancy and nightly-rate range from comparable listings.
FAQ
Frequently Asked Questions About Airbnb Investing in Apulia
What is the best place to buy an Airbnb in Apulia?
Carovigno ranks first of the 50 markets in Apulia in AirROI's ranking, with €24,300 in average revenue per listing and 40% occupancy. Bari and Monopoli follow. The ranking weighs revenue, occupancy, market size, seasonality and growth; it leaves out purchase prices.
What are the most profitable Airbnb locations in Apulia?
By revenue per listing, among markets with at least 200 listings, Carovigno leads at €24,300 a year, ahead of Castellana Grotte at €23,900. Profit also depends on what a property costs to buy and run, which varies far more between markets than revenue does.
How much does an Airbnb make in Apulia?
The average active listing in Apulia earned €13,100 over the 12 months to October 2026, at 37% occupancy. Across the ranked markets, the middle half averaged between €7,980 and €15,900 per listing. Averages include listings that operated for only part of the year, so a listing rented all year typically earns more.
What is a good Airbnb occupancy rate in Apulia?
The average listing in Apulia was booked on 37% of available nights over the past 12 months. Half of the ranked markets fall between 34% and 38%, so a market above about 38% sits in the top quarter. Occupancy is only half the picture: a market with lower occupancy can still earn more if its nightly rates are higher.
Where is Airbnb demand highest in Apulia?
Among ranked markets with at least 200 listings, Monopoli has the highest occupancy, with 44% of available nights booked, followed by Polignano a Mare at 43%. Its listings average about €200 a night and €20,800 a year.
Where are Airbnb nightly rates highest in Apulia?
Among ranked markets with at least 200 listings, Carovigno has the highest average nightly rate, about €300, followed by Ostuni at €265. Trani is the least expensive, at about €105. The average booked night in Apulia costs about €165.
What is the best month for Airbnb in Apulia?
August is the highest-earning month for all 50 ranked markets. January is the most common slowest month, in 31 of the 50 markets. Each market's report shows its own month-by-month revenue, occupancy and rates.
Which Airbnb markets in Apulia earn the most evenly through the year?
Among ranked markets with at least 200 listings, Bari has the steadiest income: its slowest month, January, still earns about a quarter of its best. Lecce follows, at 26%. Steadier markets are easier to budget for, though they do not always earn the most per listing.
Which Airbnb markets are growing fastest in Apulia?
Among ranked markets with at least 200 listings, revenue per listing grew most in Carovigno, up 22% on the year before, and in Trani, up 15%. A single strong year can reflect events or new supply, so it is worth checking a market's monthly trend before relying on it.
Is Airbnb still profitable in Apulia in 2026?
Revenue per listing grew in 39 of the 50 ranked markets with a comparable year of data; in the typical market it rose 7%. Whether a given property profits depends on its purchase price, financing and running costs.
What are the best smaller Airbnb markets in Apulia?
Among ranked markets with fewer than 200 active listings, San Vito dei Normanni (#11 overall, €22,400 per listing), Putignano (#15, €16,400) and Diso (#16, €16,500) place highest. Smaller markets have fewer comparable rentals to price against, so their averages can move more from year to year.
How many Airbnb listings are there in Apulia?
AirROI tracked 24,500 active Airbnb listings in Apulia over the 12 months to October 2026, across 159 markets. The largest ranked market is Bari, with 2,820 listings, followed by Ostuni with 1,560.
Do Airbnb hosts need a permit in Apulia?
Rules can be national or regional as well as local, and they change often, so check each of them for any address you consider. In the listing data, most listings display a registration number in all 50 ranked markets, though that shows what hosts display, not what the rules allow.
Directory
All 159 Airbnb Markets in Apulia
Every Apulia city with an AirROI Airbnb market report, A–Z, with its active listing count.
A
B
C
- Calimera 21 listings
- Campi Salentina 18 listings
- Cannole 19 listings
- Canosa di Puglia 18 listings
- Carmiano 22 listings
- Carovigno 452 listings
- Carpignano Salentino 51 listings
- Casamassima 23 listings
- Casarano 65 listings
- Cassano delle Murge 32 listings
- Castellana Grotte 217 listings
- Castellaneta 50 listings
- Castrignano de' Greci 18 listings
- Castrignano del Capo 234 listings
- Castro 164 listings
- Cavallino 27 listings
- Ceglie Messapica 395 listings
- Cisternino 304 listings
- Collepasso 22 listings
- Conversano 178 listings
- Copertino 23 listings
- Corato 52 listings
- Corigliano d'Otranto 33 listings
- Corsano 75 listings
- Crispiano 30 listings
- Cursi 18 listings
- Cutrofiano 47 listings
D
- Diso 111 listings
F
- Fasano 407 listings
- Foggia 88 listings
- Francavilla Fontana 73 listings
G
- Gagliano del Capo 120 listings
- Galatina 92 listings
- Galatone 111 listings
- Gallipoli 889 listings
- Ginosa 44 listings
- Gioia del Colle 33 listings
- Giovinazzo 155 listings
- Giuggianello 20 listings
- Giurdignano 33 listings
- Gravina in Puglia 66 listings
- Grottaglie 44 listings
I
- Ischitella 26 listings
L
M
- Maglie 55 listings
- Manduria 270 listings
- Manfredonia 98 listings
- Margherita di Savoia 35 listings
- Martano 37 listings
- Martina Franca 633 listings
- Maruggio 174 listings
- Massafra 26 listings
- Matino 126 listings
- Mattinata 175 listings
- Melendugno 394 listings
- Melissano 20 listings
- Mesagne 74 listings
- Minervino di Lecce 21 listings
- Modugno 37 listings
- Mola di Bari 154 listings
- Molfetta 167 listings
- Monopoli 1,315 listings
- Monte Sant'Angelo 66 listings
- Monteroni di Lecce 32 listings
- Morciano di Leuca 176 listings
- Mottola 27 listings
- Muro Leccese 26 listings
N
- Nardò 617 listings
- Neviano 20 listings
- Noci 90 listings
- Noicattaro 23 listings
- Novoli 18 listings
P
- Parabita 74 listings
- Patù 114 listings
- Peschici 169 listings
- Poggiardo 40 listings
- Polignano a Mare 777 listings
- Porto Cesareo 834 listings
- Presicce-Acquarica 47 listings
- Pulsano 64 listings
- Putignano 126 listings
R
- Racale 242 listings
- Rodi Garganico 66 listings
- Roseto Valfortore 18 listings
- Ruffano 33 listings
- Rutigliano 25 listings
- Ruvo di Puglia 28 listings
S
- Salve 379 listings
- San Cesario di Lecce 34 listings
- San Donato di Lecce 22 listings
- San Giovanni Rotondo 49 listings
- San Michele Salentino 84 listings
- San Nicola 21 listings
- San Pietro In Bevagna 59 listings
- San Severo 33 listings
- San Vito dei Normanni 178 listings
- Sannicandro di Bari 26 listings
- Sannicola 104 listings
- Santa Cesarea Terme 131 listings
- Santeramo in Colle 22 listings
- Sava 23 listings
- Soleto 23 listings
- Specchia 38 listings
- Spongano 38 listings
- Squinzano 49 listings
- Surbo 19 listings
T
- Taranto 327 listings
- Taurisano 28 listings
- Taviano 217 listings
- Terlizzi 30 listings
- Tiggiano 28 listings
- Torchiarolo 35 listings
- Torre Pali 23 listings
- Torre Santa Susanna 17 listings
- Torricella 46 listings
- Trani 237 listings
- Trepuzzi 22 listings
- Tricase 145 listings
- Triggiano 19 listings
- Tuglie 53 listings
- Turi 25 listings
U
- Ugento 311 listings
- Uggiano la Chiesa 76 listings
V
- Veglie 25 listings
- Vernole 40 listings
- Vico del Gargano 63 listings
- Vieste 480 listings
- Villa Castelli 19 listings