AirROI ranking · 202690 markets ranked
Best Places to Buy an Airbnb in Ile-de-France, France (2026)
Vanves is the best place to buy an Airbnb in Ile-de-France in 2026, according to AirROI's ranking of 90 markets. Its listings averaged €22,800 in revenue over the 12 months to October 2026 and were booked on 55% of nights. It leads on the blend rather than on any one measure, placing 2nd of 90 for occupancy, 4th of 90 for revenue per listing and 5th of 90 for year-round demand. With 232 active listings it is a small market, so its averages can move more from year to year than those of larger ones. Saint-Ouen-sur-Seine and Serris come next.
- Markets tracked
- 376
- Active Airbnb listings
- 72,900
- Avg. revenue per listing
- €25,600
- Occupancy rate
- 47%
- Avg. nightly rate
- €195
- Revenue change, typical market
- +19%
The short answer
Ile-de-France Airbnb Market at a Glance
Across Ile-de-France, the 72,900 active Airbnb listings tracked by AirROI, a short-term-rental data firm, averaged €25,600 over the same period. They were booked on 47% of nights at about €195 a night; the ranking covers the 90 markets with at least 100 active listings. Revenue per listing rose in all 90 ranked markets with a comparable year of data, by 19% in the typical one.
The ranking weighs revenue per listing most, then occupancy and market size, then how evenly income spreads across the year and how it changed on the year. It reflects rental performance, not purchase prices or local short-term rental rules. How the ranking works.
Where the top 10 Airbnb markets in Ile-de-France are
Each dot is one of the 376 markets AirROI tracks in Ile-de-France (9 outlying ones fall outside the map), sized by active listings and coloured by average revenue per listing. Select a number to jump to its profile.
Money figures on this page are in euros, converted from US dollars at €0.86 per US$, the typical rate from November 2025 to October 2026.
Top 10
The Top 10 Airbnb Markets in Ile-de-France
Each profile draws on the market's full AirROI report: how it earns, when in the year, who books and what sells. Monthly figures are averages per listing active in that month, so twelve of them add up to more than the annual average, which also counts listings that operated for only part of the year.
| # | Market | Avg. revenue | Occupancy |
|---|---|---|---|
 Vanves High occupancy · Year-round demand | €22,800 | 55% | |
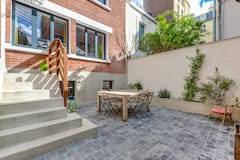 Saint-Ouen-sur-Seine Large market · Growing revenue | €18,600 | 50% | |
 Serris High occupancy · High earnings | €27,600 | 56% | |
| 4 |  Clichy Large market · High occupancy | €18,600 | 50% |
| 5 | 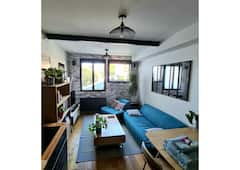 Montrouge High occupancy · Year-round demand | €18,600 | 51% |
| 6 | 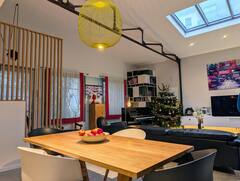 Issy-les-Moulineaux Year-round demand · Large market | €17,700 | 47% |
| 7 |  Paris High earnings · Large market | €34,400 | 50% |
| 8 | 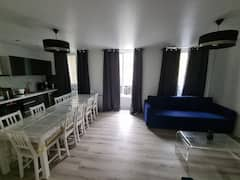 Vincennes High occupancy · Large market | €20,100 | 52% |
| 9 |  Chessy High earnings · High occupancy | €27,400 | 54% |
| 10 |  Malakoff High occupancy · Year-round demand | €21,300 | 50% |
1. Vanves
Known for: High occupancy · Year-round demand
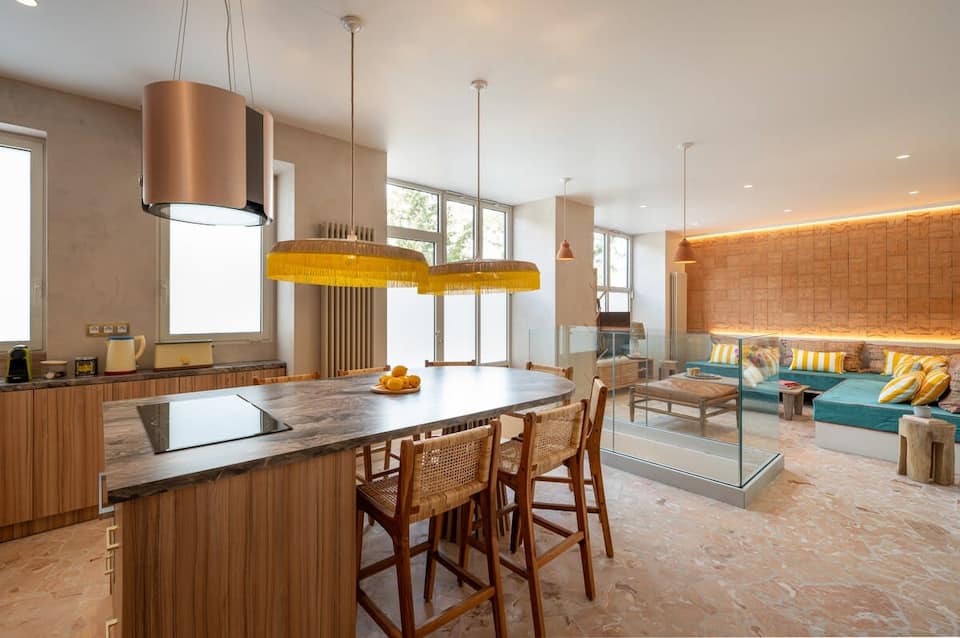

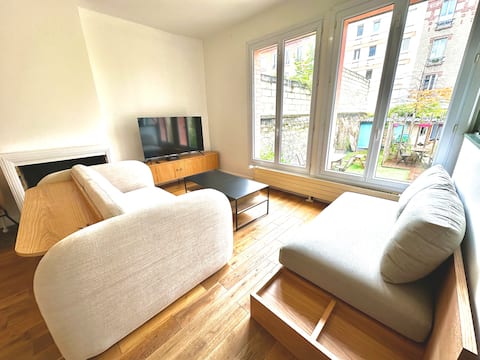
Top-earning Airbnb listings in Vanves - Avg. revenue
- €22,800 +22% vs. last year
- Occupancy
- 55%
- Nightly rate
- €150
- Active listings
- 232
Where it places among the 90 ranked markets in Ile-de-France
- Revenue 4th of 90
- Occupancy 2nd of 90
- Market size 34th of 90
- Year-round 5th of 90
- Growth 34th of 90
- How it earns
- Vanves earns on volume. Rates run below the Ile-de-France average at about €150 a night, but listings book 55% of nights. That adds up to €22,800 per listing over the year, the fourth-highest of the 90 ranked markets. A typical listing takes in about €2,110 a month; the top quarter clear €3,190 or more. Revenue per listing rose 22% over the year, helped by nightly rates 8% higher.
- When it earns
- Demand in Vanves holds up through the year: January, the slowest month, still brings in about two-thirds of June's revenue. Guests book early, about 54 days ahead against roughly 40 for the typical market in Ile-de-France, and stay about 6 nights.
- Guest expectations
- Guests rate listings highly, 4.81 stars on average against 4.73 for the typical market in Ile-de-France, so reviews set a high bar.
- Who books
- About half of guests (49%) travel from abroad, most often from Germany and the United States.
- Who it suits
- It suits buyers who want income that holds up all year and would rather price for occupancy than for rate.
- Registration
- More than eight in ten listings display a registration number, so confirm the local rules before buying.
Revenue per listing by month
€2,950 €1,990- Median listing
- €2,110/mo
- Top 25% of listings
- €3,190+/mo
- Booked ahead
- 54 days
- Average stay
- 6 nights
- Most common home size
- 1 bedroom
- Superhosts
- 51%
2. Saint-Ouen-sur-Seine
Known for: Large market · Growing revenue
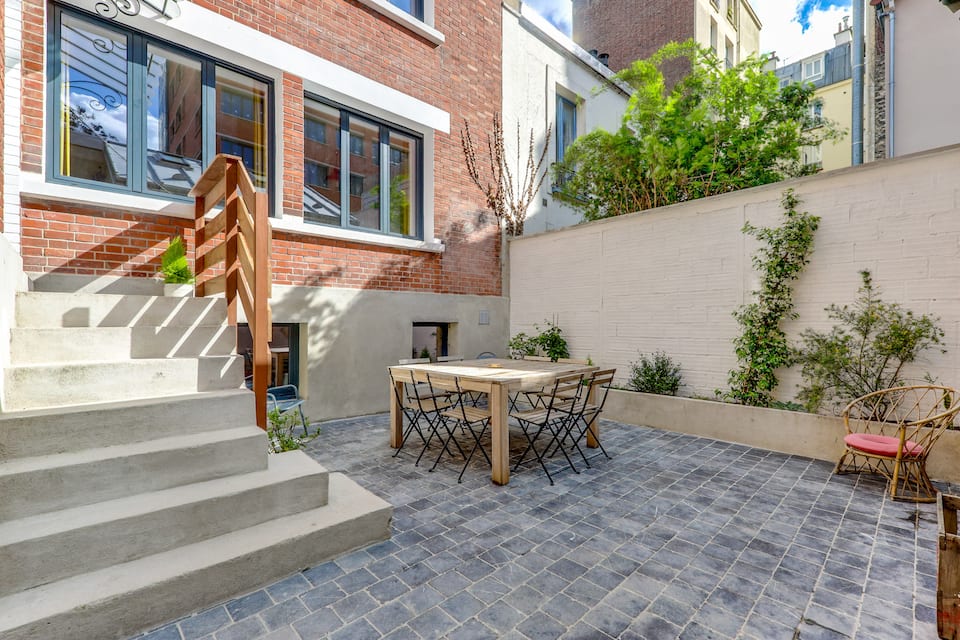


Top-earning Airbnb listings in Saint-Ouen-sur-Seine - Avg. revenue
- €18,600 +32% vs. last year
- Occupancy
- 50%
- Nightly rate
- €130
- Active listings
- 602
Where it places among the 90 ranked markets in Ile-de-France
- Revenue 12th of 90
- Occupancy 14th of 90
- Market size 5th of 90
- Year-round 41st of 90
- Growth 11th of 90
- How it earns
- Rates in Saint-Ouen-sur-Seine sit below the Ile-de-France average, at about €130 a night, but listings are booked on 50% of nights. Moderate rates keep revenue per listing at €18,600, 27% below the Ile-de-France average. In a typical month the median listing brings in about €2,020, and the best quarter clear €3,000. Revenue per listing rose 32% over the year, helped by nightly rates 9% higher.
- When it earns
- Saint-Ouen-sur-Seine has two seasons, April–July and September–October. June is the strongest month at about €2,710 per listing, and February the quietest at about €1,550. Bookings arrive well in advance, about 51 days before check-in, so much of a season's calendar fills early; stays average 6 nights.
- Who books
- Most guests come from abroad (64%), led by visitors from Germany, the United Kingdom and the United States.
- What sells
- The most common entire home has 1 bedroom (54% of entire homes), and apartments and condos make up 90% of supply.
Revenue per listing by month
€2,710 €1,550- Median listing
- €2,020/mo
- Top 25% of listings
- €3,000+/mo
- Booked ahead
- 51 days
- Average stay
- 6 nights
- Guests from abroad
- 64%
- Most common home size
- 1 bedroom
Areas in the full report: Les Docks · Parc des Danes · Stade Bauer
Full Saint-Ouen-sur-Seine Airbnb report3. Serris
Known for: High occupancy · High earnings
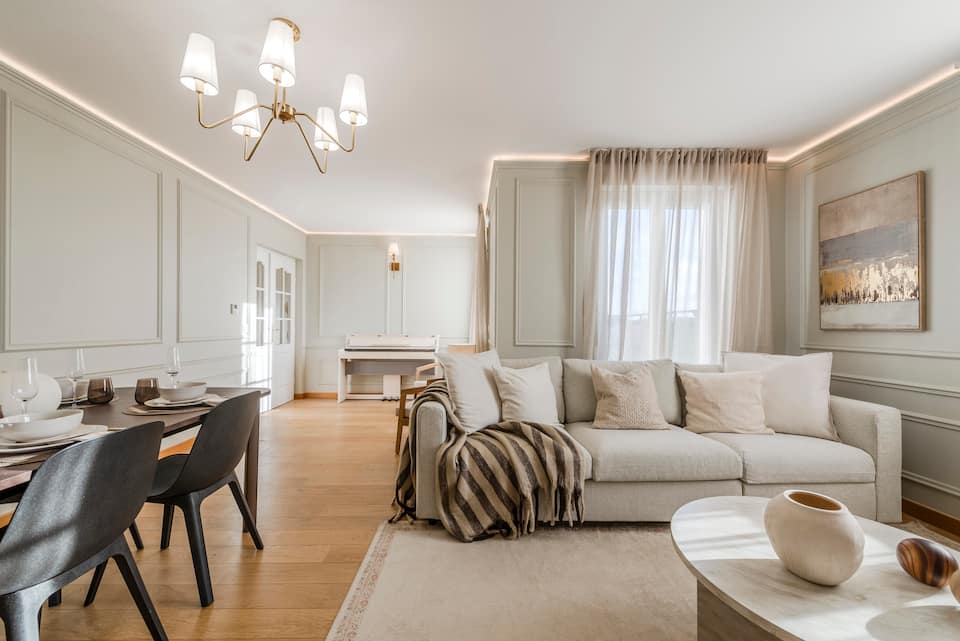
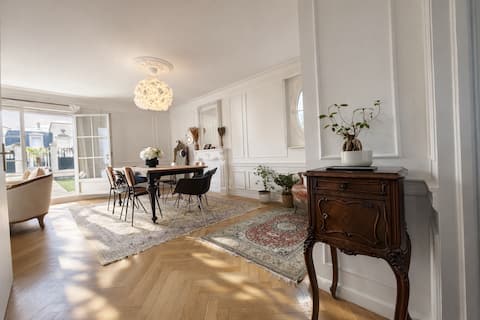

Top-earning Airbnb listings in Serris - Avg. revenue
- €27,600 +31% vs. last year
- Occupancy
- 56%
- Nightly rate
- €160
- Active listings
- 471
Where it places among the 90 ranked markets in Ile-de-France
- Revenue 2nd of 90
- Occupancy 1st of 90
- Market size 10th of 90
- Year-round 86th of 90
- Growth 13th of 90
- How it earns
- Serris earns on volume. Rates run below the Ile-de-France average at about €160 a night, but listings book 56% of nights. Average revenue per listing came to €27,600, the second-highest of the 90 ranked markets. Month to month, the median listing earns about €2,660 and a top-quarter listing €3,640 or more. Revenue per listing rose 31% over the year, helped by nightly rates 8% higher.
- When it earns
- Serris' season runs from April to October, peaking in July at about €3,360 per listing; January, the quietest month, brings in about €1,550. Guests book early, about 72 days ahead against roughly 40 for the typical market in Ile-de-France, and stay about 3 nights. Most hosts take one- or two-night bookings (92% of listings), more than in the typical market.
- Who books
- Most guests come from abroad (69%), led by visitors from the United Kingdom, Germany and Spain.
- What sells
- Two-bedroom homes lead the market (37% of entire homes), and apartments and condos make up 94% of supply.
- Who it suits
- Best for buyers who would rather price for occupancy than for rate.
- Registration
- Registration numbers appear on more than nine in ten listings; check with the local authority before buying.
Revenue per listing by month
€3,360 €1,550- Median listing
- €2,660/mo
- Top 25% of listings
- €3,640+/mo
- Booked ahead
- 72 days
- Average stay
- 3 nights
- Guests from abroad
- 69%
- Most common home size
- 2 bedrooms
Areas in the full report: Val d'Europe · Serris Center · Disneyland Paris
Full Serris Airbnb report4. Clichy
Known for: Large market · High occupancy
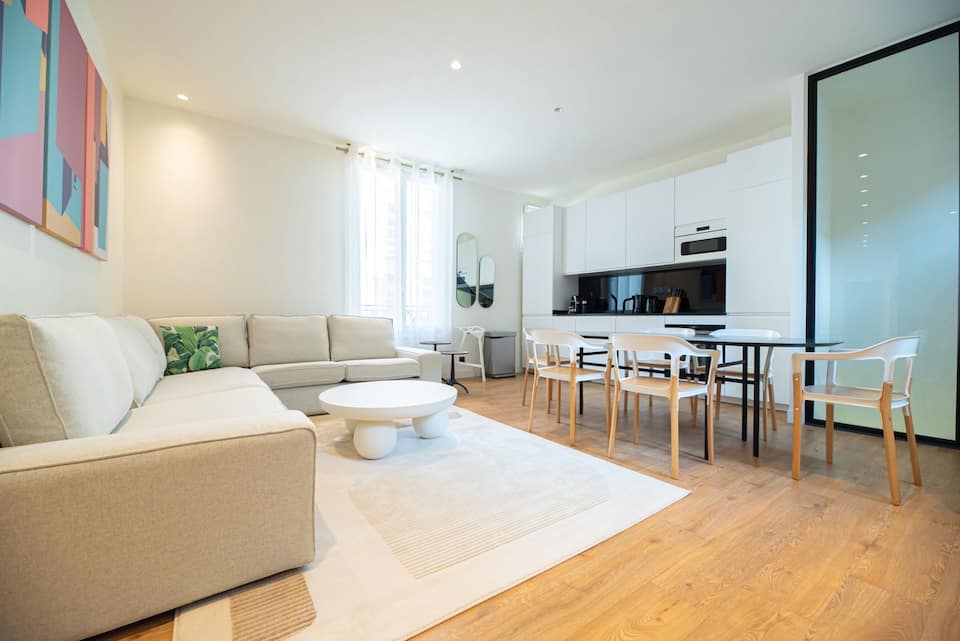
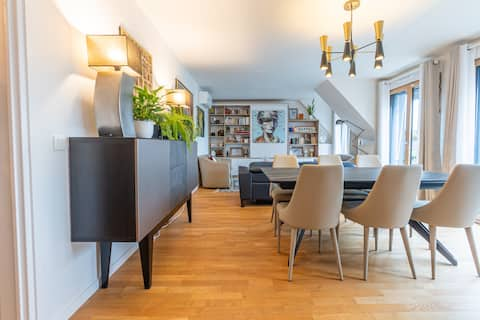
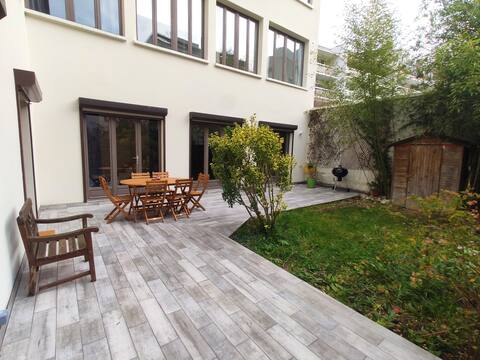
Top-earning Airbnb listings in Clichy - Avg. revenue
- €18,600 +21% vs. last year
- Occupancy
- 50%
- Nightly rate
- €130
- Active listings
- 587
Where it places among the 90 ranked markets in Ile-de-France
- Revenue 13th of 90
- Occupancy 13th of 90
- Market size 6th of 90
- Year-round 41st of 90
- Growth 39th of 90
- How it earns
- Rates in Clichy sit below the Ile-de-France average, at about €130 a night, but listings are booked on 50% of nights. Moderate rates keep revenue per listing at €18,600, 27% below the Ile-de-France average. A typical listing takes in about €1,980 a month; the top quarter clear €3,090 or more. Revenue per listing rose 21% over the year, helped by nightly rates 9% higher.
- When it earns
- Revenue in Clichy peaks twice, over April–July and again over September–October; June leads at about €2,710 per listing, while February brings in about €1,550.
- Who books
- Most guests come from abroad (66%), led by visitors from the United States, Germany and the United Kingdom.
- What sells
- The most common entire home has 1 bedroom (51% of entire homes), and apartments and condos make up 91% of supply.
Revenue per listing by month
€2,710 €1,550- Median listing
- €1,980/mo
- Top 25% of listings
- €3,090+/mo
- Booked ahead
- 45 days
- Average stay
- 6 nights
- Guests from abroad
- 66%
- Most common home size
- 1 bedroom
Areas in the full report: Clichy Town Center · Clichy La Garenne · Clichy Nord
Full Clichy Airbnb report5. Montrouge
Known for: High occupancy · Year-round demand
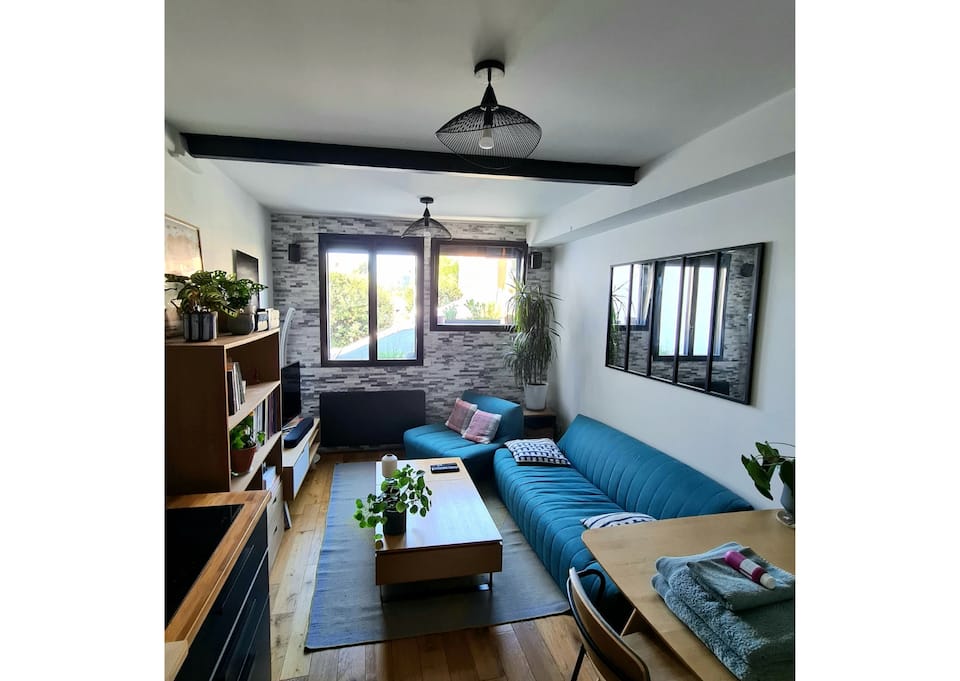


Top-earning Airbnb listings in Montrouge - Avg. revenue
- €18,600 +12% vs. last year
- Occupancy
- 51%
- Nightly rate
- €135
- Active listings
- 294
Where it places among the 90 ranked markets in Ile-de-France
- Revenue 11th of 90
- Occupancy 6th of 90
- Market size 26th of 90
- Year-round 11th of 90
- Growth 70th of 90
- How it earns
- Montrouge earns on volume. Rates run below the Ile-de-France average at about €135 a night, but listings book 51% of nights. Moderate rates keep revenue per listing at €18,600, 27% below the Ile-de-France average. In a typical month the median listing brings in about €1,990, and the best quarter clear €2,880. Revenue per listing rose 12% over the year, helped by nightly rates 6% higher. With 294 listings it is a small market, so its averages can move more from year to year.
- When it earns
- Montrouge earns steadily through the year, from about €1,760 per listing in January to €2,800 in June.
- What sells
- One-bedroom homes lead the market (52% of entire homes), and apartments and condos make up 92% of supply.
- Who it suits
- A good fit for buyers who would rather price for occupancy than for rate and want income that holds up all year.
Revenue per listing by month
€2,800 €1,760- Median listing
- €1,990/mo
- Top 25% of listings
- €2,880+/mo
- Booked ahead
- 47 days
- Average stay
- 6 nights
- Most common home size
- 1 bedroom
- Superhosts
- 38%
6. Issy-les-Moulineaux
Known for: Year-round demand · Large market
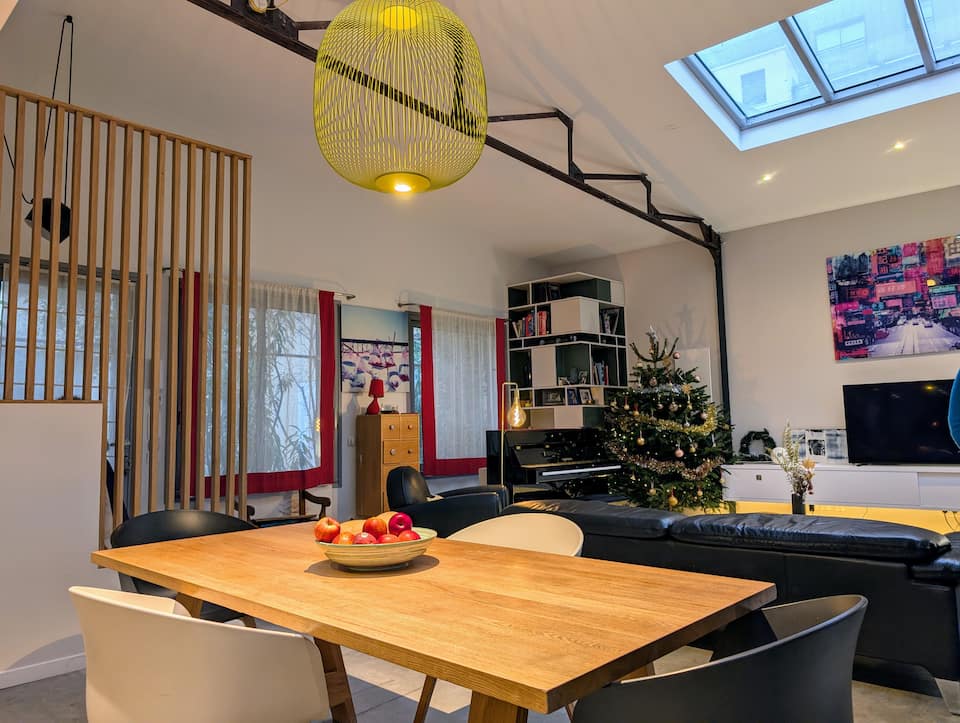
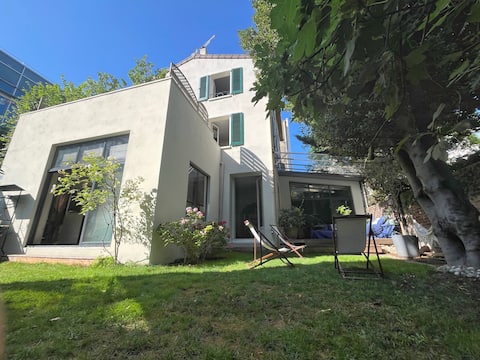

Top-earning Airbnb listings in Issy-les-Moulineaux - Avg. revenue
- €17,700 +18% vs. last year
- Occupancy
- 47%
- Nightly rate
- €150
- Active listings
- 398
Where it places among the 90 ranked markets in Ile-de-France
- Revenue 18th of 90
- Occupancy 23rd of 90
- Market size 16th of 90
- Year-round 6th of 90
- Growth 48th of 90
- How it earns
- Issy-les-Moulineaux is one of the steadier markets in Ile-de-France: November, its slowest month, still brings in about two-thirds of June's revenue. Moderate rates keep revenue per listing at €17,700, 31% below the Ile-de-France average. Month to month, the median listing earns about €1,930 and a top-quarter listing €3,030 or more. Revenue per listing rose 18% over the year, helped by nightly rates 8% higher.
- Who books
- About half of guests (50%) travel from abroad, most often from the United States and the United Kingdom.
- What sells
- The most common entire home has 1 bedroom (48% of entire homes), and apartments and condos make up 89% of supply.
- Who it suits
- It suits buyers who want income that holds up all year.
- Registration
- Nearly three-quarters of listings show a permit or registration number, so check the local rules before buying.
Revenue per listing by month
€2,730 €1,810- Median listing
- €1,930/mo
- Top 25% of listings
- €3,030+/mo
- Booked ahead
- 46 days
- Average stay
- 6 nights
- Most common home size
- 1 bedroom
- Superhosts
- 32%
Areas in the full report: Centre Ville · Ile Seguin · Les Hauts d'Issy
Full Issy-les-Moulineaux Airbnb report7. Paris
Known for: High earnings · Large market
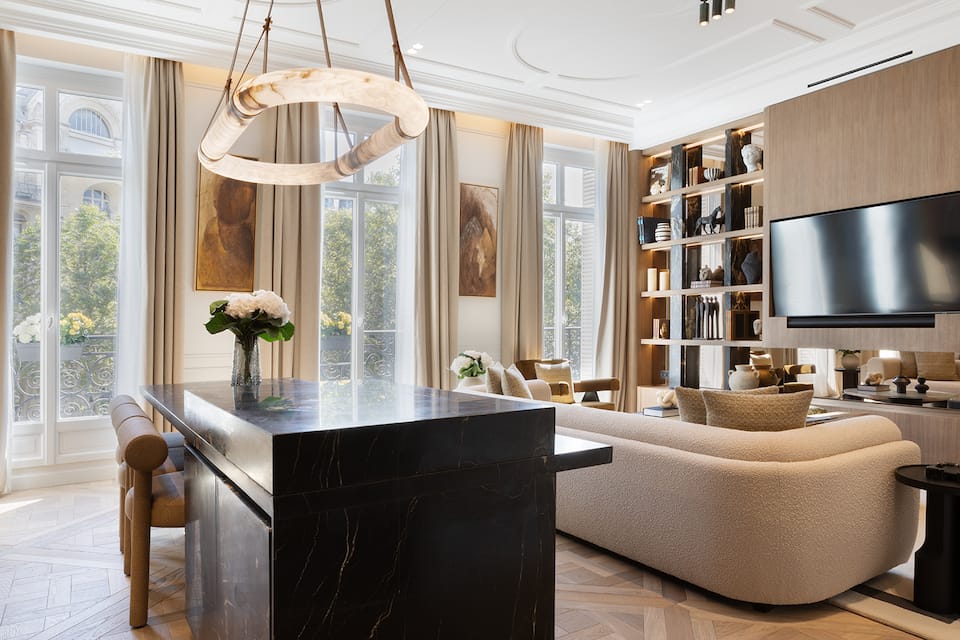
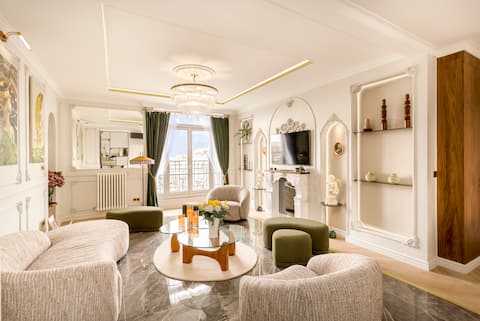
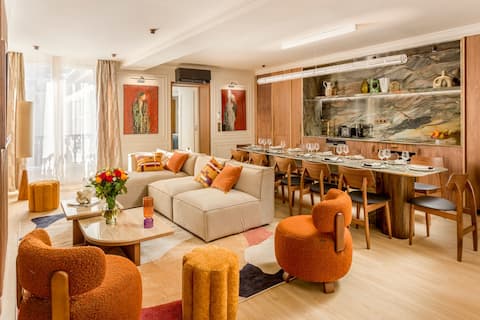
Top-earning Airbnb listings in Paris - Avg. revenue
- €34,400 +13% vs. last year
- Occupancy
- 50%
- Nightly rate
- €250
- Active listings
- 39,900
Where it places among the 90 ranked markets in Ile-de-France
- Revenue 1st of 90
- Occupancy 11th of 90
- Market size 1st of 90
- Year-round 69th of 90
- Growth 67th of 90
- How it earns
- Paris fills more nights than most of Ile-de-France: 50% of them, 3 points above the Ile-de-France average, at about €250 a night. That adds up to €34,400 per listing over the year, the highest of the 90 ranked markets. A typical listing takes in about €3,120 a month; the top quarter clear €5,460 or more. Revenue per listing rose 13% over the year, helped by nightly rates 14% higher.
- When it earns
- Paris has two seasons, April–July and September–October. June is the strongest month at about €5,570 per listing, and February the quietest at about €2,940. Guests plan ahead and stay a while: they book about 57 days out and stay about 7 nights, both well above the typical market in Ile-de-France.
- Who books
- Most guests come from abroad (77%), led by visitors from the United States, the United Kingdom and Germany.
- What sells
- One-bedroom homes lead the market (50% of entire homes), and apartments and condos make up 96% of supply.
- Registration
- A registration number appears on about eight in ten listings; the local authority can say what a new listing needs.
Revenue per listing by month
€5,570 €2,940- Median listing
- €3,120/mo
- Top 25% of listings
- €5,460+/mo
- Booked ahead
- 57 days
- Average stay
- 7 nights
- Guests from abroad
- 77%
- Most common home size
- 1 bedroom
Areas in the full report: Montmartre · Le Marais · Saint-Germain-des-Prés
Full Paris Airbnb report8. Vincennes
Known for: High occupancy · Large market
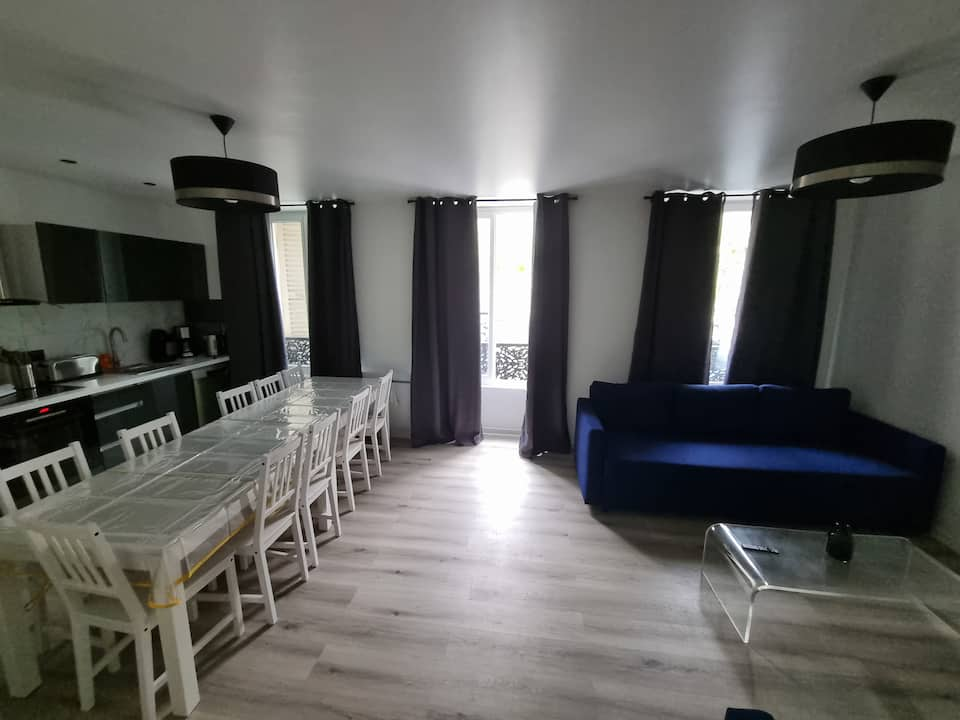
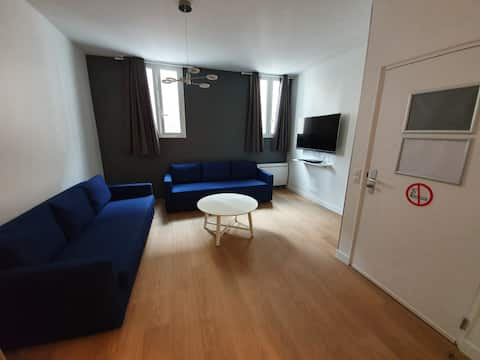
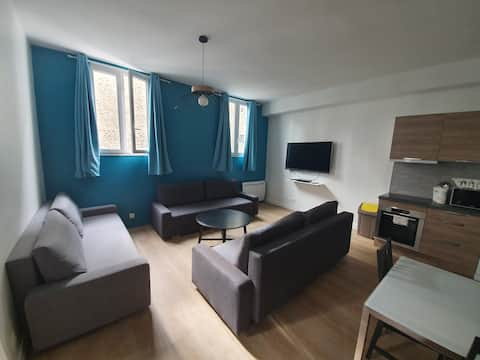
Top-earning Airbnb listings in Vincennes - Avg. revenue
- €20,100 +16% vs. last year
- Occupancy
- 52%
- Nightly rate
- €135
- Active listings
- 331
Where it places among the 90 ranked markets in Ile-de-France
- Revenue 9th of 90
- Occupancy 4th of 90
- Market size 24th of 90
- Year-round 47th of 90
- Growth 57th of 90
- How it earns
- Rates in Vincennes sit below the Ile-de-France average, at about €135 a night, but listings are booked on 52% of nights. Listings averaged €20,100 in revenue over the year, the ninth-highest of the 90 ranked markets. In a typical month the median listing brings in about €2,010, and the best quarter clear €3,040. Revenue per listing rose 16% over the year, helped by nightly rates 11% higher.
- When it earns
- Revenue in Vincennes concentrates from April to October: June earns about €2,840 per listing, about 1.8 times as much as February.
- What sells
- The most common entire home has 1 bedroom (52% of entire homes), and apartments and condos make up 95% of supply.
- Who it suits
- Best for buyers who would rather price for occupancy than for rate.
- Registration
- 86% of listings display a registration number, so confirm the local rules before buying.
Revenue per listing by month
€2,840 €1,580- Median listing
- €2,010/mo
- Top 25% of listings
- €3,040+/mo
- Booked ahead
- 45 days
- Average stay
- 7 nights
- Most common home size
- 1 bedroom
- Superhosts
- 47%
Areas in the full report: Vincennes City Center · Bois de Vincennes · Vincennes Metro Station Area
Full Vincennes Airbnb report9. Chessy
Known for: High earnings · High occupancy
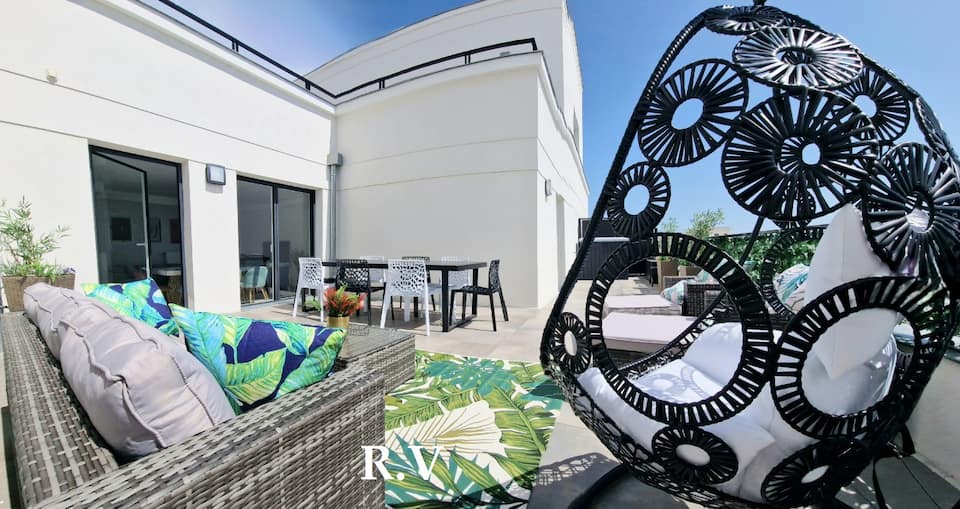


Top-earning Airbnb listings in Chessy - Avg. revenue
- €27,400 +22% vs. last year
- Occupancy
- 54%
- Nightly rate
- €175
- Active listings
- 279
Where it places among the 90 ranked markets in Ile-de-France
- Revenue 3rd of 90
- Occupancy 3rd of 90
- Market size 27th of 90
- Year-round 86th of 90
- Growth 35th of 90
- How it earns
- Chessy earns on volume. Rates run below the Ile-de-France average at about €175 a night, but listings book 54% of nights. Average revenue per listing came to €27,400, the third-highest of the 90 ranked markets. Month to month, the median listing earns about €2,620 and a top-quarter listing €3,710 or more. Revenue per listing rose 22% over the year, helped by nightly rates 8% higher. Its 279 listings make it one of the smaller ranked markets, so its figures are less settled than those of larger ones.
- When it earns
- In Chessy, the months from April to October earn above the yearly average, led by July at about €3,410 per listing; January is the low point at about €1,580. Bookings arrive well in advance, about 69 days before check-in, so much of a season's calendar fills early; stays average 3 nights. Most hosts take one- or two-night bookings (86% of listings), more than in the typical market.
- Who books
- Most guests come from abroad (62%), led by visitors from the United Kingdom, Spain and the United States.
- Guest expectations
- Guests rate listings highly, 4.80 stars on average against 4.73 for the typical market in Ile-de-France, so reviews set a high bar.
- Who it suits
- A good fit for buyers who would rather price for occupancy than for rate.
- Registration
- Registration numbers appear on about nine in ten listings; check with the local authority before buying.
Revenue per listing by month
€3,410 €1,580- Median listing
- €2,620/mo
- Top 25% of listings
- €3,710+/mo
- Booked ahead
- 69 days
- Average stay
- 3 nights
- Guests from abroad
- 62%
- Most common home size
- 2 bedrooms
10. Malakoff
Known for: High occupancy · Year-round demand
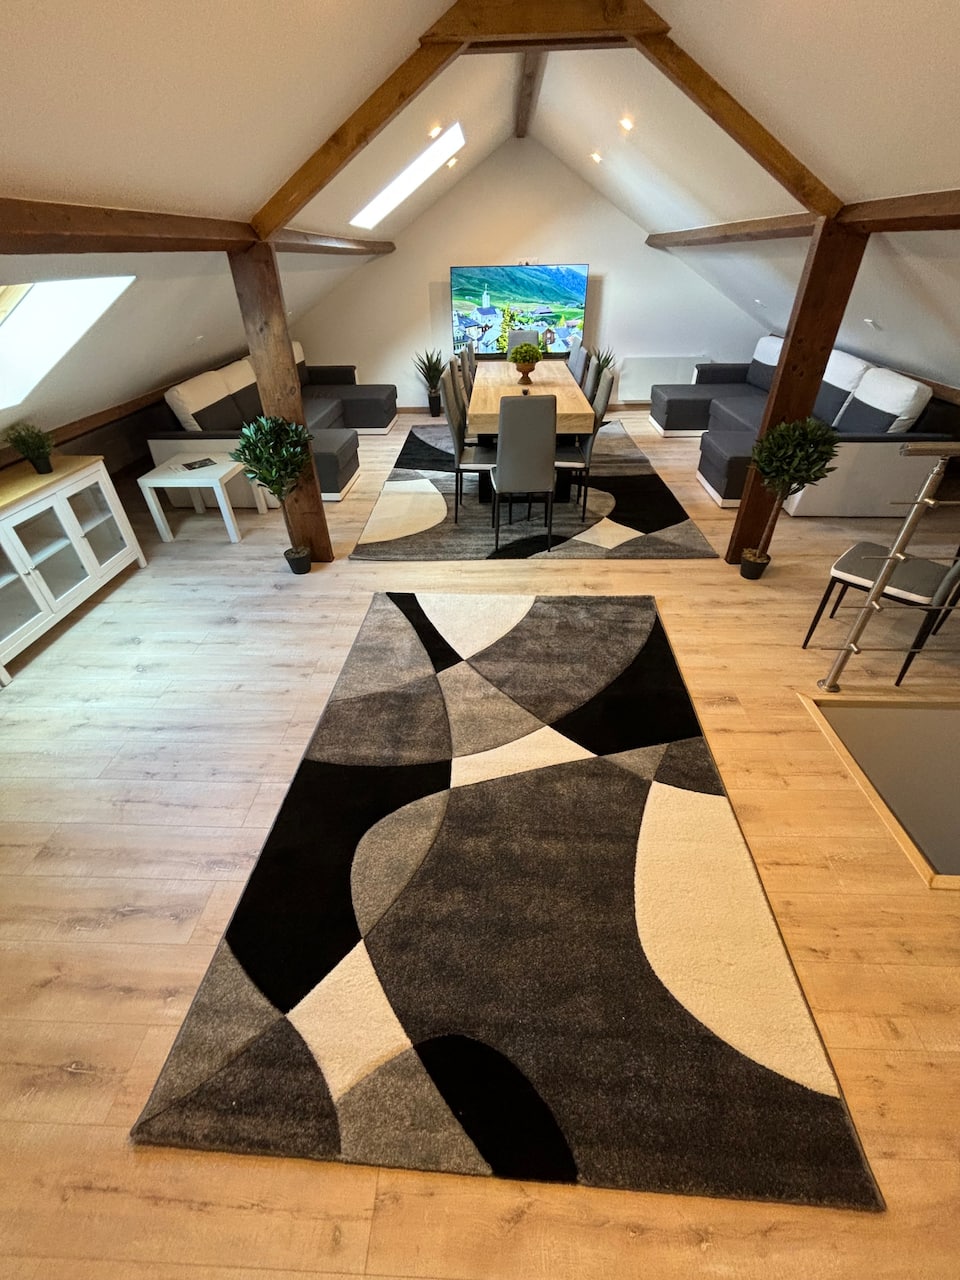


Top-earning Airbnb listings in Malakoff - Avg. revenue
- €21,300 +18% vs. last year
- Occupancy
- 50%
- Nightly rate
- €145
- Active listings
- 198
Where it places among the 90 ranked markets in Ile-de-France
- Revenue 7th of 90
- Occupancy 16th of 90
- Market size 44th of 90
- Year-round 23rd of 90
- Growth 49th of 90
- How it earns
- Rates in Malakoff sit below the Ile-de-France average, at about €145 a night, but listings are booked on 50% of nights. That adds up to €21,300 per listing over the year, the seventh-highest of the 90 ranked markets. A typical listing takes in about €1,970 a month; the top quarter clear €3,040 or more. Revenue per listing rose 18% over the year, helped by nightly rates 6% higher. With 198 listings it is a small market, so its averages can move more from year to year.
- When it earns
- Revenue in Malakoff peaks twice, over April–July and again over September–October; June leads at about €3,070 per listing, while January brings in about €1,830.
- What sells
- One-bedroom homes lead the market (38% of entire homes), and apartments and condos make up 78% of supply.
- Who it suits
- It suits buyers who want income that holds up all year.
- Registration
- Nearly three-quarters of listings show a permit or registration number, so check the local rules before buying.
Revenue per listing by month
€3,070 €1,830- Median listing
- €1,970/mo
- Top 25% of listings
- €3,040+/mo
- Booked ahead
- 44 days
- Average stay
- 6 nights
- Most common home size
- 1 bedroom
- Superhosts
- 43%
Full ranking
How All 90 Ranked Markets in Ile-de-France Compare
The overall ranking with the five measures behind it. "Slow month" is a market's weakest month of revenue as a share of its best, so a higher figure means steadier income. Select a column heading to re-sort.
| Vanves High occupancy, year-round demand | €22,837 | 55% | €148 | 68% | +22% | 232 | |
| Saint-Ouen-sur-Seine Large market, growing revenue | €18,588 | 50% | €131 | 57% | +32% | 602 | |
| Serris High occupancy, high earnings | €27,624 | 56% | €160 | 46% | +31% | 471 | |
| 4 | Clichy Large market, high occupancy | €18,582 | 50% | €131 | 57% | +21% | 587 |
| 5 | Montrouge High occupancy, year-round demand | €18,618 | 51% | €134 | 63% | +12% | 294 |
| 6 | Issy-les-Moulineaux Year-round demand, large market | €17,735 | 47% | €148 | 66% | +18% | 398 |
| 7 | Paris High earnings, large market | €34,414 | 50% | €250 | 53% | +13% | 39,873 |
| 8 | Vincennes High occupancy, large market | €20,130 | 52% | €134 | 56% | +16% | 331 |
| 9 | Chessy High earnings, high occupancy | €27,367 | 54% | €175 | 46% | +22% | 279 |
| 10 | Malakoff High occupancy, year-round demand | €21,272 | 50% | €146 | 60% | +18% | 198 |
| 11 | Levallois-Perret Year-round demand, large market | €17,161 | 46% | €151 | 63% | +23% | 363 |
| 12 | Bagneux High occupancy | €20,633 | 51% | €156 | 57% | +15% | 210 |
| 13 | Montévrain High occupancy, large market | €18,789 | 51% | €134 | 50% | +15% | 445 |
| 14 | Suresnes Growing revenue, year-round demand | €16,939 | 47% | €136 | 60% | +32% | 232 |
| 15 | Bussy-Saint-Georges High occupancy, growing revenue | €17,354 | 52% | €116 | 50% | +30% | 334 |
| 16 | Pantin Year-round demand, growing revenue | €13,643 | 47% | €110 | 63% | +29% | 389 |
| 17 | Puteaux Large market, growing revenue | €18,470 | 46% | €159 | 55% | +24% | 305 |
| 18 | Villejuif Growing revenue, high occupancy | €16,248 | 50% | €113 | 53% | +37% | 338 |
| 19 | Romainville Year-round demand, high occupancy | €14,817 | 50% | €114 | 64% | +23% | 171 |
| 20 | Courbevoie Large market, year-round demand | €15,566 | 45% | €134 | 59% | +22% | 474 |
| 21 | Nanterre Year-round demand, large market | €14,276 | 46% | €118 | 62% | +20% | 373 |
| 22 | Neuilly-sur-Seine Large market | €21,613 | 45% | €214 | 52% | +8% | 422 |
| 23 | Gentilly High occupancy | €17,987 | 49% | €124 | 55% | +20% | 173 |
| 24 | Vitry-sur-Seine Large market, high occupancy | €13,753 | 49% | €100 | 56% | +22% | 421 |
| 25 | Ivry-sur-Seine Large market, year-round demand | €13,510 | 46% | €110 | 61% | +17% | 486 |
| 26 | Magny-le-Hongre High occupancy, growing revenue | €21,839 | 50% | €150 | 45% | +27% | 139 |
| 27 | Clamart Year-round demand | €15,841 | 46% | €142 | 62% | +17% | 210 |
| 28 | Bagnolet Growing revenue | €13,897 | 46% | €131 | 57% | +33% | 243 |
| 29 | Aubervilliers Large market, year-round demand | €13,568 | 45% | €118 | 60% | +21% | 452 |
| 30 | Boulogne-Billancourt Large market | €17,701 | 42% | €189 | 49% | +21% | 866 |
| 31 | Arcueil High occupancy, year-round demand | €14,983 | 51% | €105 | 61% | +6% | 162 |
| 32 | Saint-Denis Large market, year-round demand | €14,826 | 41% | €138 | 59% | +19% | 925 |
| 33 | Alfortville Year-round demand | €13,913 | 47% | €111 | 60% | +20% | 199 |
| 34 | Meudon | €18,209 | 44% | €167 | 58% | +16% | 171 |
| 35 | Versailles Large market | €16,253 | 44% | €147 | 54% | +16% | 496 |
| 36 | Saint-Germain-en-Laye Growing revenue, year-round demand | €13,108 | 45% | €113 | 61% | +36% | 162 |
| 37 | Montreuil Large market, growing revenue | €12,837 | 45% | €114 | 54% | +24% | 769 |
| 38 | Rosny-sous-Bois Growing revenue, year-round demand | €11,785 | 47% | €99 | 60% | +34% | 176 |
| 39 | Saint-Mandé High occupancy | €17,788 | 49% | €148 | 51% | +10% | 155 |
| 40 | Charenton-le-Pont High occupancy | €16,290 | 49% | €125 | 55% | +17% | 135 |
| 41 | Le Pré-Saint-Gervais Growing revenue | €13,767 | 46% | €112 | 55% | +35% | 166 |
| 42 | Asnières-sur-Seine Large market, year-round demand | €13,080 | 44% | €127 | 59% | +14% | 464 |
| 43 | Saint-Cloud | €16,888 | 43% | €151 | 56% | +20% | 169 |
| 44 | Rueil-Malmaison Growing revenue | €13,298 | 43% | €121 | 58% | +27% | 224 |
| 45 | Antony Growing revenue | €12,765 | 46% | €108 | 58% | +27% | 176 |
| 46 | Châtillon Year-round demand | €14,581 | 46% | €121 | 59% | +21% | 102 |
| 47 | Saint-Maur-des-Fossés Growing revenue | €14,214 | 42% | €139 | 55% | +26% | 218 |
| 48 | Le Kremlin-Bicêtre | €17,466 | 47% | €132 | 48% | +10% | 145 |
| 49 | Bezons Year-round demand, growing revenue | €12,549 | 43% | €108 | 65% | +29% | 140 |
| 50 | Nogent-sur-Marne High occupancy | €15,363 | 48% | €136 | 54% | +10% | 125 |
| 51 | La Garenne-Colombes | €15,063 | 46% | €130 | 56% | +17% | 118 |
| 52 | Maisons-Alfort | €12,661 | 44% | €113 | 58% | +15% | 235 |
| 53 | Cachan | €14,007 | 46% | €124 | 56% | +6% | 148 |
| 54 | Palaiseau Year-round demand | €11,165 | 47% | €91 | 70% | +21% | 129 |
| 55 | Houilles Year-round demand, high occupancy | €12,688 | 49% | €101 | 63% | +2% | 107 |
| 56 | Le Perreux-sur-Marne Year-round demand, growing revenue | €13,112 | 44% | €117 | 62% | +23% | 101 |
| 57 | Colombes Year-round demand, large market | €10,625 | 42% | €124 | 64% | +11% | 363 |
| 58 | Créteil Year-round demand | €10,615 | 42% | €109 | 63% | +8% | 250 |
| 59 | Athis-Mons Year-round demand | €10,363 | 45% | €88 | 64% | +18% | 155 |
| 60 | Chelles Growing revenue | €11,892 | 43% | €105 | 56% | +38% | 122 |
| 61 | Moret-Loing-et-Orvanne | €17,066 | 39% | €136 | 54% | +14% | 113 |
| 62 | Champigny-sur-Marne Growing revenue | €10,731 | 40% | €104 | 56% | +33% | 213 |
| 63 | Les Lilas | €12,411 | 44% | €121 | 57% | +7% | 153 |
| 64 | Noisy-le-Grand | €11,415 | 42% | €113 | 55% | +12% | 250 |
| 65 | Le Blanc-Mesnil Growing revenue | €12,895 | 38% | €124 | 53% | +27% | 165 |
| 66 | Choisy-le-Roi Growing revenue | €11,562 | 42% | €103 | 53% | +35% | 153 |
| 67 | Évry-Courcouronnes Year-round demand | €8,994 | 40% | €89 | 71% | +6% | 250 |
| 68 | La Courneuve Year-round demand, growing revenue | €11,419 | 41% | €110 | 61% | +24% | 102 |
| 69 | Cergy Growing revenue | €10,245 | 43% | €100 | 58% | +56% | 124 |
| 70 | Aulnay-sous-Bois Growing revenue | €11,381 | 38% | €114 | 52% | +23% | 226 |
| 71 | Massy | €11,021 | 41% | €102 | 57% | +6% | 210 |
| 72 | Lagny-sur-Marne Growing revenue | €12,144 | 42% | €108 | 46% | +26% | 130 |
| 73 | Fontenay-sous-Bois | €10,721 | 42% | €111 | 54% | +16% | 174 |
| 74 | Savigny-sur-Orge Growing revenue | €10,034 | 41% | €94 | 58% | +40% | 101 |
| 75 | Le Bourget Growing revenue | €11,989 | 38% | €133 | 53% | +24% | 119 |
| 76 | Fontainebleau Large market | €10,717 | 39% | €122 | 46% | +11% | 372 |
| 77 | Orsay Year-round demand | €8,491 | 42% | €82 | 70% | +14% | 118 |
| 78 | Tremblay-en-France Growing revenue | €11,389 | 39% | €101 | 50% | +28% | 138 |
| 79 | Noisy-le-Sec Growing revenue | €10,375 | 45% | €89 | 52% | +25% | 107 |
| 80 | Argenteuil Year-round demand | €8,445 | 36% | €109 | 59% | +12% | 237 |
| 81 | Melun Year-round demand | €8,434 | 37% | €93 | 75% | +7% | 161 |
| 82 | Épinay-sur-Seine | €11,482 | 39% | €103 | 49% | +18% | 116 |
| 83 | Villepinte | €11,621 | 37% | €119 | 52% | +13% | 130 |
| 84 | Maisons-Laffitte | €10,737 | 41% | €105 | 54% | +17% | 102 |
| 85 | Meaux | €8,971 | 39% | €90 | 55% | +14% | 135 |
| 86 | Gagny | €8,619 | 40% | €92 | 56% | +8% | 152 |
| 87 | Drancy | €10,006 | 38% | €101 | 51% | +10% | 167 |
| 88 | Corbeil-Essonnes | €8,841 | 37% | €101 | 58% | +13% | 108 |
| 89 | Sartrouville Year-round demand | €8,750 | 38% | €92 | 59% | +7% | 108 |
| 90 | Sevran | €10,003 | 41% | €95 | 55% | +6% | 105 |
By measure
Ile-de-France Airbnb Markets Ranked by Revenue, Nightly Rate and Occupancy
The overall ranking balances five measures. These lists take one at a time, for buyers who care most about income, pricing power, bookings, a steady calendar, momentum or market size.
Highest-earning Airbnb markets in Ile-de-France
Average annual revenue per active listing over the past 12 months. Markets with at least 200 listings.
| # | Market | Revenue |
|---|---|---|
| Paris #7 overall | €34,400 | |
| Serris #3 overall | €27,600 | |
| Chessy #9 overall | €27,400 | |
| 4 | Vanves #1 overall | €22,800 |
| 5 | Neuilly-sur-Seine #22 overall | €21,600 |
| 6 | Bagneux #12 overall | €20,600 |
| 7 | Vincennes #8 overall | €20,100 |
| 8 | Montévrain #13 overall | €18,800 |
| 9 | Montrouge #5 overall | €18,600 |
| 10 | Saint-Ouen-sur-Seine #2 overall | €18,600 |
| 11 | Clichy #4 overall | €18,600 |
| 12 | Puteaux #17 overall | €18,500 |
| 13 | Issy-les-Moulineaux #6 overall | €17,700 |
| 14 | Boulogne-Billancourt #30 overall | €17,700 |
| 15 | Bussy-Saint-Georges #15 overall | €17,400 |
| 16 | Levallois-Perret #11 overall | €17,200 |
| 17 | Suresnes #14 overall | €16,900 |
| 18 | Versailles #35 overall | €16,300 |
| 19 | Villejuif #18 overall | €16,200 |
| 20 | Clamart #27 overall | €15,800 |
| 21 | Courbevoie #20 overall | €15,600 |
| 22 | Saint-Denis #32 overall | €14,800 |
| 23 | Nanterre #21 overall | €14,300 |
| 24 | Saint-Maur-des-Fossés #47 overall | €14,200 |
| 25 | Bagnolet #28 overall | €13,900 |
Most expensive Airbnb markets in Ile-de-France by nightly rate
Average rate per booked night. A high rate earns most where occupancy holds up too. Markets with at least 200 listings.
| # | Market | Nightly |
|---|---|---|
| Paris #7 overall | €250 | |
| Neuilly-sur-Seine #22 overall | €215 | |
| Boulogne-Billancourt #30 overall | €190 | |
| 4 | Chessy #9 overall | €175 |
| 5 | Serris #3 overall | €160 |
| 6 | Puteaux #17 overall | €160 |
| 7 | Bagneux #12 overall | €155 |
| 8 | Levallois-Perret #11 overall | €150 |
| 9 | Issy-les-Moulineaux #6 overall | €150 |
| 10 | Vanves #1 overall | €150 |
| 11 | Versailles #35 overall | €145 |
| 12 | Clamart #27 overall | €140 |
| 13 | Saint-Maur-des-Fossés #47 overall | €140 |
| 14 | Saint-Denis #32 overall | €140 |
| 15 | Suresnes #14 overall | €135 |
| 16 | Montévrain #13 overall | €135 |
| 17 | Vincennes #8 overall | €135 |
| 18 | Montrouge #5 overall | €135 |
| 19 | Courbevoie #20 overall | €135 |
| 20 | Saint-Ouen-sur-Seine #2 overall | €130 |
| 21 | Clichy #4 overall | €130 |
| 22 | Bagnolet #28 overall | €130 |
| 23 | Asnières-sur-Seine #42 overall | €125 |
| 24 | Colombes #57 overall | €125 |
| 25 | Fontainebleau #76 overall | €120 |
Highest-occupancy Airbnb markets in Ile-de-France
Share of available nights booked over the past 12 months. Markets with at least 200 listings.
| # | Market | Occupancy |
|---|---|---|
| Serris #3 overall | 56% | |
| Vanves #1 overall | 55% | |
| Chessy #9 overall | 54% | |
| 4 | Vincennes #8 overall | 52% |
| 5 | Bussy-Saint-Georges #15 overall | 52% |
| 6 | Montrouge #5 overall | 51% |
| 7 | Montévrain #13 overall | 51% |
| 8 | Bagneux #12 overall | 51% |
| 9 | Paris #7 overall | 50% |
| 10 | Clichy #4 overall | 50% |
| 11 | Saint-Ouen-sur-Seine #2 overall | 50% |
| 12 | Villejuif #18 overall | 50% |
| 13 | Vitry-sur-Seine #24 overall | 49% |
| 14 | Issy-les-Moulineaux #6 overall | 47% |
| 15 | Pantin #16 overall | 47% |
| 16 | Suresnes #14 overall | 47% |
| 17 | Ivry-sur-Seine #25 overall | 46% |
| 18 | Puteaux #17 overall | 46% |
| 19 | Bagnolet #28 overall | 46% |
| 20 | Nanterre #21 overall | 46% |
| 21 | Levallois-Perret #11 overall | 46% |
| 22 | Clamart #27 overall | 46% |
| 23 | Neuilly-sur-Seine #22 overall | 45% |
| 24 | Montreuil #37 overall | 45% |
| 25 | Courbevoie #20 overall | 45% |
Most year-round Airbnb markets in Ile-de-France
Revenue in the slowest month as a share of the best month, so a higher figure means steadier income. Markets with at least 200 listings.
| # | Market | Slow month |
|---|---|---|
| Évry-Courcouronnes #67 overall | 71% | |
| Vanves #1 overall | 68% | |
| Issy-les-Moulineaux #6 overall | 66% | |
| 4 | Colombes #57 overall | 64% |
| 5 | Pantin #16 overall | 63% |
| 6 | Levallois-Perret #11 overall | 63% |
| 7 | Montrouge #5 overall | 63% |
| 8 | Créteil #58 overall | 63% |
| 9 | Nanterre #21 overall | 62% |
| 10 | Clamart #27 overall | 62% |
| 11 | Ivry-sur-Seine #25 overall | 61% |
| 12 | Aubervilliers #29 overall | 60% |
| 13 | Suresnes #14 overall | 60% |
| 14 | Saint-Denis #32 overall | 59% |
| 15 | Courbevoie #20 overall | 59% |
| 16 | Asnières-sur-Seine #42 overall | 59% |
| 17 | Argenteuil #80 overall | 59% |
| 18 | Maisons-Alfort #52 overall | 58% |
| 19 | Rueil-Malmaison #44 overall | 58% |
| 20 | Saint-Ouen-sur-Seine #2 overall | 57% |
| 21 | Clichy #4 overall | 57% |
| 22 | Bagnolet #28 overall | 57% |
| 23 | Bagneux #12 overall | 57% |
| 24 | Massy #71 overall | 57% |
| 25 | Vitry-sur-Seine #24 overall | 56% |
Fastest-growing Airbnb markets in Ile-de-France
Change in revenue per listing from the year before, among markets where it rose. Markets with at least 200 listings.
| # | Market | Change |
|---|---|---|
| Villejuif #18 overall | +37% | |
| Bagnolet #28 overall | +33% | |
| Champigny-sur-Marne #62 overall | +33% | |
| 4 | Saint-Ouen-sur-Seine #2 overall | +32% |
| 5 | Suresnes #14 overall | +32% |
| 6 | Serris #3 overall | +31% |
| 7 | Bussy-Saint-Georges #15 overall | +30% |
| 8 | Pantin #16 overall | +29% |
| 9 | Rueil-Malmaison #44 overall | +27% |
| 10 | Saint-Maur-des-Fossés #47 overall | +26% |
| 11 | Puteaux #17 overall | +24% |
| 12 | Montreuil #37 overall | +24% |
| 13 | Levallois-Perret #11 overall | +23% |
| 14 | Aulnay-sous-Bois #70 overall | +23% |
| 15 | Vitry-sur-Seine #24 overall | +22% |
| 16 | Vanves #1 overall | +22% |
| 17 | Chessy #9 overall | +22% |
| 18 | Courbevoie #20 overall | +22% |
| 19 | Aubervilliers #29 overall | +21% |
| 20 | Clichy #4 overall | +21% |
| 21 | Boulogne-Billancourt #30 overall | +21% |
| 22 | Nanterre #21 overall | +20% |
| 23 | Saint-Denis #32 overall | +19% |
| 24 | Issy-les-Moulineaux #6 overall | +18% |
| 25 | Ivry-sur-Seine #25 overall | +17% |
Largest Airbnb markets in Ile-de-France
Active listings. Bigger markets have more comparable rentals to price against and more buyers at resale.
| # | Market | Listings |
|---|---|---|
| Paris #7 overall | 39,900 | |
| Saint-Denis #32 overall | 925 | |
| Boulogne-Billancourt #30 overall | 866 | |
| 4 | Montreuil #37 overall | 769 |
| 5 | Saint-Ouen-sur-Seine #2 overall | 602 |
| 6 | Clichy #4 overall | 587 |
| 7 | Versailles #35 overall | 496 |
| 8 | Ivry-sur-Seine #25 overall | 486 |
| 9 | Courbevoie #20 overall | 474 |
| 10 | Serris #3 overall | 471 |
| 11 | Asnières-sur-Seine #42 overall | 464 |
| 12 | Aubervilliers #29 overall | 452 |
| 13 | Montévrain #13 overall | 445 |
| 14 | Neuilly-sur-Seine #22 overall | 422 |
| 15 | Vitry-sur-Seine #24 overall | 421 |
| 16 | Issy-les-Moulineaux #6 overall | 398 |
| 17 | Pantin #16 overall | 389 |
| 18 | Nanterre #21 overall | 373 |
| 19 | Fontainebleau #76 overall | 372 |
| 20 | Levallois-Perret #11 overall | 363 |
| 21 | Colombes #57 overall | 363 |
| 22 | Villejuif #18 overall | 338 |
| 23 | Bussy-Saint-Georges #15 overall | 334 |
| 24 | Vincennes #8 overall | 331 |
| 25 | Puteaux #17 overall | 305 |
Seasonality
When Airbnbs in Ile-de-France Earn the Most
June is the best month for about seven in ten ranked markets in Ile-de-France. February is the most common slowest month, in 50 markets.
June earns about 1.9 times what February does
Average revenue per listing across the 90 ranked markets in Ile-de-France, by month
| Month | Avg. revenue per listing | Best month for | Highest-ranked examples |
|---|---|---|---|
| January | €2,610 | – | – |
| February | €2,360 | – | – |
| March | €3,120 | – | – |
| April | €3,530 | – | – |
| May | €3,690 | 1 market | Moret-Loing-et-Orvanne |
| June | €4,380 | 62 markets | Vanves, Saint-Ouen-sur-Seine, Clichy |
| July | €3,700 | 20 markets | Serris, Montévrain, Bussy-Saint-Georges |
| August | €3,080 | 3 markets | Chessy, Cergy, Lagny-sur-Marne |
| September | €3,910 | 3 markets | Bezons, Créteil, Villepinte |
| October | €3,480 | 1 market | Épinay-sur-Seine |
| November | €2,700 | – | – |
| December | €3,060 | – | – |
Average revenue is per listing across the ranked markets, the line in the chart above. "Best month for" counts the ranked markets whose own revenue peaks in that month.
Management
Who Manages Airbnbs in Ile-de-France?
AirROI ranks the 50 largest of the 450 companies that run 5 or more Airbnb listings in Ile-de-France, by listings, guest rating and growth; companies run 18% of its listings.
Method
How the Ranking Works
The ranking covers the 90 markets in Ile-de-France with at least 100 active Airbnb listings and data through October 2026. Each market is compared with the others on five measures, and markets are ordered by a weighted blend of where they place on each:
- Revenue per listing (35%): average revenue an active listing earned over the past 12 months.
- Occupancy (20%): share of available nights that were booked.
- Market size (20%): active listings. Bigger markets offer more comparable rentals to price against and more buyers when you sell.
- Year-round demand (15%): revenue in the slowest month as a share of the best month. The latest month is left out when its bookings look incomplete.
- Growth (10%): change in revenue per listing from the year before. Markets whose boundaries changed between years are scored in the middle.
Left out: 93 markets whose data predate the latest refresh. The score measures how rentals perform. It does not include purchase prices, financing, operating costs or local short-term rental rules, which vary by address and should be checked before buying. Figures are in euros and match each market's own report; see the data methodology for how listings are tracked.
To check one property before buying, run its address and size through the Airbnb income calculator for a revenue, occupancy and nightly-rate range from comparable listings.
FAQ
Frequently Asked Questions About Airbnb Investing in Ile-de-France
What is the best place to buy an Airbnb in Ile-de-France?
Vanves ranks first of the 90 markets in Ile-de-France in AirROI's ranking, with €22,800 in average revenue per listing and 55% occupancy. Saint-Ouen-sur-Seine and Serris follow. The ranking weighs revenue, occupancy, market size, seasonality and growth; it leaves out purchase prices.
What are the most profitable Airbnb locations in Ile-de-France?
By revenue per listing, among markets with at least 200 listings, Paris leads at €34,400 a year, ahead of Serris at €27,600. Profit also depends on what a property costs to buy and run, which varies far more between markets than revenue does.
How much does an Airbnb make in Ile-de-France?
The average active listing in Ile-de-France earned €25,600 over the 12 months to October 2026, at 47% occupancy. Across the ranked markets, the middle half averaged between €11,400 and €16,900 per listing. Averages include listings that operated for only part of the year, so a listing rented all year typically earns more.
What is a good Airbnb occupancy rate in Ile-de-France?
The average listing in Ile-de-France was booked on 47% of available nights over the past 12 months. Half of the ranked markets fall between 41% and 47%, so a market above about 47% sits in the top quarter. Occupancy is only half the picture: a market with lower occupancy can still earn more if its nightly rates are higher.
Where is Airbnb demand highest in Ile-de-France?
Among ranked markets with at least 200 listings, Serris has the highest occupancy, with 56% of available nights booked, followed by Vanves at 55%. Its listings average about €160 a night and €27,600 a year.
Where are Airbnb nightly rates highest in Ile-de-France?
Among ranked markets with at least 200 listings, Paris has the highest average nightly rate, about €250, followed by Neuilly-sur-Seine at €215. Évry-Courcouronnes is the least expensive, at about €89. The average booked night in Ile-de-France costs about €195.
What is the best month for Airbnb in Ile-de-France?
June is the highest-earning month for 62 of the 90 ranked markets, followed by July (20). February is the most common slowest month, in 50 of the 90 markets. Each market's report shows its own month-by-month revenue, occupancy and rates.
Which Airbnb markets in Ile-de-France earn the most evenly through the year?
Among ranked markets with at least 200 listings, Évry-Courcouronnes has the steadiest income: its slowest month, January, still earns about 71% of its best. Vanves follows, at 68%. Steadier markets are easier to budget for, though they do not always earn the most per listing.
Which Airbnb markets are growing fastest in Ile-de-France?
Among ranked markets with at least 200 listings, revenue per listing grew most in Villejuif, up 37% on the year before, and in Bagnolet, up 33%. A single strong year can reflect events or new supply, so it is worth checking a market's monthly trend before relying on it.
Is Airbnb still profitable in Ile-de-France in 2026?
Revenue per listing grew in all 90 ranked markets with a comparable year of data; in the typical market it rose 19%. Whether a given property profits depends on its purchase price, financing and running costs.
What are the best smaller Airbnb markets in Ile-de-France?
Among ranked markets with fewer than 150 active listings, Magny-le-Hongre (#26 overall, €21,800 per listing), Charenton-le-Pont (#40, €16,300) and Châtillon (#46, €14,600) place highest. Smaller markets have fewer comparable rentals to price against, so their averages can move more from year to year.
How many Airbnb listings are there in Ile-de-France?
AirROI tracked 72,900 active Airbnb listings in Ile-de-France over the 12 months to October 2026, across 376 markets. The largest ranked market is Paris, with 39,900 listings, followed by Saint-Denis with 925.
Do Airbnb hosts need a permit in Ile-de-France?
Rules can be national or regional as well as local, and they change often, so check each of them for any address you consider. In the listing data, most listings display a registration number in 29 of the 90 ranked markets, including Vanves, Serris and Issy-les-Moulineaux, though that shows what hosts display, not what the rules allow.
Directory
All 376 Airbnb Markets in Ile-de-France
Every Ile-de-France city with an AirROI Airbnb market report, A–Z, with its active listing count.
A
- Ablon-sur-Seine 18 listings
- Achères 17 listings
- Achères-la-Forêt 35 listings
- Alfortville 199 listings
- Andrésy 23 listings
- Annet-sur-Marne 18 listings
- Antony 176 listings
- Arbonne-la-Forêt 37 listings
- Arcueil 162 listings
- Argenteuil 237 listings
- Arnouville 18 listings
- Arpajon 29 listings
- Asnières-sur-Seine 464 listings
- Athis-Mons 155 listings
- Aubervilliers 452 listings
- Aulnay-sous-Bois 226 listings
- Auvers-sur-Oise 49 listings
- Avon 66 listings
B
- Bagneux 210 listings
- Bagnolet 243 listings
- Bailly 19 listings
- Bailly-Romainvilliers 77 listings
- Barbizon 51 listings
- Beauchamp 17 listings
- Beaumont-sur-Oise 22 listings
- Bezons 140 listings
- Bièvres 19 listings
- Bobigny 96 listings
- Bois-Colombes 93 listings
- Bois-d'Arcy 23 listings
- Bois-le-Roi 46 listings
- Boissy-Saint-Léger 29 listings
- Bondy 95 listings
- Bonneuil-sur-Marne 30 listings
- Bonnières-sur-Seine 24 listings
- Bougival 25 listings
- Boulogne-Billancourt 866 listings
- Bourg-la-Reine 60 listings
- Bourron-Marlotte 35 listings
- Brétigny-sur-Orge 59 listings
- Brie-Comte-Robert 30 listings
- Brou-sur-Chantereine 18 listings
- Brunoy 51 listings
- Bry-sur-Marne 55 listings
- Buc 18 listings
- Bullion 17 listings
- Bures-sur-Yvette 26 listings
- Bussy-Saint-Georges 334 listings
C
- Cachan 148 listings
- Carrières-sous-Poissy 42 listings
- Carrières-sur-Seine 31 listings
- Cergy 124 listings
- Chailly-en-Bière 17 listings
- Chalifert 43 listings
- Champagne-sur-Seine 27 listings
- Champigny-sur-Marne 213 listings
- Champlan 18 listings
- Champs-sur-Marne 79 listings
- Chanteloup-en-Brie 25 listings
- Chanteloup-les-Vignes 17 listings
- Charenton-le-Pont 135 listings
- Château-Landon 21 listings
- Châteaufort 18 listings
- Châtenay-Malabry 65 listings
- Châtillon 102 listings
- Chatou 89 listings
- Chaumes-en-Brie 22 listings
- Chaville 83 listings
- Chelles 122 listings
- Chennevières-sur-Marne 50 listings
- Chessy 279 listings
- Chevilly-Larue 41 listings
- Chevreuse 38 listings
- Chilly-Mazarin 46 listings
- Choisy-le-Roi 153 listings
- Clamart 210 listings
- Claye-Souilly 27 listings
- Clichy 587 listings
- Clichy-sous-Bois 18 listings
- Colombes 363 listings
- Combs-la-Ville 34 listings
- Condé-Sainte-Libiaire 18 listings
- Conflans-Sainte-Honorine 54 listings
- Corbeil-Essonnes 108 listings
- Cormeilles-en-Parisis 68 listings
- Coubron 23 listings
- Coulommiers 37 listings
- Coupvray 49 listings
- Courbevoie 474 listings
- Crécy-la-Chapelle 39 listings
- Créteil 250 listings
- Croissy-sur-Seine 18 listings
- Crosne 18 listings
D
- Dammarie-les-Lys 39 listings
- Dammartin-en-Goële 31 listings
- Dampmart 17 listings
- Deuil-la-Barre 62 listings
- Domont 18 listings
- Dourdan 23 listings
- Drancy 167 listings
- Draveil 41 listings
- Dugny 19 listings
E
- Eaubonne 43 listings
- Élancourt 40 listings
- Émerainville 19 listings
- Enghien-les-Bains 69 listings
- Épinay-sur-Orge 18 listings
- Épinay-sur-Seine 116 listings
- Éragny 26 listings
- Ermont 39 listings
- Esbly 59 listings
- Étampes 61 listings
- Évry-Courcouronnes 250 listings
- Ézanville 23 listings
F
- Ferrières-en-Brie 29 listings
- Fontainebleau 372 listings
- Fontenay-aux-Roses 79 listings
- Fontenay-le-Fleury 25 listings
- Fontenay-sous-Bois 174 listings
- Fosses 24 listings
- Franconville 48 listings
- Fresnes 43 listings
G
- Gagny 152 listings
- Gambais 17 listings
- Garches 55 listings
- Garges-lès-Gonesse 32 listings
- Gennevilliers 84 listings
- Gentilly 173 listings
- Gif-sur-Yvette 49 listings
- Gonesse 32 listings
- Gournay-sur-Marne 34 listings
- Goussainville 64 listings
- Grez-sur-Loing 22 listings
- Groslay 25 listings
- Guérard 18 listings
- Guyancourt 62 listings
H
- Herblay-sur-Seine 33 listings
- Héricy 17 listings
- Houilles 107 listings
I
- Igny 19 listings
- Issy-les-Moulineaux 398 listings
- Ivry-sur-Seine 486 listings
J
- Joinville-le-Pont 65 listings
- Jouars-Pontchartrain 20 listings
- Jouy-en-Josas 51 listings
- Jouy-le-Moutier 17 listings
- Juvisy-sur-Orge 82 listings
L
- L'Étang-la-Ville 18 listings
- L'Haÿ-les-Roses 71 listings
- L'Île-Saint-Denis 33 listings
- L'Isle-Adam 34 listings
- La Celle-Saint-Cloud 26 listings
- La Courneuve 102 listings
- La Ferté-sous-Jouarre 37 listings
- La Frette-sur-Seine 19 listings
- La Garenne-Colombes 118 listings
- La Roche-Guyon 19 listings
- La Ville-du-Bois 21 listings
- Lagny-sur-Marne 130 listings
- Larchant 20 listings
- Le Blanc-Mesnil 165 listings
- Le Bourget 119 listings
- Le Chesnay-Rocquencourt 85 listings
- Le Kremlin-Bicêtre 145 listings
- Le Mée-sur-Seine 35 listings
- Le Mesnil-Amelot 35 listings
- Le Mesnil-le-Roi 25 listings
- Le Mesnil-Saint-Denis 22 listings
- Le Pecq 50 listings
- Le Perreux-sur-Marne 101 listings
- Le Pin 23 listings
- Le Plessis-Bouchard 18 listings
- Le Plessis-Robinson 75 listings
- Le Plessis-Trévise 21 listings
- Le Port-Marly 19 listings
- Le Pré-Saint-Gervais 166 listings
- Le Raincy 47 listings
- Le Thillay 21 listings
- Le Vaudoué 28 listings
- Le Vésinet 64 listings
- Les Clayes-sous-Bois 24 listings
- Les Essarts-le-Roi 17 listings
- Les Lilas 153 listings
- Les Mureaux 25 listings
- Les Pavillons-sous-Bois 55 listings
- Les Ulis 29 listings
- Lésigny 18 listings
- Levallois-Perret 363 listings
- Lieusaint 19 listings
- Limeil-Brévannes 53 listings
- Limetz-Villez 17 listings
- Limours 17 listings
- Linas 25 listings
- Lisses 17 listings
- Livry-Gargan 97 listings
- Lognes 53 listings
- Longjumeau 65 listings
- Louveciennes 26 listings
- Louvres 67 listings
M
- Magny-le-Hongre 139 listings
- Magny-les-Hameaux 36 listings
- Maisons-Alfort 235 listings
- Maisons-Laffitte 102 listings
- Maisse 18 listings
- Malakoff 198 listings
- Mantes-la-Jolie 87 listings
- Mantes-la-Ville 19 listings
- Marcoussis 22 listings
- Marly-le-Roi 55 listings
- Marnes-la-Coquette 19 listings
- Massy 210 listings
- Maule 17 listings
- Maurepas 22 listings
- Meaux 135 listings
- Melun 161 listings
- Mennecy 33 listings
- Méry-sur-Oise 20 listings
- Meudon 171 listings
- Meulan-en-Yvelines 20 listings
- Milly-la-Forêt 82 listings
- Mitry-Mory 49 listings
- Moissy-Cramayel 18 listings
- Montereau-Fault-Yonne 22 listings
- Montesson 22 listings
- Montévrain 445 listings
- Montfermeil 30 listings
- Montfort-l'Amaury 18 listings
- Montgeron 50 listings
- Montigny-le-Bretonneux 65 listings
- Montigny-lès-Cormeilles 27 listings
- Montigny-sur-Loing 47 listings
- Montlhéry 22 listings
- Montmagny 40 listings
- Montmorency 32 listings
- Montreuil 769 listings
- Montrouge 294 listings
- Montry 46 listings
- Morangis 42 listings
- Moret-Loing-et-Orvanne 113 listings
- Morsang-sur-Orge 27 listings
N
- Nanterre 373 listings
- Nanteuil-lès-Meaux 28 listings
- Neauphle-le-Château 19 listings
- Nemours 48 listings
- Neuilly-Plaisance 80 listings
- Neuilly-sur-Marne 62 listings
- Neuilly-sur-Seine 422 listings
- Nogent-sur-Marne 125 listings
- Noisiel 39 listings
- Noisy-le-Grand 250 listings
- Noisy-le-Roi 20 listings
- Noisy-le-Sec 107 listings
- Noisy-sur-École 68 listings
O
- Orgeval 29 listings
- Orly 61 listings
- Ormesson-sur-Marne 18 listings
- Orsay 118 listings
- Osny 41 listings
- Ozoir-la-Ferrière 54 listings
P
- Palaiseau 129 listings
- Pantin 389 listings
- Paray-Vieille-Poste 41 listings
- Paris 39,873 listings
- Parmain 21 listings
- Persan 18 listings
- Pierrefitte-sur-Seine 65 listings
- Pierrelaye 22 listings
- Plaisir 42 listings
- Poigny-la-Forêt 20 listings
- Poissy 66 listings
- Pommeuse 21 listings
- Pomponne 23 listings
- Pontault-Combault 84 listings
- Pontoise 70 listings
- Provins 92 listings
- Puteaux 305 listings
Q
- Quincy-Voisins 47 listings
R
- Rambouillet 89 listings
- Ris-Orangis 42 listings
- Roissy-en-Brie 34 listings
- Roissy-en-France 42 listings
- Romainville 171 listings
- Rosny-sous-Bois 176 listings
- Rueil-Malmaison 224 listings
- Rungis 29 listings
S
- Saclay 22 listings
- Saint-Arnoult-en-Yvelines 17 listings
- Saint-Augustin 22 listings
- Saint-Brice-sous-Forêt 18 listings
- Saint-Chéron 58 listings
- Saint-Cloud 169 listings
- Saint-Cyr-l'École 66 listings
- Saint-Denis 925 listings
- Saint-Fargeau-Ponthierry 35 listings
- Saint-Germain-en-Laye 162 listings
- Saint-Germain-sur-Morin 28 listings
- Saint-Gratien 40 listings
- Saint-Leu-la-Forêt 28 listings
- Saint-Mandé 155 listings
- Saint-Maur-des-Fossés 218 listings
- Saint-Maurice 54 listings
- Saint-Michel-sur-Orge 37 listings
- Saint-Nom-la-Bretèche 21 listings
- Saint-Ouen 44 listings
- Saint-Ouen-l'Aumône 26 listings
- Saint-Ouen-sur-Seine 602 listings
- Saint-Pierre-lès-Nemours 28 listings
- Saint-Prix 33 listings
- Saint-Rémy-l'Honoré 18 listings
- Saint-Rémy-lès-Chevreuse 42 listings
- Saint-Thibault-des-Vignes 19 listings
- Sainte-Geneviève-des-Bois 76 listings
- Saintry-sur-Seine 18 listings
- Samois-sur-Seine 37 listings
- Sannois 33 listings
- Sarcelles 47 listings
- Sartrouville 108 listings
- Savigny-le-Temple 17 listings
- Savigny-sur-Orge 101 listings
- Sceaux 55 listings
- Seine-Port 18 listings
- Serris 471 listings
- Sevran 105 listings
- Sèvres 88 listings
- Soisy-sous-Montmorency 31 listings
- Stains 61 listings
- Sucy-en-Brie 35 listings
- Suresnes 232 listings
T
- Taverny 33 listings
- Thiais 63 listings
- Thomery 31 listings
- Thorigny-sur-Marne 34 listings
- Torcy 72 listings
- Tournan-en-Brie 23 listings
- Trappes 38 listings
- Tremblay-en-France 138 listings
- Triel-sur-Seine 27 listings
U
- Ury 21 listings
V
- Vaires-sur-Marne 61 listings
- Valenton 19 listings
- Vanves 232 listings
- Vaucresson 18 listings
- Vaujours 18 listings
- Vauréal 26 listings
- Vaux-le-Pénil 24 listings
- Vélizy-Villacoublay 33 listings
- Vémars 17 listings
- Verneuil-sur-Seine 18 listings
- Vernouillet 19 listings
- Verrières-le-Buisson 26 listings
- Versailles 496 listings
- Vigneux-sur-Seine 44 listings
- Ville-d'Avray 34 listings
- Villebon-sur-Yvette 19 listings
- Villejuif 338 listings
- Villemomble 69 listings
- Villeneuve-la-Garenne 41 listings
- Villeneuve-le-Comte 21 listings
- Villeneuve-le-Roi 57 listings
- Villeneuve-Saint-Georges 59 listings
- Villeneuve-sous-Dammartin 25 listings
- Villennes-sur-Seine 30 listings
- Villeparisis 59 listings
- Villepinte 130 listings
- Villepreux 18 listings
- Villetaneuse 19 listings
- Villiers-le-Bel 29 listings
- Villiers-sur-Marne 84 listings
- Villiers-sur-Morin 17 listings
- Vincennes 331 listings
- Viroflay 58 listings
- Viry-Châtillon 71 listings
- Vitry-sur-Seine 421 listings
- Voisins-le-Bretonneux 22 listings
W
- Wissous 27 listings
Y
- Yerres 54 listings