AirROI ranking · 202669 markets ranked
Best Places to Buy an Airbnb in Washington State (2026)
Port Angeles is the best place to buy an Airbnb in Washington State in 2026, according to AirROI's ranking of 69 markets. Its listings averaged $54,000 in revenue over the 12 months to October 2026 and were booked on 51% of nights. It leads on the blend rather than on any one measure, placing 3rd of 69 for occupancy, 4th of 69 for market size and 9th of 69 for revenue per listing. Bellingham and Seattle come next.
- Markets tracked
- 232
- Active Airbnb listings
- 27,800
- Avg. revenue per listing
- $38,600
- Occupancy rate
- 44%
- Avg. nightly rate
- $295
- Revenue change, typical market
- +12%
The short answer
Washington State Airbnb Market at a Glance
Across Washington State, the 27,800 active Airbnb listings tracked by AirROI, a short-term-rental data firm, averaged $38,600 over the same period. They were booked on 44% of nights at about $295 a night; the ranking covers the 69 markets with at least 100 active listings. Revenue per listing rose in 68 of the 69 ranked markets with a comparable year of data, by 12% in the typical one.
The ranking weighs revenue per listing most, then occupancy and market size, then how evenly income spreads across the year and how it changed on the year. It reflects rental performance, not purchase prices or local short-term rental rules. How the ranking works.
Where the top 10 Airbnb markets in Washington State are
Each dot is one of the 232 markets AirROI tracks in Washington State, sized by active listings and coloured by average revenue per listing. Select a number to jump to its profile.
Top 10
The Top 10 Airbnb Markets in Washington State
Each profile draws on the market's full AirROI report: how it earns, when in the year, who books and what sells. Monthly figures are averages per listing active in that month, so twelve of them add up to more than the annual average, which also counts listings that operated for only part of the year.
| # | Market | Avg. revenue | Occupancy |
|---|---|---|---|
 Port Angeles High occupancy · Large market | $54,000 | 51% | |
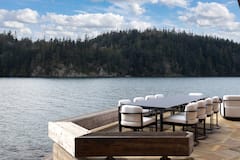 Bellingham High occupancy · Large market | $39,300 | 52% | |
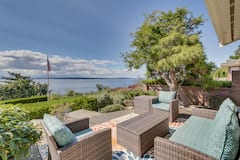 Seattle Large market · High occupancy | $41,700 | 50% | |
| 4 | 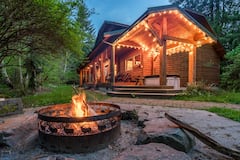 Ashford High occupancy · Large market | $51,600 | 51% |
| 5 | 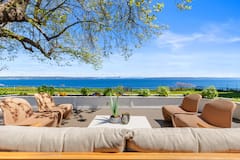 Bainbridge Island High occupancy · High earnings | $52,100 | 48% |
| 6 |  Forks High occupancy · Large market | $46,500 | 50% |
| 7 |  Cle Elum High earnings · Large market | $70,300 | 34% |
| 8 |  Bremerton High occupancy · Growing revenue | $37,200 | 49% |
| 9 |  Leavenworth High earnings · Large market | $58,000 | 43% |
| 10 |  Friday Harbor High earnings | $59,500 | 44% |
1. Port Angeles
Known for: High occupancy · Large market
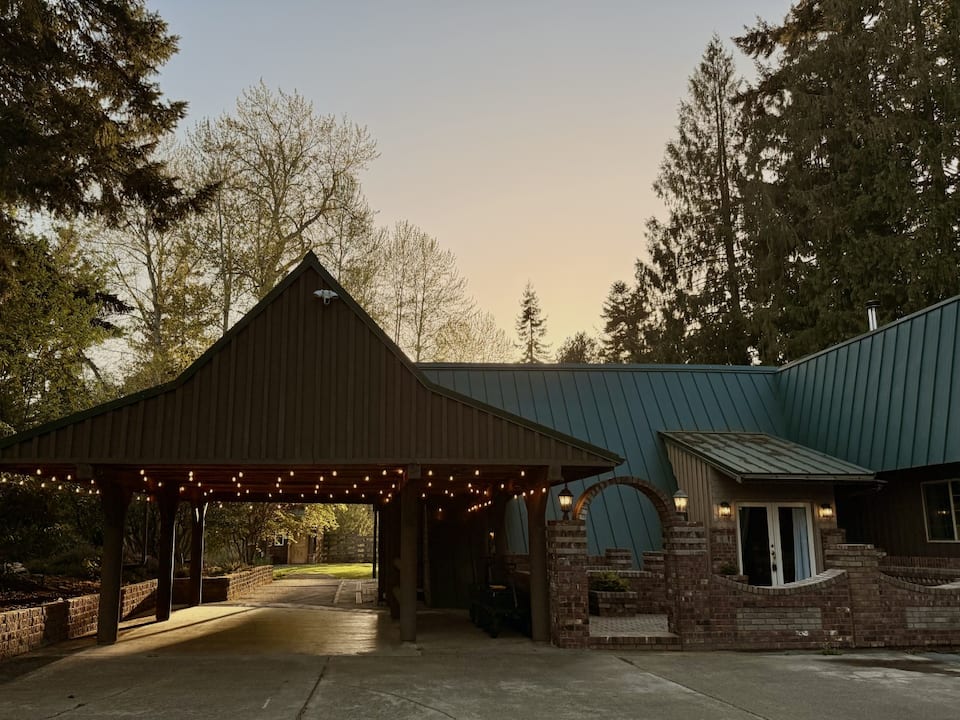


Top-earning Airbnb listings in Port Angeles - Avg. revenue
- $54,000 +15% vs. last year
- Occupancy
- 51%
- Nightly rate
- $320
- Active listings
- 731
Where it places among the 69 ranked markets in Washington State
- Revenue 9th of 69
- Occupancy 3rd of 69
- Market size 4th of 69
- Year-round 62nd of 69
- Growth 22nd of 69
- How it earns
- Port Angeles fills more nights than most of Washington State: 51% of them, the third-highest occupancy of the 69 ranked markets, at about $320 a night. That adds up to $54,000 per listing over the year, the ninth-highest of the 69 ranked markets. A typical listing takes in about $4,520 a month; the top quarter clear $7,350 or more. Revenue per listing rose 15% over the year, helped by nightly rates 17% higher.
- When it earns
- Port Angeles' season runs from May to September, peaking in July at about $10,700 per listing; January, the quietest month, brings in about $2,320.
- What sells
- The most common entire home has 1 bedroom (37% of entire homes), and houses make up 53% of supply.
- Who it suits
- It suits buyers who can carry costs through a quiet January.
Revenue per listing by month
$10,700 $2,320- Median listing
- $4,520/mo
- Top 25% of listings
- $7,350+/mo
- Booked ahead
- 57 days
- Average stay
- 4 nights
- Most common home size
- 1 bedroom
- Superhosts
- 80%
Areas in the full report: Downtown Port Angeles · Ediz Hook · Port Angeles East
Full Port Angeles Airbnb report2. Bellingham
Known for: High occupancy · Large market
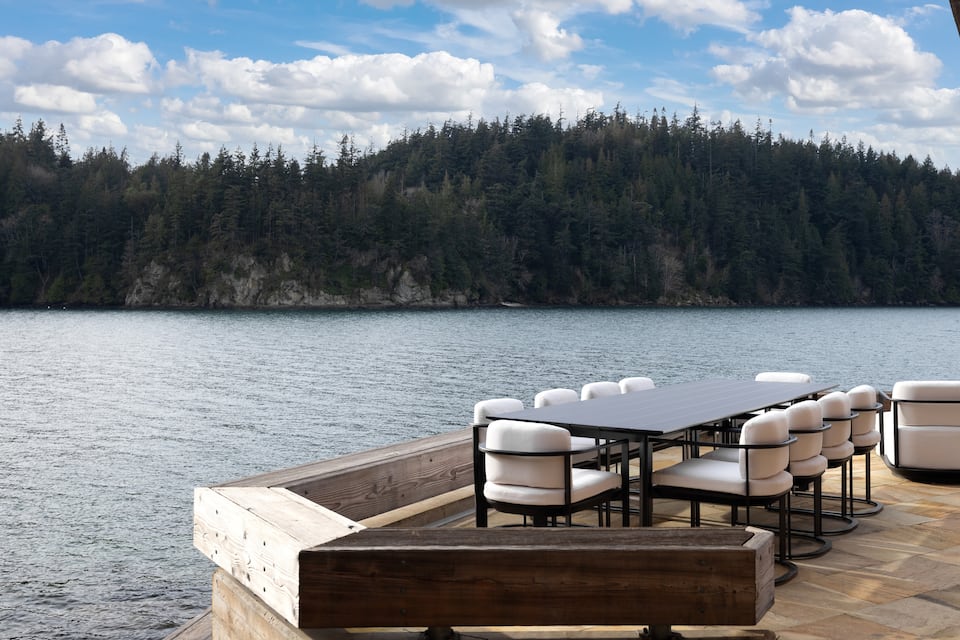

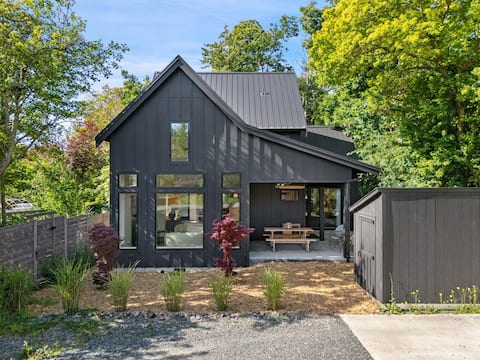
Top-earning Airbnb listings in Bellingham - Avg. revenue
- $39,300 +20% vs. last year
- Occupancy
- 52%
- Nightly rate
- $245
- Active listings
- 380
Where it places among the 69 ranked markets in Washington State
- Revenue 28th of 69
- Occupancy 1st of 69
- Market size 10th of 69
- Year-round 21st of 69
- Growth 15th of 69
- How it earns
- Bellingham earns on volume. Rates run below the Washington State average at about $245 a night, but listings book 52% of nights. Revenue per listing, $39,300, is close to the Washington State average. In a typical month the median listing brings in about $3,300, and the best quarter clear $5,340. Revenue per listing rose 20% over the year, helped by nightly rates 17% higher.
- When it earns
- Revenue in Bellingham concentrates from June to September: July earns about $6,540 per listing, about 2.6 times as much as January.
- What sells
- One-bedroom homes lead the market (37% of entire homes), and houses make up 52% of supply.
- Who it suits
- Best for buyers who would rather price for occupancy than for rate and can ride out a slow January.
Revenue per listing by month
$6,540 $2,510- Median listing
- $3,300/mo
- Top 25% of listings
- $5,340+/mo
- Booked ahead
- 52 days
- Average stay
- 5 nights
- Most common home size
- 1 bedroom
- Superhosts
- 75%
Areas in the full report: Fairhaven · Downtown Bellingham · California Hill
Full Bellingham Airbnb report3. Seattle
Known for: Large market · High occupancy
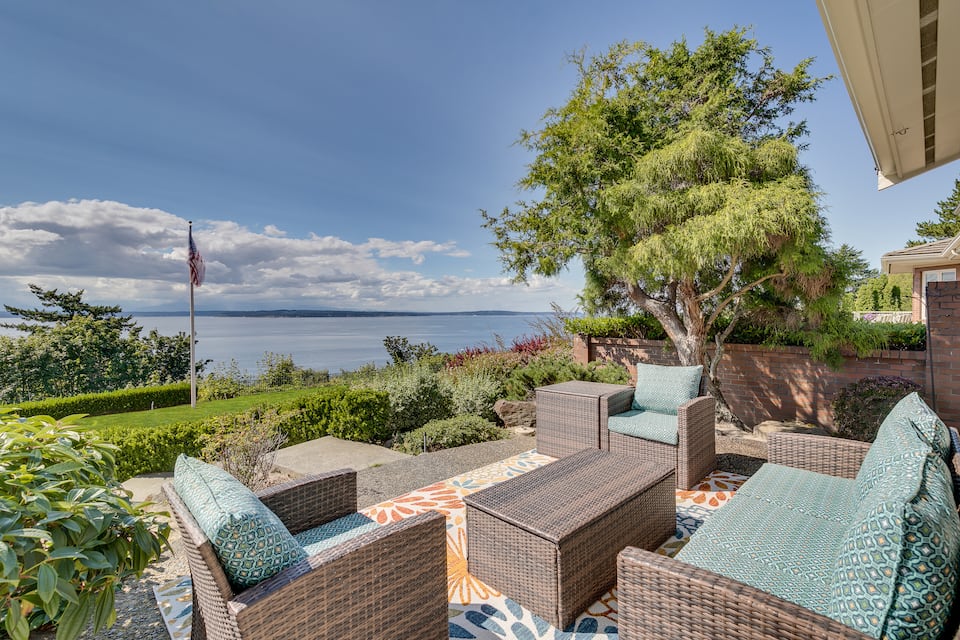
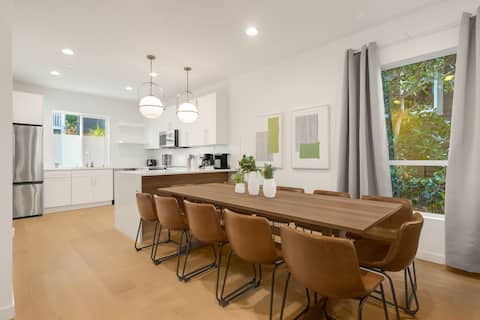
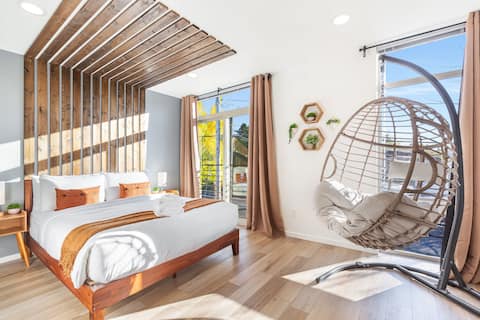
Top-earning Airbnb listings in Seattle - Avg. revenue
- $41,700 +19% vs. last year
- Occupancy
- 50%
- Nightly rate
- $270
- Active listings
- 5,450
Where it places among the 69 ranked markets in Washington State
- Revenue 23rd of 69
- Occupancy 5th of 69
- Market size 1st of 69
- Year-round 44th of 69
- Growth 16th of 69
- How it earns
- Listings in Seattle are booked on 50% of nights, the fifth-highest occupancy of the 69 ranked markets, at about $270 a night. Average revenue per listing came to $41,700, 8% above the Washington State average. Month to month, the median listing earns about $3,730 and a top-quarter listing $6,090 or more. Revenue per listing rose 19% over the year, helped by nightly rates 24% higher.
- When it earns
- In Seattle, the months from June to September earn above the yearly average, led by June at about $7,770 per listing; February is the low point at about $2,440. Trips run long, about 6 nights on average against 4 nights for the typical market in Washington State, booked about 43 days ahead.
- What sells
- The most common entire home has 1 bedroom (35% of entire homes), and houses make up 53% of supply.
- Who books
- Guests are overwhelmingly domestic (89%); the most common home cities are Portland and New York.
- Who it suits
- A good fit for buyers who are prepared for thin bookings around February.
- Registration
- Nearly nine in ten listings display a registration number, so confirm the local rules before buying.
Revenue per listing by month
$7,770 $2,440- Median listing
- $3,730/mo
- Top 25% of listings
- $6,090+/mo
- Booked ahead
- 43 days
- Average stay
- 6 nights
- Most common home size
- 1 bedroom
- Superhosts
- 69%
Areas in the full report: Capitol Hill · Pike Place Market · South Lake Union
Full Seattle Airbnb report4. Ashford
Known for: High occupancy · Large market
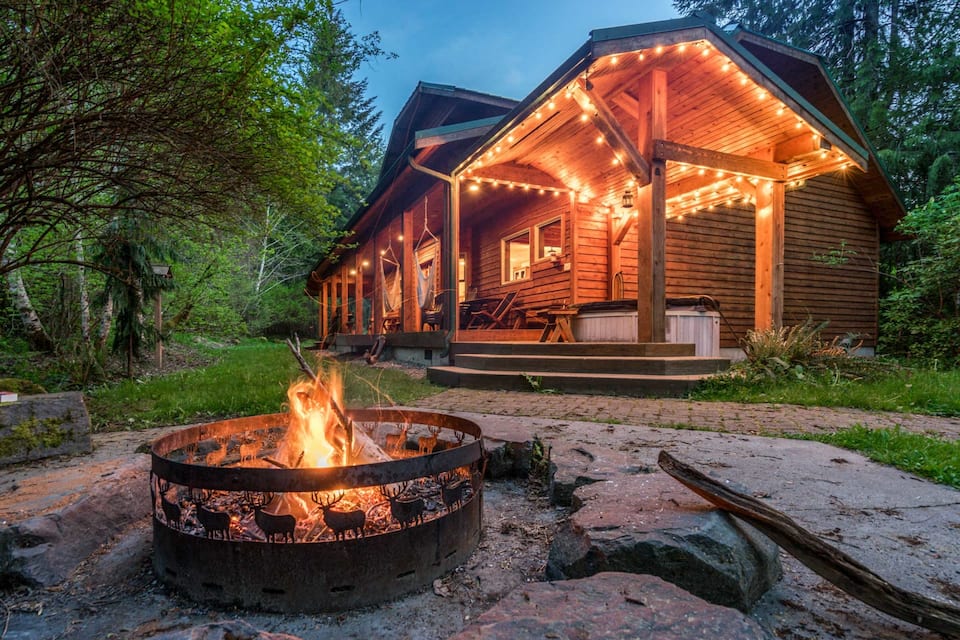


Top-earning Airbnb listings in Ashford - Avg. revenue
- $51,600 +11% vs. last year
- Occupancy
- 51%
- Nightly rate
- $280
- Active listings
- 361
Where it places among the 69 ranked markets in Washington State
- Revenue 12th of 69
- Occupancy 2nd of 69
- Market size 11th of 69
- Year-round 57th of 69
- Growth 36th of 69
- How it earns
- Demand runs high in Ashford: 51% of nights booked, the second-highest occupancy of the 69 ranked markets, at about $280 a night. That adds up to $51,600 per listing over the year, 34% above the Washington State average. A typical listing takes in about $4,710 a month; the top quarter clear $6,650 or more. Revenue per listing rose 11% over the year, helped by nightly rates 12% higher, even as the number of listings grew 28%.
- When it earns
- Ashford's season runs from June to September, peaking in July at about $9,840 per listing; February, the quietest month, brings in about $2,410. Stays are shorter than in most of Washington State, about 2.5 nights, so listings turn over often; guests book about 53 days ahead. Most hosts take one- or two-night bookings (99% of listings), more than in the typical market.
- What sells
- Two-bedroom homes lead the market (36% of entire homes), and cabins, campers and other outdoor stays make up 70% of supply.
- Who it suits
- It suits buyers who can carry costs through a quiet February.
Revenue per listing by month
$9,840 $2,410- Median listing
- $4,710/mo
- Top 25% of listings
- $6,650+/mo
- Booked ahead
- 53 days
- Average stay
- 2.5 nights
- Most common home size
- 2 bedrooms
- Superhosts
- 85%
Areas in the full report: Mount Rainier National Park · Ashford Village · Elbe
Full Ashford Airbnb report5. Bainbridge Island
Known for: High occupancy · High earnings
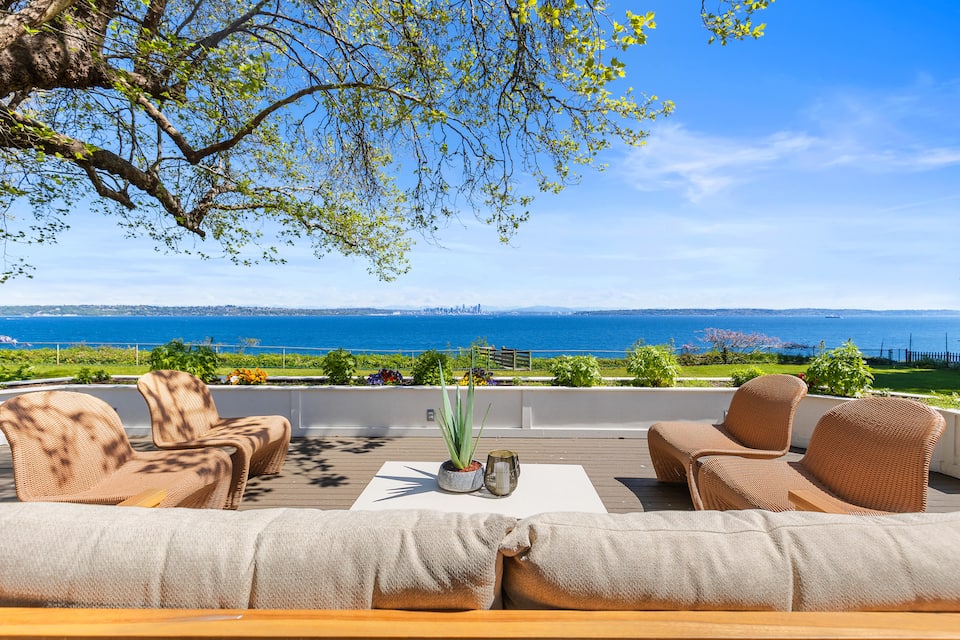
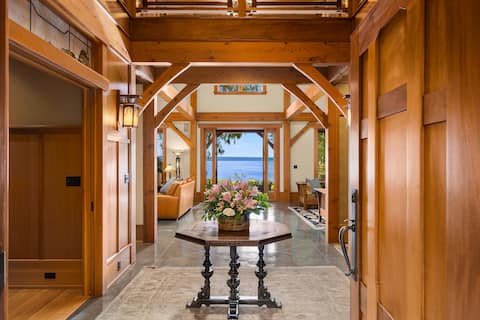
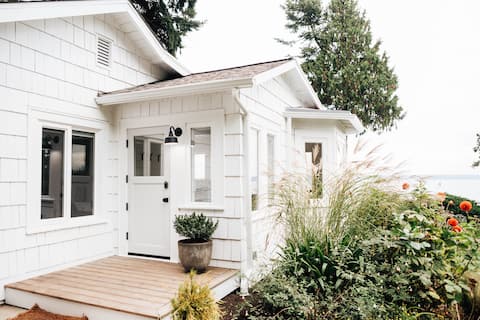
Top-earning Airbnb listings in Bainbridge Island - Avg. revenue
- $52,100 +20% vs. last year
- Occupancy
- 48%
- Nightly rate
- $350
- Active listings
- 147
Where it places among the 69 ranked markets in Washington State
- Revenue 11th of 69
- Occupancy 10th of 69
- Market size 40th of 69
- Year-round 31st of 69
- Growth 12th of 69
- How it earns
- Bainbridge Island books 48% of available nights, the tenth-highest occupancy of the 69 ranked markets, and charges about $350 a night. Listings averaged $52,100 in revenue over the year, 35% above the Washington State average. In a typical month the median listing brings in about $3,970, and the best quarter clear $6,950. Revenue per listing rose 20% over the year, helped by nightly rates 19% higher. With 147 listings it is a small market, so its averages can move more from year to year.
- When it earns
- Revenue in Bainbridge Island concentrates from June to September: July earns about $8,170 per listing, about 2.9 times as much as February.
- What sells
- The most common entire home has 1 bedroom (35% of entire homes), and houses make up 57% of supply.
- Who it suits
- Best for buyers who can ride out a slow February.
Revenue per listing by month
$8,170 $2,860- Median listing
- $3,970/mo
- Top 25% of listings
- $6,950+/mo
- Booked ahead
- 53 days
- Average stay
- 5 nights
- Most common home size
- 1 bedroom
- Superhosts
- 66%
6. Forks
Known for: High occupancy · Large market

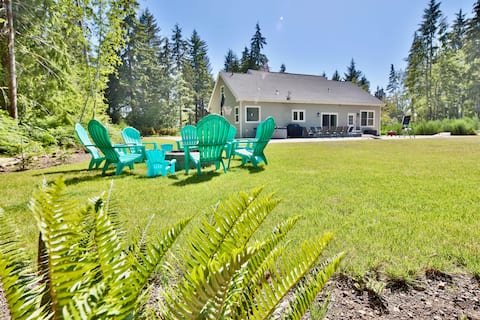

Top-earning Airbnb listings in Forks - Avg. revenue
- $46,500 +20% vs. last year
- Occupancy
- 50%
- Nightly rate
- $250
- Active listings
- 358
Where it places among the 69 ranked markets in Washington State
- Revenue 17th of 69
- Occupancy 4th of 69
- Market size 12th of 69
- Year-round 64th of 69
- Growth 13th of 69
- How it earns
- Rates in Forks sit below the Washington State average, at about $250 a night, but listings are booked on 50% of nights. Average revenue per listing came to $46,500, 21% above the Washington State average. Month to month, the median listing earns about $4,030 and a top-quarter listing $5,910 or more. Revenue per listing rose 20% over the year, helped by nightly rates 18% higher, even as the number of listings grew 22%.
- When it earns
- In Forks, the months from May to September earn above the yearly average, led by July at about $8,350 per listing; January is the low point at about $1,730. Visits are quick, about 2.7 nights on average against 4 nights for the typical market in Washington State, booked about 49 days ahead. Most hosts take one- or two-night bookings (95% of listings), more than in the typical market.
- What sells
- One-bedroom homes lead the market (46% of entire homes), and houses make up 51% of supply.
- Who it suits
- A good fit for buyers who are prepared for thin bookings around January and would rather price for occupancy than for rate.
Revenue per listing by month
$8,350 $1,730- Median listing
- $4,030/mo
- Top 25% of listings
- $5,910+/mo
- Booked ahead
- 49 days
- Average stay
- 2.7 nights
- Most common home size
- 1 bedroom
- Superhosts
- 84%
Areas in the full report: Hoh Rain Forest · La Push · Forks
Full Forks Airbnb report7. Cle Elum
Known for: High earnings · Large market
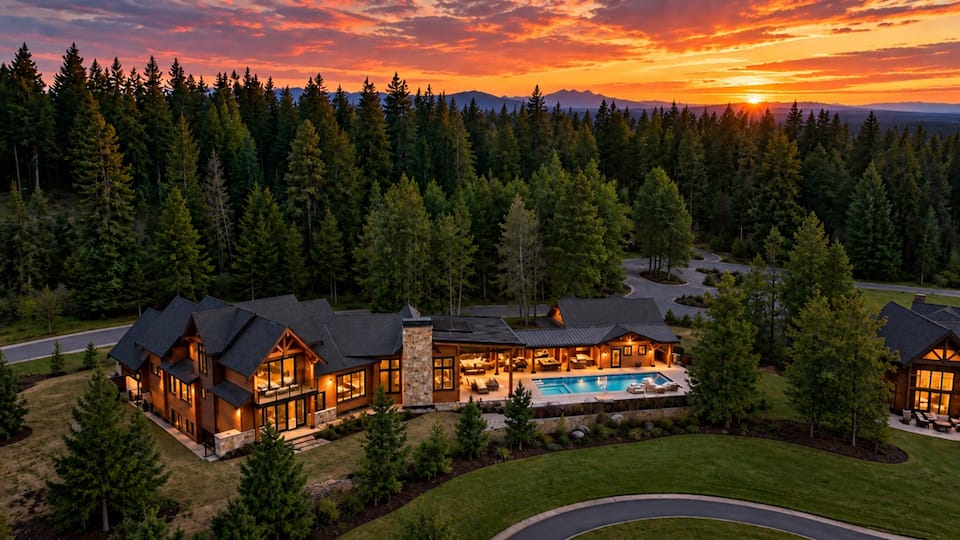


Top-earning Airbnb listings in Cle Elum - Avg. revenue
- $70,300 +12% vs. last year
- Occupancy
- 34%
- Nightly rate
- $660
- Active listings
- 493
Where it places among the 69 ranked markets in Washington State
- Revenue 1st of 69
- Occupancy 65th of 69
- Market size 7th of 69
- Year-round 21st of 69
- Growth 35th of 69
- How it earns
- Cle Elum earns on price: guests pay about $660 a night, about 2.2 times the Washington State average. That adds up to $70,300 per listing over the year, the highest of the 69 ranked markets. A typical listing takes in about $5,540 a month; the top quarter clear $9,710 or more. Revenue per listing rose 12% over the year, helped by nightly rates 10% higher, even as the number of listings grew 17%.
- When it earns
- Cle Elum's season runs from June to August, peaking in July at about $11,600 per listing; March, the quietest month, brings in about $4,420. Stays are shorter than in most of Washington State, about 3 nights, so listings turn over often; guests book about 58 days ahead. Most hosts take one- or two-night bookings (94% of listings), more than in the typical market.
- What sells
- Big homes set the market: 77% of entire homes have three or more bedrooms, against about 40% in the typical market in Washington State, and houses make up 70% of supply.
- The competition
- Professional managers run 39% of listings, against about 12% in the typical market in Washington State, and the largest operator runs 66 listings, so new hosts compete with polished operations.
- Who it suits
- It suits buyers who can furnish and price for a premium stay and want a large home for groups and families.
Revenue per listing by month
$11,600 $4,420- Median listing
- $5,540/mo
- Top 25% of listings
- $9,710+/mo
- Booked ahead
- 58 days
- Average stay
- 3 nights
- Most common home size
- 5+ bedrooms
- Superhosts
- 63%
Areas in the full report: Downtown Cle Elum · Suncadia Resort · Cle Elum Lake
Full Cle Elum Airbnb report8. Bremerton
Known for: High occupancy · Growing revenue
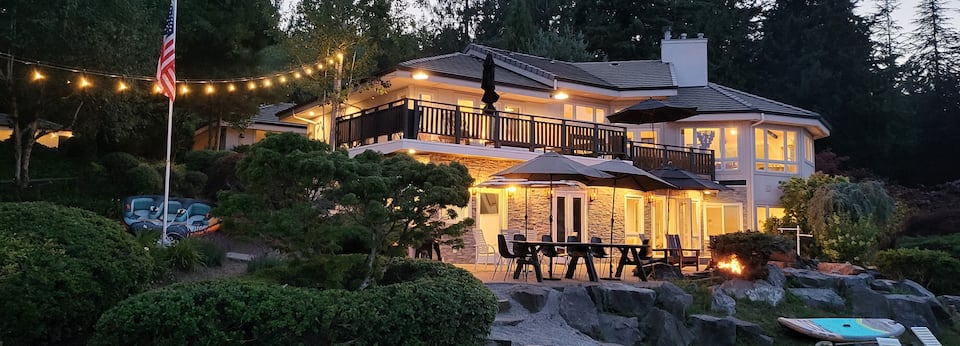

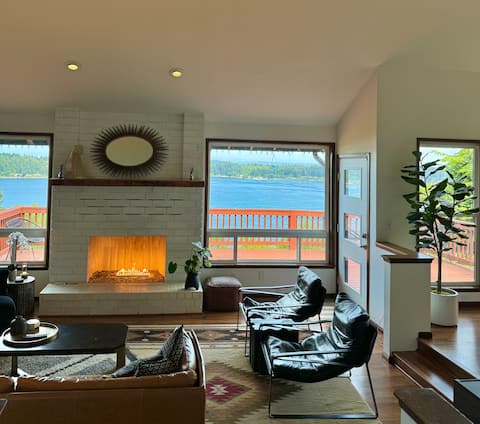
Top-earning Airbnb listings in Bremerton - Avg. revenue
- $37,200 +17% vs. last year
- Occupancy
- 49%
- Nightly rate
- $250
- Active listings
- 197
Where it places among the 69 ranked markets in Washington State
- Revenue 32nd of 69
- Occupancy 7th of 69
- Market size 26th of 69
- Year-round 25th of 69
- Growth 19th of 69
- How it earns
- Bremerton earns on volume. Rates run below the Washington State average at about $250 a night, but listings book 49% of nights. Revenue per listing, $37,200, is close to the Washington State average. Its place at #8 rests on occupancy (7th of 69) rather than on revenue per listing. In a typical month the median listing brings in about $3,320, and the best quarter clear $5,700. Revenue per listing rose 17% over the year, helped by nightly rates 13% higher, even as the number of listings grew 17%. Its 197 listings make it one of the smaller ranked markets, so its figures are less settled than those of larger ones.
- When it earns
- Revenue in Bremerton concentrates from June to September: July earns about $7,170 per listing, about 2.7 times as much as February. Guests stay about 7 nights, longer than in most of Washington State, and book about 40 days ahead.
- What sells
- The most common entire home has 2 bedrooms (34% of entire homes), and houses make up 77% of supply.
- Who it suits
- Best for buyers who would rather price for occupancy than for rate and can ride out a slow February.
Revenue per listing by month
$7,170 $2,680- Median listing
- $3,320/mo
- Top 25% of listings
- $5,700+/mo
- Booked ahead
- 40 days
- Average stay
- 7 nights
- Most common home size
- 2 bedrooms
- Superhosts
- 66%
9. Leavenworth
Known for: High earnings · Large market
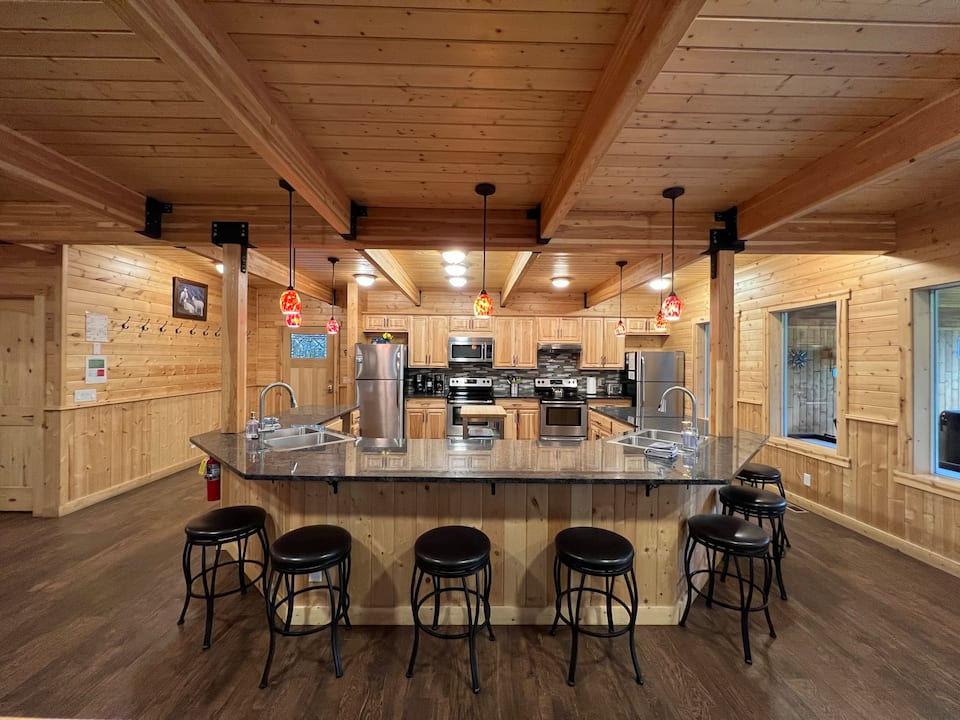
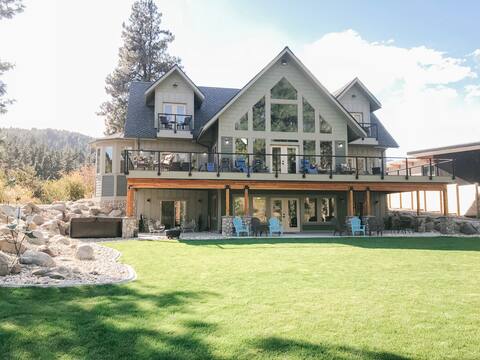

Top-earning Airbnb listings in Leavenworth - Avg. revenue
- $58,000 +8% vs. last year
- Occupancy
- 43%
- Nightly rate
- $390
- Active listings
- 638
Where it places among the 69 ranked markets in Washington State
- Revenue 5th of 69
- Occupancy 41st of 69
- Market size 5th of 69
- Year-round 55th of 69
- Growth 47th of 69
- How it earns
- Leavenworth is Washington State's fifth-largest Airbnb market, with 638 active listings to price against. Listings averaged $58,000 in revenue over the year, the fifth-highest of the 69 ranked markets. Month to month, the median listing earns about $4,340 and a top-quarter listing $7,020 or more. Revenue per listing rose 8% over the year, helped by nightly rates 12% higher.
- When it earns
- Leavenworth has two seasons, June–August and December–January. December is the strongest month at about $11,100 per listing, and April the quietest at about $2,870. Visits are quick, about 3 nights on average against 4 nights for the typical market in Washington State, booked about 58 days ahead.
- What sells
- Two-bedroom homes lead the market (37% of entire homes), and houses make up 34% of supply.
- Who it suits
- A good fit for buyers who are prepared for thin bookings around April and plan to use a professional manager or run a polished operation.
Revenue per listing by month
$11,100 $2,870- Median listing
- $4,340/mo
- Top 25% of listings
- $7,020+/mo
- Booked ahead
- 58 days
- Average stay
- 3 nights
- Most common home size
- 2 bedrooms
- Superhosts
- 80%
Areas in the full report: Downtown Leavenworth · Lake Wenatchee · Icicle Road
Full Leavenworth Airbnb report10. Friday Harbor
Known for: High earnings
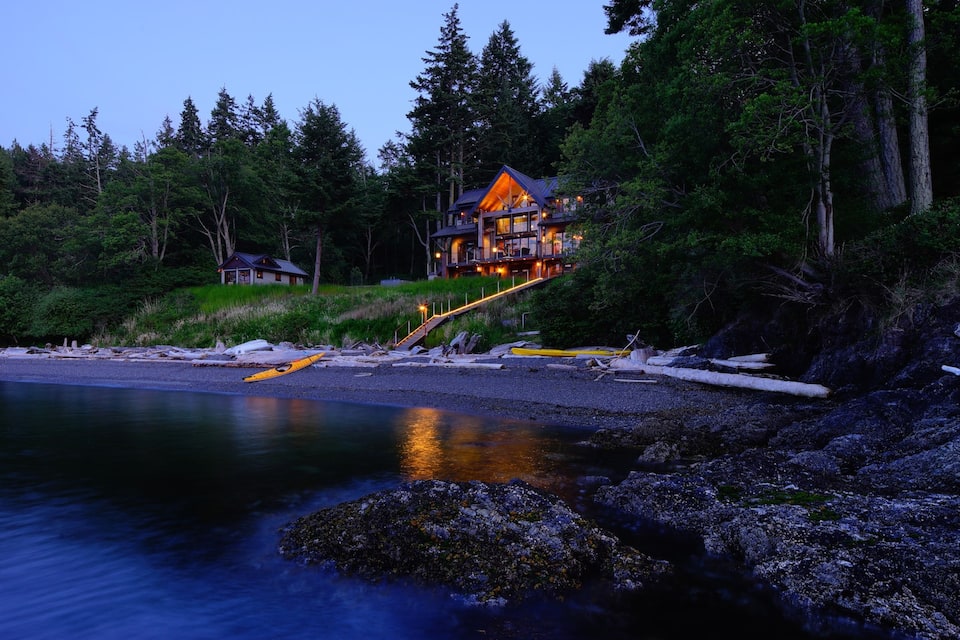
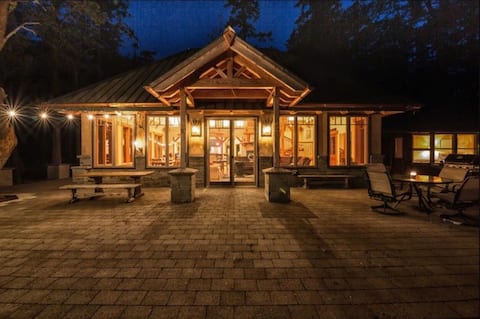
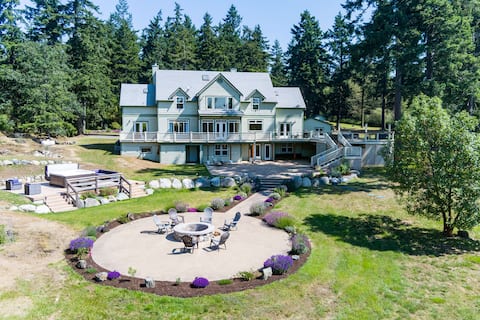
Top-earning Airbnb listings in Friday Harbor - Avg. revenue
- $59,500 +12% vs. last year
- Occupancy
- 44%
- Nightly rate
- $470
- Active listings
- 229
Where it places among the 69 ranked markets in Washington State
- Revenue 3rd of 69
- Occupancy 31st of 69
- Market size 24th of 69
- Year-round 67th of 69
- Growth 34th of 69
- How it earns
- Nightly rates set Friday Harbor apart: about $470, 58% above the Washington State average. That adds up to $59,500 per listing over the year, the third-highest of the 69 ranked markets. A typical listing takes in about $4,550 a month; the top quarter clear $8,450 or more. Revenue per listing rose 12% over the year, helped by nightly rates 14% higher. With 229 listings it is a small market, so its averages can move more from year to year.
- When it earns
- In Friday Harbor, the months from June to September earn above the yearly average, led by July at about $12,900 per listing; February is the low point at about $2,370. Guests book early, about 65 days ahead against roughly 50 for the typical market in Washington State, and stay about 4 nights.
- The competition
- Professional managers run 38% of listings, against about 12% in the typical market in Washington State, and the largest operator runs 78 listings, so new hosts compete with polished operations.
- What sells
- The most common entire home has 1 bedroom (40% of entire homes), and houses make up 45% of supply.
- Who it suits
- It suits buyers who can carry costs through a quiet February and can furnish and price for a premium stay.
Revenue per listing by month
$12,900 $2,370- Median listing
- $4,550/mo
- Top 25% of listings
- $8,450+/mo
- Booked ahead
- 65 days
- Average stay
- 4 nights
- Most common home size
- 1 bedroom
- Superhosts
- 80%
Full ranking
How All 69 Ranked Markets in Washington State Compare
The overall ranking with the five measures behind it. "Slow month" is a market's weakest month of revenue as a share of its best, so a higher figure means steadier income. Select a column heading to re-sort.
| Port Angeles High occupancy, large market | $54,044 | 51% | $320 | 22% | +15% | 731 | |
| Bellingham High occupancy, large market | $39,258 | 52% | $246 | 38% | +20% | 380 | |
| Seattle Large market, high occupancy | $41,659 | 50% | $269 | 31% | +19% | 5,446 | |
| 4 | Ashford High occupancy, large market | $51,570 | 51% | $279 | 25% | +11% | 361 |
| 5 | Bainbridge Island High occupancy, high earnings | $52,074 | 48% | $351 | 35% | +20% | 147 |
| 6 | Forks High occupancy, large market | $46,489 | 50% | $249 | 21% | +20% | 358 |
| 7 | Cle Elum High earnings, large market | $70,309 | 34% | $661 | 38% | +12% | 493 |
| 8 | Bremerton High occupancy, growing revenue | $37,167 | 49% | $249 | 37% | +17% | 197 |
| 9 | Leavenworth High earnings, large market | $58,031 | 43% | $391 | 26% | +8% | 638 |
| 10 | Friday Harbor High earnings | $59,463 | 44% | $469 | 18% | +12% | 229 |
| 11 | Packwood Large market, high earnings | $45,118 | 46% | $291 | 26% | +8% | 351 |
| 12 | Vancouver Large market, high occupancy | $27,178 | 49% | $191 | 48% | +12% | 556 |
| 13 | Tacoma Large market, high occupancy | $27,164 | 47% | $201 | 47% | +13% | 761 |
| 14 | Sequim Large market, high occupancy | $39,388 | 47% | $281 | 25% | +12% | 348 |
| 15 | Kirkland High occupancy, growing revenue | $34,494 | 46% | $284 | 39% | +16% | 282 |
| 16 | Olympia High occupancy, large market | $30,946 | 49% | $225 | 40% | +10% | 333 |
| 17 | Oak Harbor High earnings, high occupancy | $50,870 | 46% | $356 | 30% | +10% | 152 |
| 18 | Spokane Large market, high occupancy | $26,338 | 46% | $191 | 49% | +11% | 830 |
| 19 | Eastsound High earnings | $56,144 | 40% | $420 | 21% | +11% | 284 |
| 20 | Clinton Growing revenue, high earnings | $52,864 | 44% | $376 | 32% | +22% | 113 |
| 21 | Vashon Growing revenue, high earnings | $44,138 | 44% | $340 | 34% | +21% | 127 |
| 22 | Gold Bar High earnings, high occupancy | $48,296 | 45% | $338 | 43% | 0% | 120 |
| 23 | Ronald High earnings | $58,736 | 35% | $486 | 35% | +4% | 162 |
| 24 | Anacortes High occupancy, growing revenue | $35,671 | 47% | $270 | 32% | +13% | 167 |
| 25 | Langley High earnings, growing revenue | $46,942 | 41% | $365 | 31% | +18% | 136 |
| 26 | Snohomish Growing revenue, high occupancy | $36,996 | 46% | $278 | 38% | +23% | 113 |
| 27 | Redmond Growing revenue, high occupancy | $32,507 | 45% | $247 | 35% | +27% | 194 |
| 28 | Gig Harbor High occupancy, high earnings | $41,473 | 46% | $321 | 36% | +3% | 145 |
| 29 | Port Townsend High occupancy | $33,111 | 48% | $236 | 40% | +12% | 133 |
| 30 | Seabrook High earnings | $54,665 | 33% | $513 | 21% | +10% | 291 |
| 31 | White Salmon | $38,961 | 44% | $301 | 34% | +10% | 148 |
| 32 | Manson Growing revenue, high earnings | $57,228 | 35% | $566 | 14% | +28% | 138 |
| 33 | Winthrop Growing revenue, high earnings | $41,064 | 39% | $324 | 31% | +15% | 186 |
| 34 | Bellevue Large market | $30,891 | 43% | $265 | 40% | +6% | 432 |
| 35 | Burien Growing revenue, high occupancy | $27,510 | 45% | $217 | 40% | +20% | 165 |
| 36 | Shoreline Growing revenue, high occupancy | $26,862 | 47% | $202 | 34% | +21% | 186 |
| 37 | Edmonds High occupancy | $37,633 | 47% | $315 | 36% | +7% | 115 |
| 38 | Port Orchard High occupancy | $36,865 | 50% | $266 | 33% | +3% | 125 |
| 39 | Moclips High earnings, growing revenue | $60,895 | 37% | $516 | 24% | +16% | 109 |
| 40 | East Wenatchee High earnings | $51,148 | 43% | $373 | 35% | +2% | 105 |
| 41 | Freeland Growing revenue, high earnings | $44,285 | 41% | $386 | 27% | +25% | 110 |
| 42 | Coupeville High earnings | $43,482 | 42% | $347 | 30% | +12% | 121 |
| 43 | Walla Walla | $39,251 | 39% | $343 | 33% | +2% | 255 |
| 44 | Deming | $34,195 | 38% | $311 | 42% | +5% | 231 |
| 45 | Everett Growing revenue | $21,378 | 44% | $199 | 48% | +27% | 187 |
| 46 | Chelan Large market, high earnings | $42,465 | 30% | $518 | 15% | +5% | 461 |
| 47 | Westport Growing revenue | $35,579 | 34% | $315 | 28% | +46% | 209 |
| 48 | Mount Vernon High occupancy | $34,998 | 47% | $274 | 30% | +6% | 127 |
| 49 | Renton Large market | $25,697 | 43% | $216 | 38% | +8% | 304 |
| 50 | Spokane Valley High occupancy | $25,804 | 47% | $189 | 44% | +6% | 137 |
| 51 | Long Beach High earnings | $41,555 | 35% | $326 | 22% | +1% | 231 |
| 52 | Kennewick Year-round demand, high occupancy | $24,868 | 45% | $188 | 55% | +4% | 148 |
| 53 | Lynnwood Growing revenue | $24,574 | 43% | $212 | 41% | +17% | 145 |
| 54 | Birch Bay Growing revenue | $27,776 | 35% | $263 | 36% | +28% | 139 |
| 55 | Yakima Year-round demand | $24,348 | 42% | $204 | 50% | +10% | 156 |
| 56 | Hoodsport | $36,587 | 41% | $274 | 27% | +12% | 119 |
| 57 | Ellensburg Year-round demand | $28,319 | 41% | $239 | 51% | +8% | 102 |
| 58 | Kent | $23,153 | 43% | $205 | 43% | +5% | 165 |
| 59 | Tukwila Growing revenue | $26,409 | 44% | $226 | 36% | +15% | 111 |
| 60 | SeaTac Growing revenue | $24,782 | 40% | $213 | 37% | +22% | 145 |
| 61 | Camano | $36,675 | 38% | $344 | 33% | +6% | 113 |
| 62 | Moses Lake | $35,875 | 37% | $330 | 34% | +6% | 118 |
| 63 | Ocean Shores Large market | $30,215 | 34% | $264 | 25% | +7% | 323 |
| 64 | Shelton | $33,410 | 37% | $303 | 29% | +3% | 167 |
| 65 | Federal Way | $25,827 | 40% | $265 | 41% | +8% | 116 |
| 66 | Pullman | $27,599 | 37% | $297 | 40% | −9% | 120 |
| 67 | Richland | $22,599 | 44% | $189 | 39% | +4% | 122 |
| 68 | Quincy Growing revenue | $25,518 | 30% | $462 | 30% | +14% | 147 |
| 69 | Sunland Estates Growing revenue | $34,494 | 25% | $504 | 24% | +12% | 103 |
By measure
Washington State Airbnb Markets Ranked by Revenue, Nightly Rate and Occupancy
The overall ranking balances five measures. These lists take one at a time, for buyers who care most about income, pricing power, bookings, a steady calendar, momentum or market size.
Highest-earning Airbnb markets in Washington State
Average annual revenue per active listing over the past 12 months. Markets with at least 200 listings.
| # | Market | Revenue |
|---|---|---|
| Cle Elum #7 overall | $70,300 | |
| Friday Harbor #10 overall | $59,500 | |
| Leavenworth #9 overall | $58,000 | |
| 4 | Eastsound #19 overall | $56,100 |
| 5 | Seabrook #30 overall | $54,700 |
| 6 | Port Angeles #1 overall | $54,000 |
| 7 | Ashford #4 overall | $51,600 |
| 8 | Forks #6 overall | $46,500 |
| 9 | Packwood #11 overall | $45,100 |
| 10 | Chelan #46 overall | $42,500 |
| 11 | Seattle #3 overall | $41,700 |
| 12 | Long Beach #51 overall | $41,600 |
| 13 | Sequim #14 overall | $39,400 |
| 14 | Bellingham #2 overall | $39,300 |
| 15 | Walla Walla #43 overall | $39,300 |
| 16 | Westport #47 overall | $35,600 |
| 17 | Kirkland #15 overall | $34,500 |
| 18 | Deming #44 overall | $34,200 |
| 19 | Olympia #16 overall | $30,900 |
| 20 | Bellevue #34 overall | $30,900 |
| 21 | Ocean Shores #63 overall | $30,200 |
| 22 | Vancouver #12 overall | $27,200 |
| 23 | Tacoma #13 overall | $27,200 |
| 24 | Spokane #18 overall | $26,300 |
| 25 | Renton #49 overall | $25,700 |
Most expensive Airbnb markets in Washington State by nightly rate
Average rate per booked night. A high rate earns most where occupancy holds up too. Markets with at least 200 listings.
| # | Market | Nightly |
|---|---|---|
| Cle Elum #7 overall | $660 | |
| Chelan #46 overall | $520 | |
| Seabrook #30 overall | $515 | |
| 4 | Friday Harbor #10 overall | $470 |
| 5 | Eastsound #19 overall | $420 |
| 6 | Leavenworth #9 overall | $390 |
| 7 | Walla Walla #43 overall | $345 |
| 8 | Long Beach #51 overall | $325 |
| 9 | Port Angeles #1 overall | $320 |
| 10 | Westport #47 overall | $315 |
| 11 | Deming #44 overall | $310 |
| 12 | Packwood #11 overall | $290 |
| 13 | Kirkland #15 overall | $285 |
| 14 | Sequim #14 overall | $280 |
| 15 | Ashford #4 overall | $280 |
| 16 | Seattle #3 overall | $270 |
| 17 | Bellevue #34 overall | $265 |
| 18 | Ocean Shores #63 overall | $265 |
| 19 | Forks #6 overall | $250 |
| 20 | Bellingham #2 overall | $245 |
| 21 | Olympia #16 overall | $225 |
| 22 | Renton #49 overall | $215 |
| 23 | Tacoma #13 overall | $200 |
| 24 | Vancouver #12 overall | $190 |
| 25 | Spokane #18 overall | $190 |
Highest-occupancy Airbnb markets in Washington State
Share of available nights booked over the past 12 months. Markets with at least 200 listings.
| # | Market | Occupancy |
|---|---|---|
| Bellingham #2 overall | 52% | |
| Ashford #4 overall | 51% | |
| Port Angeles #1 overall | 51% | |
| 4 | Forks #6 overall | 50% |
| 5 | Seattle #3 overall | 50% |
| 6 | Olympia #16 overall | 49% |
| 7 | Vancouver #12 overall | 49% |
| 8 | Tacoma #13 overall | 47% |
| 9 | Sequim #14 overall | 47% |
| 10 | Spokane #18 overall | 46% |
| 11 | Kirkland #15 overall | 46% |
| 12 | Packwood #11 overall | 46% |
| 13 | Friday Harbor #10 overall | 44% |
| 14 | Renton #49 overall | 43% |
| 15 | Bellevue #34 overall | 43% |
| 16 | Leavenworth #9 overall | 43% |
| 17 | Eastsound #19 overall | 40% |
| 18 | Walla Walla #43 overall | 39% |
| 19 | Deming #44 overall | 38% |
| 20 | Long Beach #51 overall | 35% |
| 21 | Westport #47 overall | 34% |
| 22 | Ocean Shores #63 overall | 34% |
| 23 | Cle Elum #7 overall | 34% |
| 24 | Seabrook #30 overall | 33% |
| 25 | Chelan #46 overall | 30% |
Most year-round Airbnb markets in Washington State
Revenue in the slowest month as a share of the best month, so a higher figure means steadier income. Markets with at least 200 listings.
| # | Market | Slow month |
|---|---|---|
| Spokane #18 overall | 49% | |
| Vancouver #12 overall | 48% | |
| Tacoma #13 overall | 47% | |
| 4 | Deming #44 overall | 42% |
| 5 | Bellevue #34 overall | 40% |
| 6 | Olympia #16 overall | 40% |
| 7 | Kirkland #15 overall | 39% |
| 8 | Cle Elum #7 overall | 38% |
| 9 | Bellingham #2 overall | 38% |
| 10 | Renton #49 overall | 38% |
| 11 | Walla Walla #43 overall | 33% |
| 12 | Seattle #3 overall | 31% |
| 13 | Westport #47 overall | 28% |
| 14 | Leavenworth #9 overall | 26% |
| 15 | Packwood #11 overall | 26% |
| 16 | Ashford #4 overall | 25% |
| 17 | Sequim #14 overall | 25% |
| 18 | Ocean Shores #63 overall | 25% |
| 19 | Port Angeles #1 overall | 22% |
| 20 | Long Beach #51 overall | 22% |
| 21 | Forks #6 overall | 21% |
| 22 | Seabrook #30 overall | 21% |
| 23 | Eastsound #19 overall | 21% |
| 24 | Friday Harbor #10 overall | 18% |
| 25 | Chelan #46 overall | 15% |
Fastest-growing Airbnb markets in Washington State
Change in revenue per listing from the year before, among markets where it rose. Markets with at least 200 listings.
| # | Market | Change |
|---|---|---|
| Westport #47 overall | +46% | |
| Forks #6 overall | +20% | |
| Bellingham #2 overall | +20% | |
| 4 | Seattle #3 overall | +19% |
| 5 | Kirkland #15 overall | +16% |
| 6 | Port Angeles #1 overall | +15% |
| 7 | Tacoma #13 overall | +13% |
| 8 | Sequim #14 overall | +12% |
| 9 | Vancouver #12 overall | +12% |
| 10 | Friday Harbor #10 overall | +12% |
| 11 | Cle Elum #7 overall | +12% |
| 12 | Ashford #4 overall | +11% |
| 13 | Spokane #18 overall | +11% |
| 14 | Eastsound #19 overall | +11% |
| 15 | Olympia #16 overall | +10% |
| 16 | Seabrook #30 overall | +10% |
| 17 | Renton #49 overall | +8% |
| 18 | Packwood #11 overall | +8% |
| 19 | Leavenworth #9 overall | +8% |
| 20 | Ocean Shores #63 overall | +7% |
| 21 | Bellevue #34 overall | +6% |
| 22 | Deming #44 overall | +5% |
| 23 | Chelan #46 overall | +5% |
| 24 | Walla Walla #43 overall | +2% |
| 25 | Long Beach #51 overall | +1% |
Largest Airbnb markets in Washington State
Active listings. Bigger markets have more comparable rentals to price against and more buyers at resale.
| # | Market | Listings |
|---|---|---|
| Seattle #3 overall | 5,450 | |
| Spokane #18 overall | 830 | |
| Tacoma #13 overall | 761 | |
| 4 | Port Angeles #1 overall | 731 |
| 5 | Leavenworth #9 overall | 638 |
| 6 | Vancouver #12 overall | 556 |
| 7 | Cle Elum #7 overall | 493 |
| 8 | Chelan #46 overall | 461 |
| 9 | Bellevue #34 overall | 432 |
| 10 | Bellingham #2 overall | 380 |
| 11 | Ashford #4 overall | 361 |
| 12 | Forks #6 overall | 358 |
| 13 | Packwood #11 overall | 351 |
| 14 | Sequim #14 overall | 348 |
| 15 | Olympia #16 overall | 333 |
| 16 | Ocean Shores #63 overall | 323 |
| 17 | Renton #49 overall | 304 |
| 18 | Seabrook #30 overall | 291 |
| 19 | Eastsound #19 overall | 284 |
| 20 | Kirkland #15 overall | 282 |
| 21 | Walla Walla #43 overall | 255 |
| 22 | Deming #44 overall | 231 |
| 23 | Long Beach #51 overall | 231 |
| 24 | Friday Harbor #10 overall | 229 |
| 25 | Westport #47 overall | 209 |
Seasonality
When Airbnbs in Washington State Earn the Most
July is the best month for about seven in ten ranked markets in Washington State. January is the most common slowest month, in 33 markets.
July earns about 2.9 times what February does
Average revenue per listing across the 69 ranked markets in Washington State, by month
| Month | Avg. revenue per listing | Best month for | Highest-ranked examples |
|---|---|---|---|
| January | $2,630 | – | – |
| February | $2,540 | – | – |
| March | $2,960 | – | – |
| April | $3,050 | – | – |
| May | $3,940 | – | – |
| June | $6,260 | 9 markets | Seattle, Spokane, Redmond |
| July | $7,330 | 49 markets | Port Angeles, Bellingham, Ashford |
| August | $6,570 | 10 markets | Port Townsend, Seabrook, Deming |
| September | $4,630 | – | – |
| October | $3,390 | – | – |
| November | $2,910 | – | – |
| December | $3,420 | 1 market | Leavenworth |
Average revenue is per listing across the ranked markets, the line in the chart above. "Best month for" counts the ranked markets whose own revenue peaks in that month.
Management
Who Manages Airbnbs in Washington State?
AirROI ranks the 50 largest of the 199 companies that run 5 or more Airbnb listings in Washington State, by listings, guest rating and growth; companies run 21% of its listings.
Method
How the Ranking Works
The ranking covers the 69 markets in Washington State with at least 100 active Airbnb listings and data through October 2026. Each market is compared with the others on five measures, and markets are ordered by a weighted blend of where they place on each:
- Revenue per listing (35%): average revenue an active listing earned over the past 12 months.
- Occupancy (20%): share of available nights that were booked.
- Market size (20%): active listings. Bigger markets offer more comparable rentals to price against and more buyers when you sell.
- Year-round demand (15%): revenue in the slowest month as a share of the best month. The latest month is left out when its bookings look incomplete.
- Growth (10%): change in revenue per listing from the year before. Markets whose boundaries changed between years are scored in the middle.
Left out: 27 markets whose data predate the latest refresh and 2 towns listed a second time under another spelling. The score measures how rentals perform. It does not include purchase prices, financing, operating costs or local short-term rental rules, which vary by address and should be checked before buying. Figures are in US dollars and match each market's own report; see the data methodology for how listings are tracked.
To check one property before buying, run its address and size through the free Airbnb calculator for a revenue, occupancy and nightly-rate range from comparable listings.
FAQ
Frequently Asked Questions About Airbnb Investing in Washington State
What is the best place to buy an Airbnb in Washington State?
Port Angeles ranks first of the 69 markets in Washington State in AirROI's ranking, with $54,000 in average revenue per listing and 51% occupancy. Bellingham and Seattle follow. The ranking weighs revenue, occupancy, market size, seasonality and growth; it leaves out purchase prices.
What are the most profitable Airbnb locations in Washington State?
By revenue per listing, among markets with at least 200 listings, Cle Elum leads at $70,300 a year, ahead of Friday Harbor at $59,500. Profit also depends on what a property costs to buy and run, which varies far more between markets than revenue does.
How much does an Airbnb make in Washington State?
The average active listing in Washington State earned $38,600 over the 12 months to October 2026, at 44% occupancy. Across the ranked markets, the middle half averaged between $27,600 and $45,100 per listing. Averages include listings that operated for only part of the year, so a listing rented all year typically earns more.
What is a good Airbnb occupancy rate in Washington State?
The average listing in Washington State was booked on 44% of available nights over the past 12 months. Half of the ranked markets fall between 39% and 47%, so a market above about 47% sits in the top quarter. Occupancy is only half the picture: a market with lower occupancy can still earn more if its nightly rates are higher.
Where is Airbnb demand highest in Washington State?
Among ranked markets with at least 200 listings, Bellingham has the highest occupancy, with 52% of available nights booked, followed by Ashford at 51%. Its listings average about $245 a night and $39,300 a year.
Where are Airbnb nightly rates highest in Washington State?
Among ranked markets with at least 200 listings, Cle Elum has the highest average nightly rate, about $660, followed by Chelan at $520. Spokane is the least expensive, at about $190. The average booked night in Washington State costs about $295.
What is the best month for Airbnb in Washington State?
July is the highest-earning month for 49 of the 69 ranked markets, followed by August (10). January is the most common slowest month, in 33 of the 69 markets. Each market's report shows its own month-by-month revenue, occupancy and rates.
Which Airbnb markets in Washington State earn the most evenly through the year?
Among ranked markets with at least 200 listings, Spokane has the steadiest income: its slowest month, January, still earns about half of its best. Vancouver follows, at 48%. Steadier markets are easier to budget for, though they do not always earn the most per listing.
Which Airbnb markets are growing fastest in Washington State?
Among ranked markets with at least 200 listings, revenue per listing grew most in Westport, up 46% on the year before, and in Forks, up 20%. A single strong year can reflect events or new supply, so it is worth checking a market's monthly trend before relying on it.
Is Airbnb still profitable in Washington State in 2026?
Revenue per listing grew in 68 of the 69 ranked markets with a comparable year of data; in the typical market it rose 12%. Whether a given property profits depends on its purchase price, financing and running costs.
What are the best smaller Airbnb markets in Washington State?
Among ranked markets with fewer than 150 active listings, Bainbridge Island (#5 overall, $52,100 per listing), Clinton (#20, $52,900) and Vashon (#21, $44,100) place highest. Smaller markets have fewer comparable rentals to price against, so their averages can move more from year to year.
How many Airbnb listings are there in Washington State?
AirROI tracked 27,800 active Airbnb listings in Washington State over the 12 months to October 2026, across 232 markets. The largest ranked market is Seattle, with 5,450 listings, followed by Spokane with 830.
Do Airbnb hosts need a permit in Washington State?
Rules can come from the state as well as the city or county, and they change often, so check both for any address you consider. In the listing data, most listings display a registration number in 1 of the 69 ranked markets, including Seattle, though that shows what hosts display, not what the rules allow.
Directory
All 232 Airbnb Markets in Washington State
Every Washington State city with an AirROI Airbnb market report, A–Z, with its active listing count.
A
- Aberdeen 28 listings
- Alderwood Manor 29 listings
- Allyn 20 listings
- Anacortes 167 listings
- Anderson Island 38 listings
- Arlington 51 listings
- Artondale 18 listings
- Ashford 361 listings
- Auburn 91 listings
B
- Bainbridge Island 147 listings
- Baring 34 listings
- Battle Ground 50 listings
- Beaver 25 listings
- Belfair 70 listings
- Bellevue 432 listings
- Bellingham 380 listings
- Benton City 19 listings
- Birch Bay 139 listings
- Blaine 76 listings
- Bonney Lake 35 listings
- Bothell 97 listings
- Bow 48 listings
- Bremerton 197 listings
- Brinnon 49 listings
- Brush Prairie 27 listings
- Buckley 22 listings
- Burien 165 listings
C
- Camano 113 listings
- Camano Island 31 listings
- Camas 67 listings
- Carlsborg 22 listings
- Carnation 24 listings
- Carson 42 listings
- Cashmere 23 listings
- Cathlamet 18 listings
- Centralia 35 listings
- Chehalis 32 listings
- Chelan 461 listings
- Chewelah 35 listings
- Chinook 18 listings
- Clallam County 24 listings
- Clarkston 41 listings
- Cle Elum 493 listings
- Clinton 113 listings
- Colbert 27 listings
- College Place 54 listings
- Colville 32 listings
- Concrete 37 listings
- Copalis Beach 46 listings
- Cottage Lake 19 listings
- Country Homes 17 listings
- Coupeville 121 listings
- Coupeville, Washington 22 listings
D
- Deming 231 listings
- Des Moines 83 listings
- Desert Aire 39 listings
- Duvall 18 listings
E
- East Wenatchee 105 listings
- Easton 35 listings
- Eastsound 284 listings
- Eatonville 51 listings
- Edgewood 19 listings
- Edmonds 115 listings
- Ellensburg 102 listings
- Enumclaw 99 listings
- Everett 187 listings
F
- Fairwood 19 listings
- Fall City 26 listings
- Federal Way 116 listings
- Ferndale 82 listings
- Forks 358 listings
- Fox Island 23 listings
- Freeland 110 listings
- Friday Harbor 229 listings
G
- Gig Harbor 145 listings
- Glacier 90 listings
- Gold Bar 120 listings
- Goldendale 35 listings
- Graham 34 listings
- Granite Falls 25 listings
- Grapeview 47 listings
- Grayland 82 listings
- Greenbank 51 listings
K
L
- La Conner 48 listings
- Lacey 49 listings
- Lake Forest Park 39 listings
- Lake Stevens 33 listings
- Lake Tapps 24 listings
- Lakebay 37 listings
- Lakewood 89 listings
- Langley 136 listings
- Leavenworth 638 listings
- Liberty Lake 22 listings
- Lilliwaup 46 listings
- Long Beach 231 listings
- Longview 47 listings
- Loon Lake 36 listings
- Lopez Island 40 listings
- Lopez Village 26 listings
- Lummi Island 42 listings
- Lyle 40 listings
- Lynden 38 listings
- Lynnwood 145 listings
M
- Maltby 17 listings
- Manchester 19 listings
- Manson 138 listings
- Maple Falls 49 listings
- Maple Valley 35 listings
- Marblemount 50 listings
- Marrowstone 20 listings
- Marysville 74 listings
- Mason County 18 listings
- Mazama 36 listings
- Mercer Island 46 listings
- Mineral 18 listings
- Moclips 109 listings
- Monroe 55 listings
- Montesano 19 listings
- Moses Lake 118 listings
- Mossyrock 30 listings
- Mount Vernon 127 listings
- Mountlake Terrace 19 listings
- Mukilteo 27 listings
N
- Naches 36 listings
- Newcastle 25 listings
- Newport 40 listings
- Nine Mile Falls 32 listings
- North Bend 64 listings
- North Creek 30 listings
O
- Oak Harbor 152 listings
- Ocean Park 73 listings
- Ocean Shores 323 listings
- Okanogan County 27 listings
- Olga 37 listings
- Olympia 333 listings
- Orondo 35 listings
- Oroville 42 listings
P
- Pacific Beach 54 listings
- Packwood 351 listings
- Parkland 39 listings
- Pasco 77 listings
- Peshastin 33 listings
- Plain 50 listings
- Point Roberts 55 listings
- Port Angeles 731 listings
- Port Ludlow 47 listings
- Port Madison Indian Reservation 30 listings
- Port Orchard 125 listings
- Port Townsend 133 listings
- Poulsbo 99 listings
- Prosser 38 listings
- Pullman 120 listings
- Puyallup 96 listings
R
S
- Sammamish 84 listings
- Seabeck 29 listings
- Seabrook 291 listings
- SeaTac 145 listings
- Seattle 5,446 listings
- Seattle Hill-Silver Firs 32 listings
- Seaview 24 listings
- Sedro-Woolley 70 listings
- Sekiu 38 listings
- Sequim 348 listings
- Shelton 167 listings
- Shoreline 186 listings
- Silverdale 41 listings
- Skykomish 69 listings
- Snohomish 113 listings
- Snoqualmie 28 listings
- Snoqualmie Pass 71 listings
- Soap Lake 31 listings
- South Bend 18 listings
- South Hill 27 listings
- Spanaway 25 listings
- Spokane 830 listings
- Spokane Valley 137 listings
- Stanwood 37 listings
- Stevenson 94 listings
- Sudden Valley 57 listings
- Sultan 22 listings
- Sunland Estates 103 listings
T
- Tacoma 761 listings
- Tahuya 39 listings
- Tanner 22 listings
- Tri-Cities 25 listings
- Trout Lake 27 listings
- Tukwila 111 listings
- Tumwater 29 listings
- Twisp 18 listings
U
- Underwood 19 listings
- Union 71 listings
- Union Hill-Novelty Hill 19 listings
- University Place 48 listings
W
- Walla Walla 255 listings
- Washougal 55 listings
- Wenatchee 92 listings
- West Richland 62 listings
- Westport 209 listings
- White Center 30 listings
- White Salmon 148 listings
- Winthrop 186 listings
- Woodinville 45 listings
- Woodland 26 listings